Moving Average Retracement Boundaries
- Indicateurs
- Siyabonga Sandile Khanyile
- Version: 1.2
- Mise à jour: 26 juin 2023
Indicator details
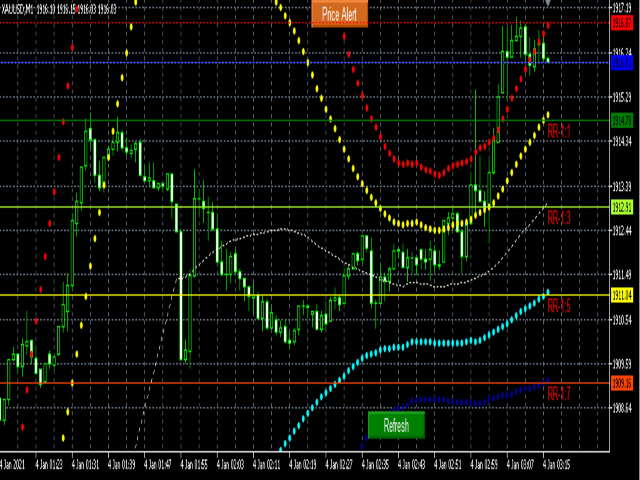
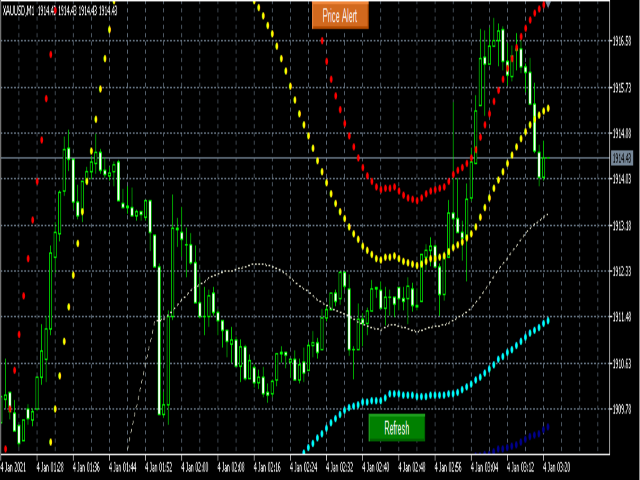
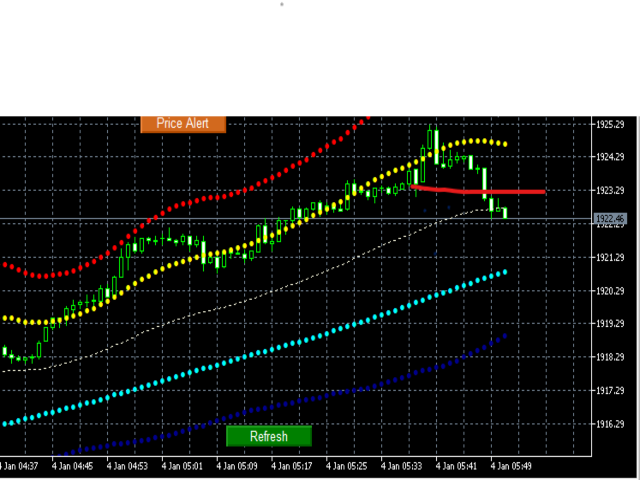
The Moving Average Retracement Boundaries(M.A.R.B) shows the average retracement level above or below the given moving average.It shows the first upper boundary(which is the average retracement above the moving average ),the second upper boundary(which is double the first upper boundary),the first lower boundary(which is the average retracement below the moving average) and the second lower boundary(which is double the first lower boundary).
How to use it
1.It can be used to find overbought points with upper boundaries and oversold points with lower boundaries.
2.It can be used to scalp small retracements
3.It can be used to detect upward trend reversals when price breaks from above first upper boundary after a strong upward trend(refer to image 3).
4.It can be used to detect downward trend reversals when price breaks from below first lower boundary after a strong downward trend.
5.It can be used to detect strong consolidations if price is in the middle of all boundaries.
Other features
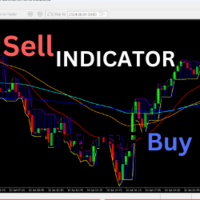
1.It recommends entries for you and gives you their entry price(blue dotted line),stop loss(red dotted line) and different take profits(solid lines) to choose from with their Risk to Reward ratio and give you alerts through email,Meta-trader and notifications when the entries are recommended(refer to image 1 and 2 for before and after).
2.It also gives you the ability to make price alerts and get notified through email,Meta-trader and notifications when that price is reached.
3.If you have the M.A.R.B trader EA you can make those recommended entries at a press of a button(https://www.mql5.com/en/market/product/101616).
*Please know that on-screen buttons don't work on strategy tester.

