RSI Dashboard For Multiple Pairs and Timeframes
- Indicateurs
- Matthew Thomas Paranac
- Version: 2.0
- Mise à jour: 4 avril 2023
- Activations: 10
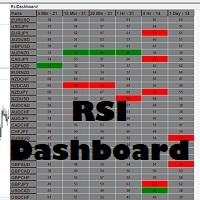
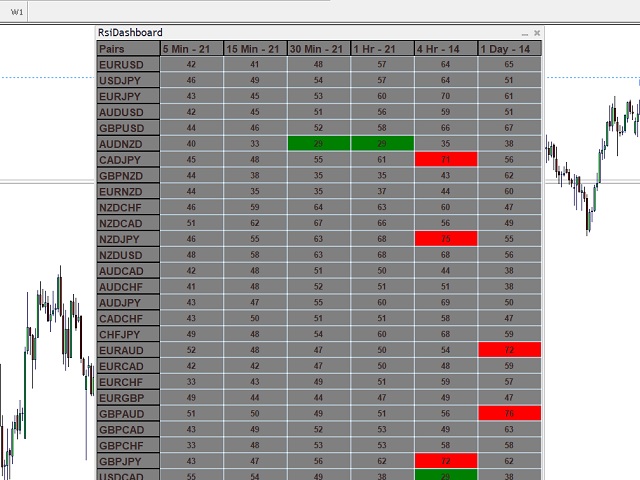
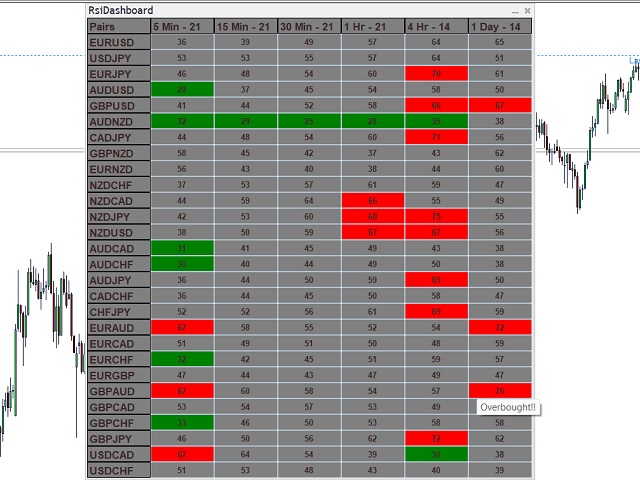
Never miss when a pair is being oversold or overbought again!! This RSI dashboard allows you to monitor RSI levels on 6 different time frames for up to 30 different currency pairs.
This dashboard is packed with features including:
1. Monitoring of 6 customizable time frames (M1, M5, M15, M30, H1, H4, D1, W1, M1)
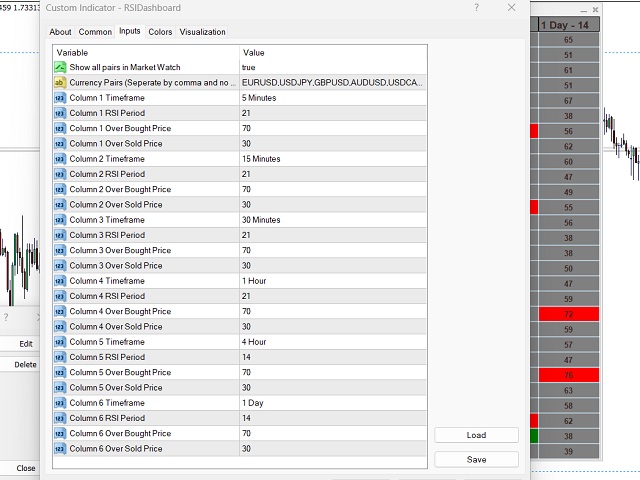
2. You can set the overbought/oversold levels you want for EACH time frame and they will be highlighted in the dashboard when a pair gets to that level
3. You can also set the RSI period you want for EACH time frame
4. Choose to enter in your own currency pairs (Up to 30) or have the dashboard start monitoring all of your pairs from MarketWatch
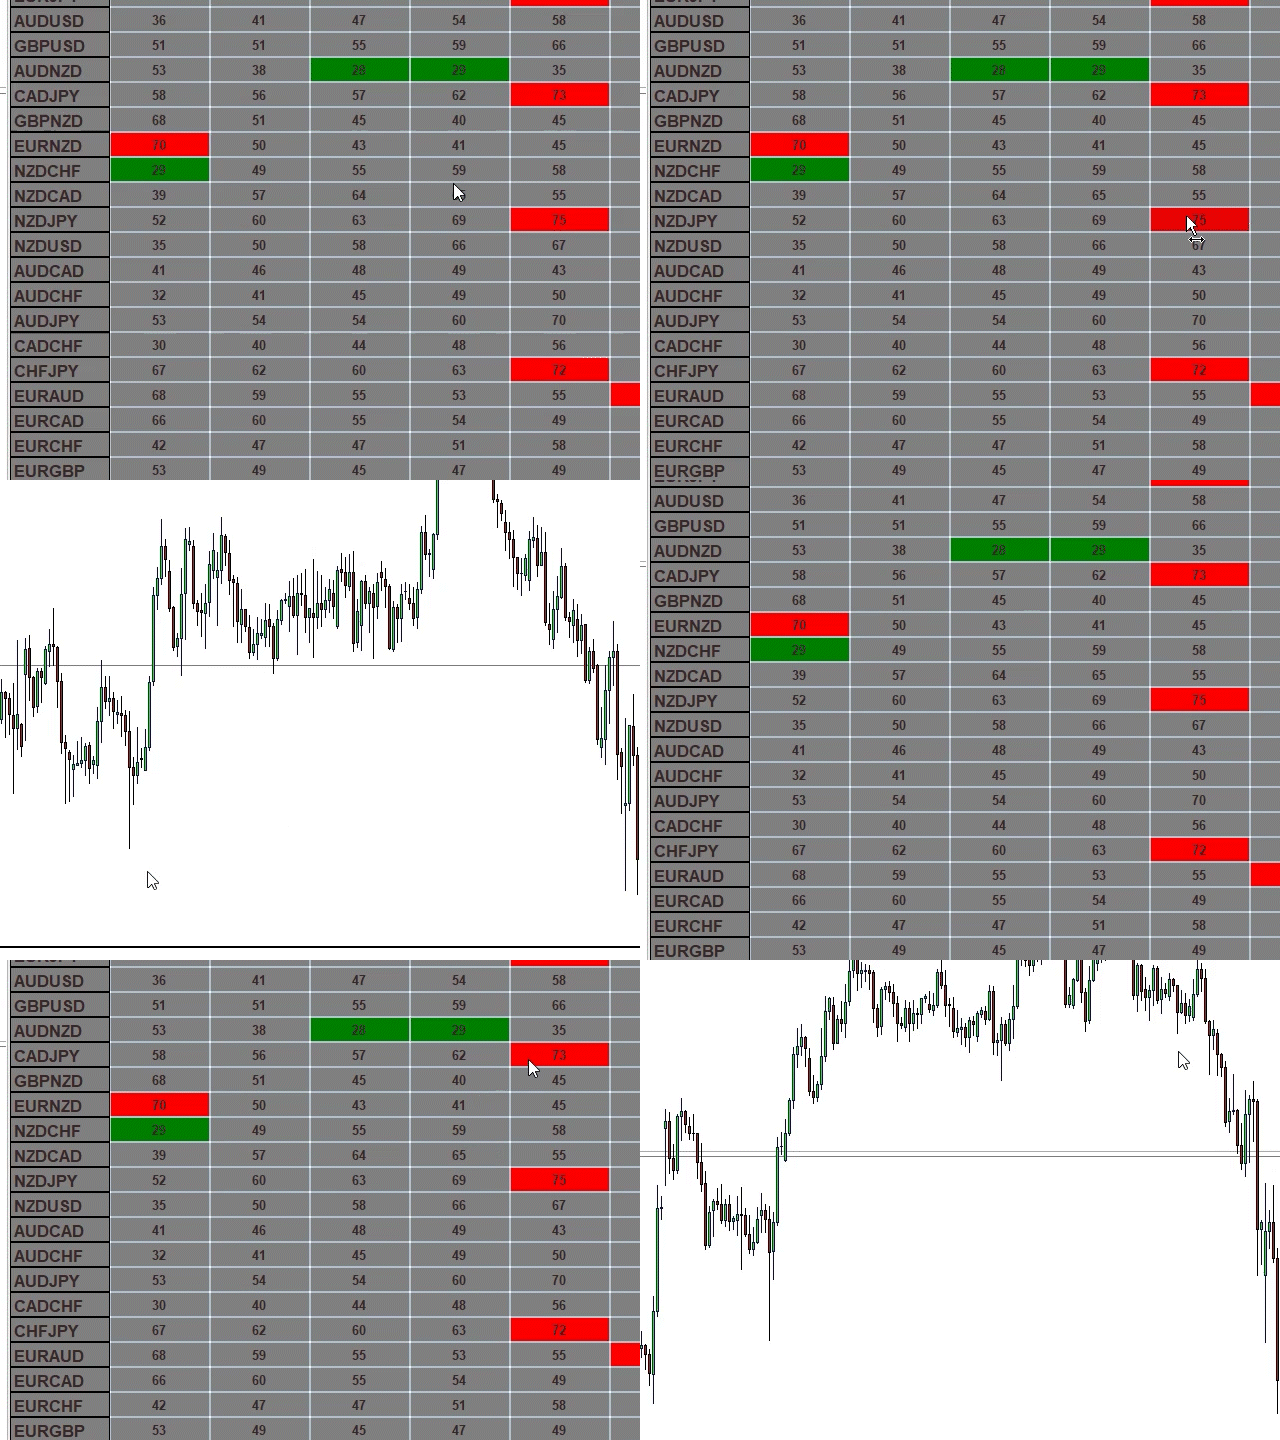
5. QUICKLY navigate to a chart by click on the corresponding RSI level in the dashboard
