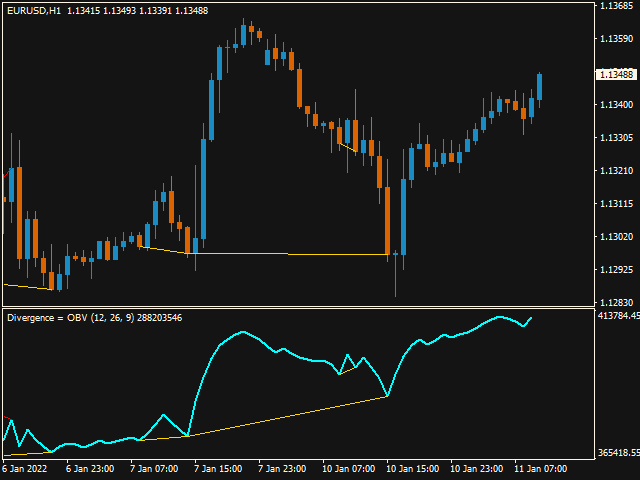
Divergence Macd Obv Rvi Ao Rsi
- Indicateurs
- Muhammed Emin Ugur
- Version: 1.0
- Activations: 10
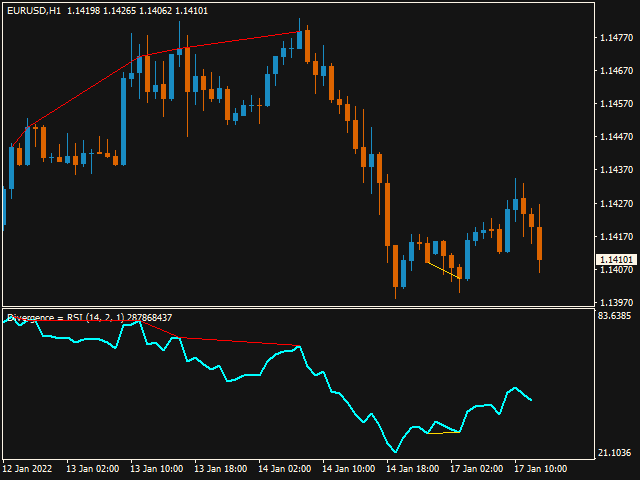
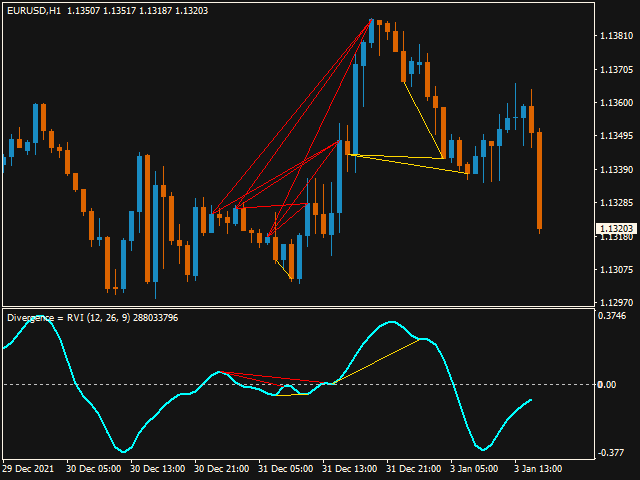
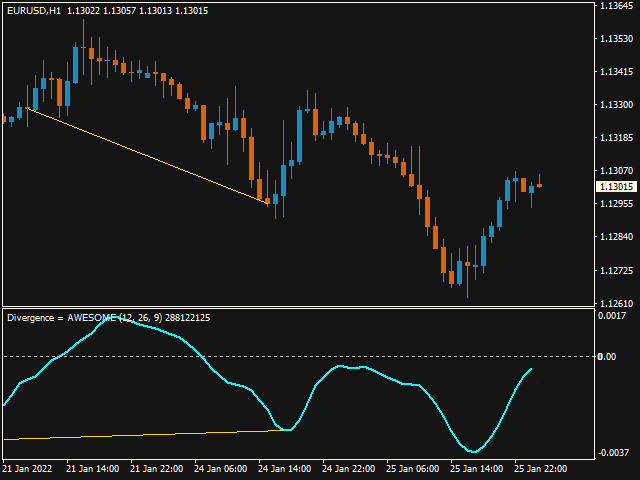
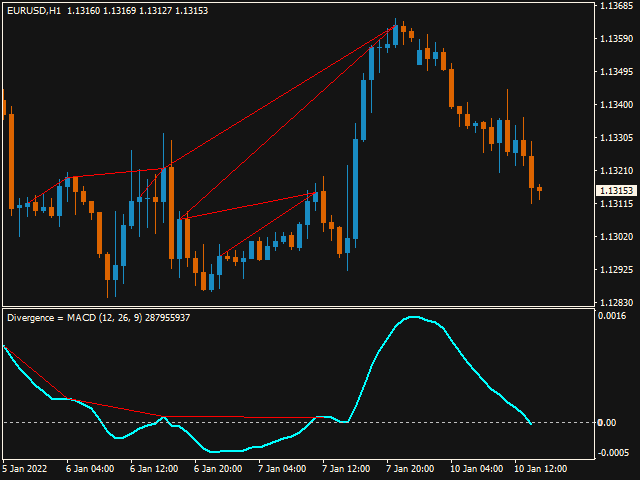
The product Divergence Macd Obv Rvi Ao Rsi is designed to find the differences between indicators and price.
It allows you to open orders or set trends using these differences.
The indicator has 4 different divergence features.
To View Our Other Products Go to the link: Other Products
Divergence types
Class A Divergence
Class B Divergence
Class C Divergence
Hidden Divergence
Product Features and Rec
ommendations
There are 5 indicators on the indicator
Indicators = Macd Obv Rvi Ao Rsi
4 different divergence types are used.
There are max depth and min depth.
Thanks to the alert feature, you can receive Alert, Push and Email alerts
The indicator has 3 different period settings. These are for indicators with multiple inputs. You can use the periods according to the number of entries in the indicator you will use.
Indicator TypeDescriptions
Types of Divergence
Different researchers provide different classification of market divergence/convergence. We will use the one that divides the divergence/convergence into classic and hidden.
Classic Divergence
The classic divergence can be identified by comparing updates of price High/Low with the same moments on the indicator chart. If the price chart has formed another new high or low, and the indicator chart has failed to, it is a sign of divergence. The market is overbought (oversold), so it is not advisable to open deals in the current trend direction.
The classic divergence is widely described in various resources. Depending on the divergence characteristics, it can be divided into three subclasses
- Class A. It occurs more often than other classes. When the asset price high/low is updated, the indicator starts reversing, which is an indication of divergence and possible upcoming reversal.
- Class B. It is similar to class A, except that the asset price cannot break an extremum, and forms the Double Top/Double Bottom reversal pattern, while the indicator does not reach its extremum.
- Class C. The price high or low is updated, and the indicator forms the Double Top pattern (Double Bottom).
Hidden Divergence
This type of divergence can also be divided into subclasses:
- Lowering price highs accompanied with growing oscillator highs show the confirmation of the downtrend.
- Growing price lows accompanied with falling oscillator lows show the confirmation of the uptrend.

