NosTraderMusLR
- Indicateurs
- Victor Gauto
- Version: 1.0
- Activations: 5
INDICATEUR DE RÉGRESSION LINÉAIRE ==>
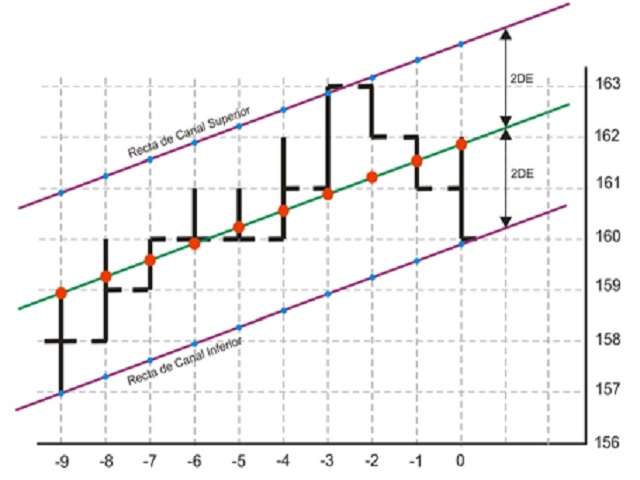
L'indicateur représente la ligne de régression linéaire et les lignes de support et de résistance, obtenues en fonction de l'écart type par rapport à la Régression Linéaire. Personnalisation : les valeurs suivantes peuvent être ajustées :
- Rango Tendencia: Le nombre de barres ou de périodes, dans le cadre temporel considéré, pris comme référence pour l'indicateur.
- AmpDesv: L'amplitude ou le nombre de fois pour considérer l'écart type de la régression linéaire pour sa représentation.
- Colores: Il est possible de choisir des couleurs d'une palette pour la représentation de chaque ligne.
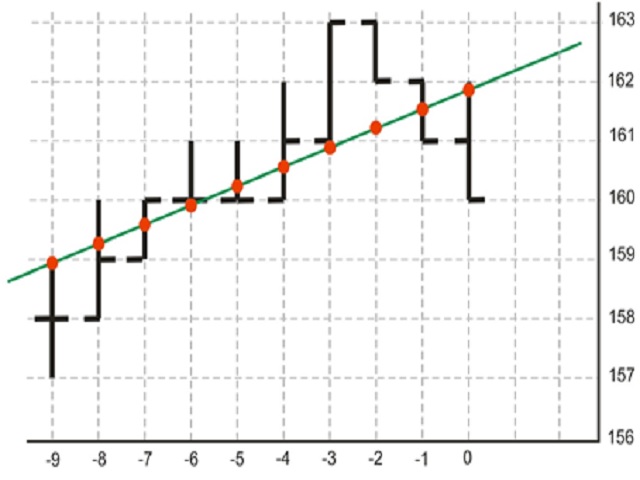
L'indicateur de Régression Linéaire est utilisé pour mesurer la relation entre deux variables, en l'occurrence le prix et le temps. L'indicateur construit une ligne droite à travers les prix de clôture de l'actif pendant une période donnée et est utilisé pour déterminer la direction de la tendance sur le marché. Si la ligne de régression est en hausse, cela indique que le marché est dans une tendance haussière, et si elle est en baisse, cela indique une tendance à la baisse.
Le principal avantage d'utiliser l'indicateur de Régression Linéaire est qu'il permet aux traders d'identifier les points d'entrée et de sortie sur le marché avec plus de précision. De plus, il est également utile pour établir des niveaux de support et de résistance, ce qui peut aider les traders à déterminer des objectifs de profit et des stop loss.
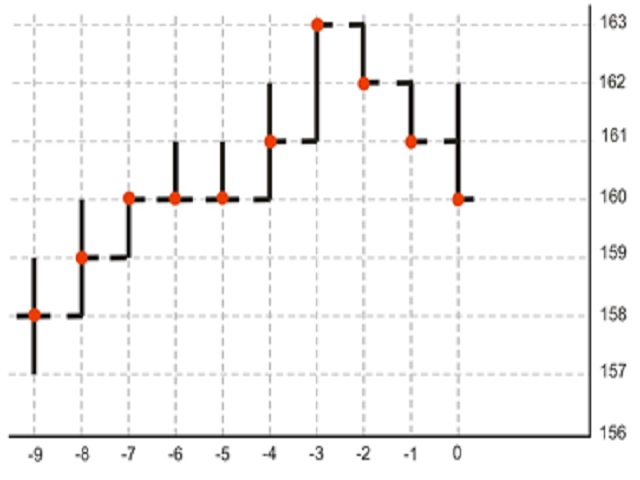
Ligne de Régression Linéaire
Une ligne de régression linéaire est un modèle mathématique utilisé en statistiques pour décrire la relation entre deux variables (dans notre cas, prix et temps). C'est une ligne droite qui s'ajuste aux points de données (prix de clôture) et représente la tendance centrale des données. Cette ligne est utilisée pour prédire la valeur d'une variable (prix) en fonction de la valeur de l'autre variable (temps), en supposant que le comportement des prix futurs est basé sur les prix passés.
Pour calculer la ligne de régression linéaire, on utilise la méthode des moindres carrés, qui consiste à minimiser la distance entre les points et la ligne. La pente de la ligne représente le changement dans la variable dépendante pour chaque changement dans la variable indépendante, tandis que l'intersection représente la valeur de la variable dépendante lorsque la variable indépendante est nulle.
Écart type d'une régression linéaire
La déviation standard d'une régression linéaire est une mesure utilisée en statistiques pour mesurer la variabilité des données autour de la ligne de régression. La déviation est calculée à partir des résidus, qui sont les différences entre les valeurs observées et les valeurs prédites par la ligne de régression. La déviation standard d'une régression linéaire est importante car elle fournit des informations sur la précision de la ligne de régression. Une faible déviation standard indique que les données sont très proches de la ligne de régression et que c'est une bonne approximation des données. Une déviation standard élevée indique que les données sont très dispersées et que la ligne de régression n'est pas une bonne approximation des données. Cependant, dans le cas du commerce d'instruments financiers et en tenant compte de la dynamique du marché, la magnitude de la déviation standard doit être interprétée de la manière suivante: une faible déviation standard indique une faible volatilité et une déviation standard élevée indique une volatilité plus élevée de l'instrument ou de l'actif soumis à l'analyse pour la période considérée.