High Pass Filter Candlesticks
- Indicateurs
- Safwan Rushdi Khalil Arekat
- Version: 1.3
- Mise à jour: 8 mars 2023
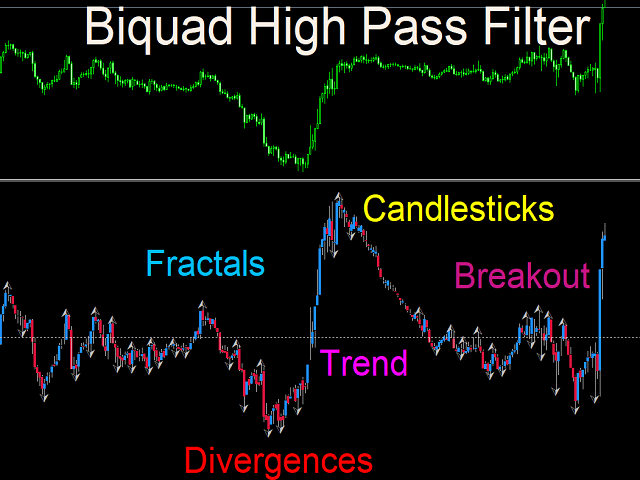
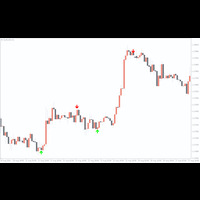
This indicator applies the biquad high pass filter to the price-chart data, and displays the filter output for the OHLC as candlesticks. The candlesticks corresponds to the actual calculations of the filter value during the formation of each price bar (not from all historical highs lows or closes). The shape of the bars therefore corresponds directly to the shape of each price bar.
High pass filters are an underappreciated type of oscillator that are seldom used in technical analysis in the straightforward manner used in this indicator. My two previous free indicators ( DFT of Price and Q n D Frequency Response) give an introduction to the characteristics of high pass and other digital filter. In short, a high pass filter quenches the low frequency components of a signal and preserves the high frequency ones. It acts to de-trend a signal by removing the trend and keeping the volatility and cyclic components.
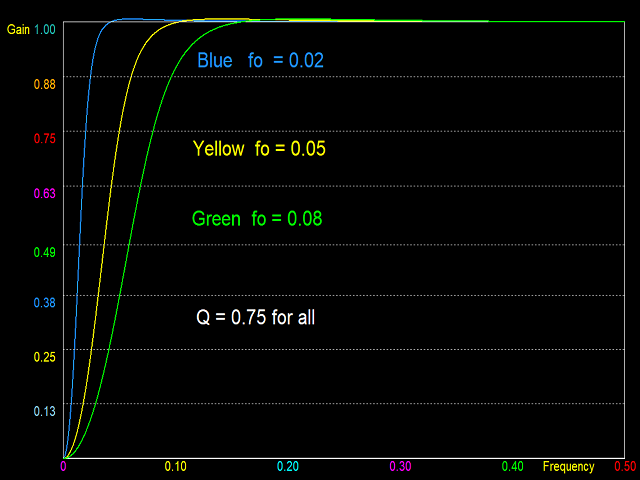
The indicator is designed to accentuate the trend cycles that remain after the removal of the major trend. The price generally goes up when the HPF is above the zero line, and goes down when the HPF is below the zero line. To demonstrate all this, the first screenshot shows the magnitude frequency response of the Biquad HPF of this indicator for the case Q=0.75, and for three different values of fo . The initial rise from zero approximates (roughly) a momentum response (differentiation). The entire pattern of oscillations is driven above or below zero depending on the slope of the low frequency components which correspond to the longer range trend, while the high frequency components pass without attenuation with zero lag.
Trend following techniques, chart patters, and divergences can be used to obtain trading signals.
Inputs
fo form 0 to 0.5
Q: keep at 0.75 for a flat pass-band.

