Quantile Moving Average Channels
- Indicateurs
- Thore Johannsen
- Version: 1.0
- Activations: 5
Quantile Moving Average Channels
"KNOW WHERE OTHER MARKET PARTICIPANTS ACT"
General
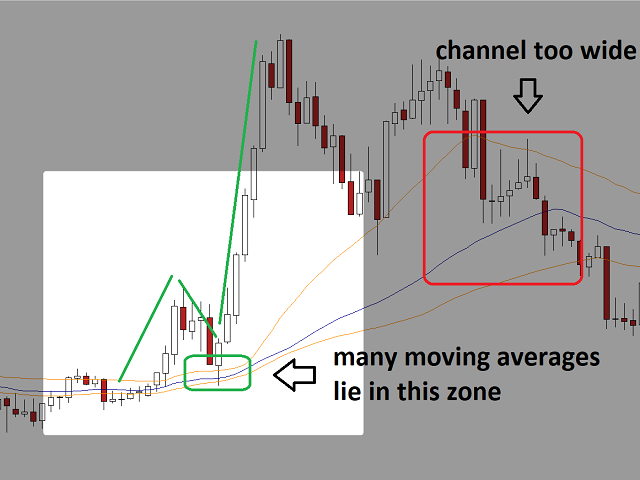
See where zones of interest exist with quantile MA channels. It plots three lines on the main chart: two outer lines and a mid line.
Most of all commonly used moving averages are between the upper and the lower band, if the input parameters are chosen properly.
This means that if the channel is relatively small, other market participants that rely on moving averages may act if the price action is near the midline.
Overall, the indicator hints towards trend (see direction of moving averages) and volatility (see how wide the channel is).
How it works
The indicator calculates all moving averages between a min and a max period and calculates the corresponding quantiles to display.
This way, each bar a channel band or the midline can exist of different moving averages (= it's not the same as plotting e.g. 5 MAs on the chart).
Parameters
- Min MA Period: the period of the "fastest" MA
- Max MA Period: the period of the "slowest" MA
- Lower Quantile Value: the lower quantile, e.g. 0.2 (=20%)
- Mid Quantile Value: the middle quantile, e.g. 0.5 (=50%, the median)
- Upper Quantile Value: the upper quantile, e.g. 0.8 (=80%)
- Moving Average Type: the MA caluclation method, e.g. SMA or EMA
- Input Price: price type to use for the calculation, e.g. close or median price
Note
This indicator, its description, the screenshots, and other related materials are for informational purposes only, they are not investment advice.


