DC Donchian Channel Turtle Trade
- Indicateurs
- Emin Ulucanli
- Version: 1.10
- Mise à jour: 7 mars 2023
DONCHIAN CHANNEL DC
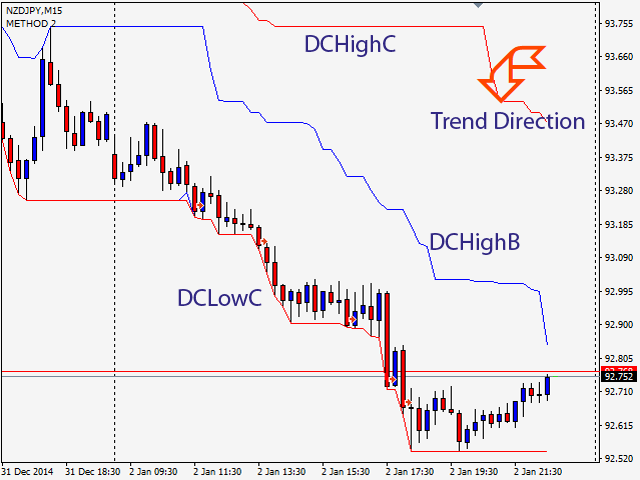
Il s'agit d'un indicateur de tendance développé par “Richard Donchian”, composé de 3 couches, le canal supérieur, le canal inférieur et le canal intermédiaire. Il est créé sur le canal Donchian en traçant les prix les plus élevés et les plus bas atteints au cours de la période précédente sur le graphique des prix. Il est également utilisé pour mesurer la volatilité du marché, car il s'agit d'un canal d'expansion/contraction en fonction de l'augmentation/diminution de la volatilité des prix.
Method 0 ; Dessin de l'indicateur de canal Donchian.
Signaux BUY/SELL ;
Method 1 ; Une stratégie utilisant des voies 20 périodes (20DC) et 10 périodes (10DC)),
- Lorsque la barre se ferme au-dessus du haut (20DC)), le signal BUY commence. Si la barre revient et se ferme en dessous du bas (10DC), BUY se termine.
- Lorsque la barre se ferme en dessous de la valeur inférieure (20DC)), le signal SELL démarre. Si la barre revient et se ferme au-dessus de la valeur supérieure (10DC), SELL se termine.
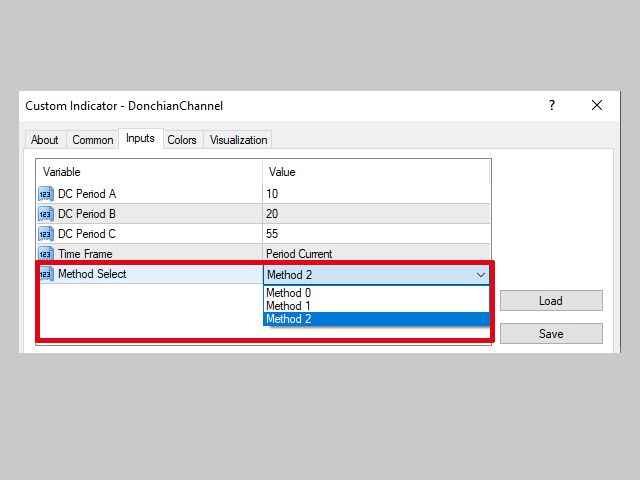
Method 2 ; Une stratégie utilisant des voies 55 périodes (55DC) et 20 périodes (20DC)),
- Lorsque la barre se ferme au-dessus du haut (55DC)), le signal BUY démarre. Si la barre revient et se ferme en dessous du bas (20DC), BUY se termine.
- Lorsque la barre se ferme en dessous de la valeur inférieure (55DC)), le signal SELL démarre. Si la barre revient et se ferme au-dessus de la valeur supérieure (20DC), SELL se termine.
Valeurs par défaut de l'indicateur ;
DCHighA-DCLowA; Période; 10 couleurs ; eau de mer
DCHighB-DCLowB; Période; 20 couleurs ; Bleu
DCHighC-DCLowC; Période; 55 couleurs ; Rouge
MT4で使用出来たインジケータ使え無いのが多い気がする。