• Aperçu
  • Avis
  • Commentaires
  • Nouveautés

UR Gamma

UR Gamma
(alimenté par des calculs similaires trouvés dans les systèmes d'apprentissage automatique)

UR Gamma est un outil d'analyse financière de pointe qui offre une version nouvelle et améliorée de l'indicateur classique WaveTrend. En incorporant des techniques avancées de traitement du signal numérique, UR Gamma répond à certaines des limites des algorithmes WaveTrend traditionnels et fournit une approche plus précise, robuste et dynamique pour identifier et mesurer les tendances de l'action des prix.

Avantages de l'utilisation d'UR Gamma :

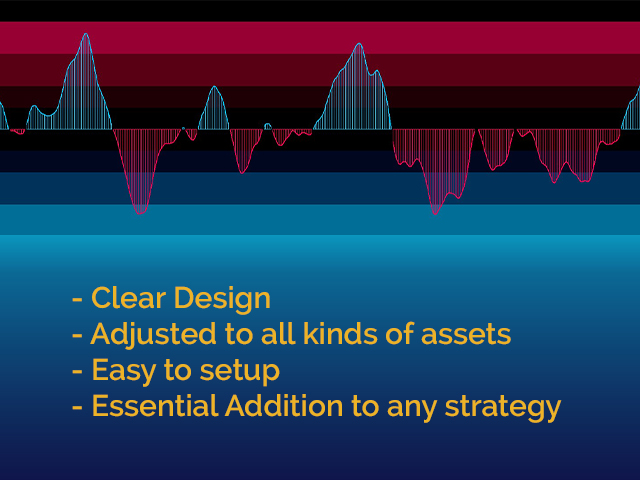
Configuration minimaliste
Toutes les données sont calculées en arrière-plan - avec une seule sortie pour l'utilisateur - claires et nettes.
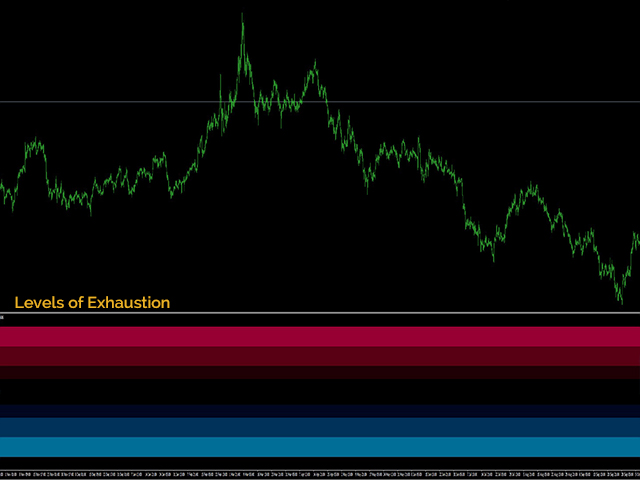
Niveaux de fond pour suggérer l'épuisement
Ajusté à toutes sortes d'actifs.
Il y a un chat spécial par télégramme sur lequel vous pouvez rester au courant des mises à jour des outils et également envoyer une demande si vous pensez qu'il manque quelque chose !


Pourquoi UR Gamma ?

Le but est de faire osciller la distribution de probabilité entre -1 et 1, avec 0 comme point médian. Pour y parvenir, une technique issue du Machine Learning appelée fonction d'activation est utilisée pour transformer les données. L'une de ces fonctions est la fonction tangente hyperbolique, qui est souvent utilisée dans les réseaux de neurones car elle conserve des valeurs comprises entre -1 et 1. En prenant la première dérivée des données d'entrée et en la normalisant à l'aide de la moyenne quadratique, la fonction tanh redistribue efficacement l'entrée signal dans la plage souhaitée de -1 à 1.

UR Gamma est un outil puissant pour les traders et les investisseurs, leur fournissant un aperçu plus complet, fiable et exploitable des tendances du marché et des mouvements de prix. L'algorithme est également adaptable pour une utilisation sur plusieurs périodes et marchés, ce qui en fait une solution polyvalente et flexible pour tous les besoins d'analyse financière. Avec son approche unique et ses fonctionnalités avancées, UR Gamma est un outil indispensable pour tout trader professionnel ou sérieux cherchant à se démarquer sur les marchés financiers.

Comment utiliser UR Gamma ?

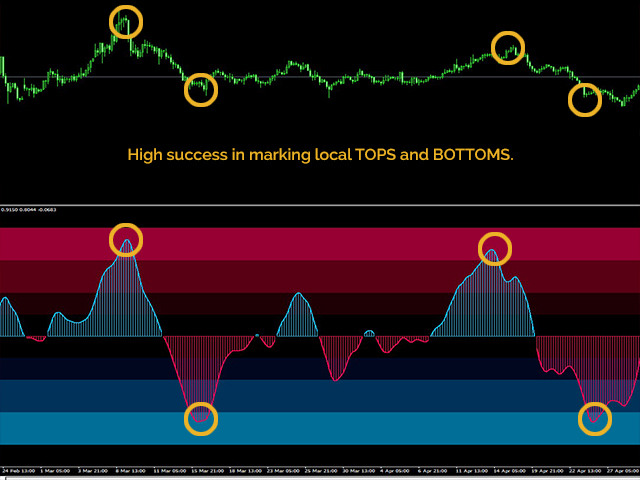
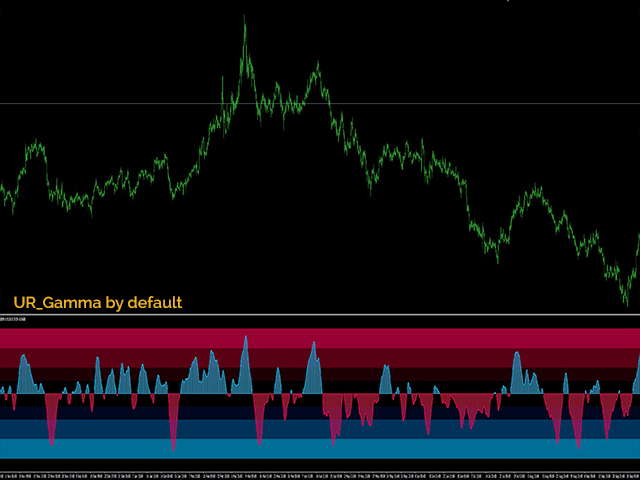
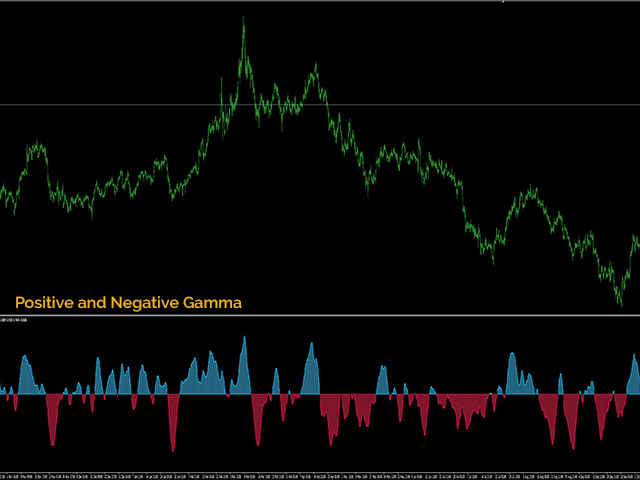
UR Gamma est un oscillateur à une ligne conçu pour aider les traders à identifier et à mesurer les tendances de l'évolution des prix. L'oscillateur est facile à utiliser et fournit une représentation visuelle claire des tendances du marché, les niveaux de fond indiquant les points d'épuisement possibles du prix. Pour utiliser UR Gamma, ajoutez simplement l'indicateur à votre graphique et observez les oscillations de la ligne. L'oscillateur oscillera entre -1 et 1, avec 0 comme médiane. Lorsque la ligne est au-dessus de 0, cela indique que le marché est dans une tendance haussière, et lorsqu'elle est en dessous de 0, cela indique une tendance à la baisse. Les niveaux de fond fournissent une indication claire des points d'épuisement possibles du prix, afin que les commerçants puissent agir en conséquence. Pour améliorer encore l'analyse, les utilisateurs peuvent ajuster les paramètres en fonction de leurs préférences et de leurs exigences.
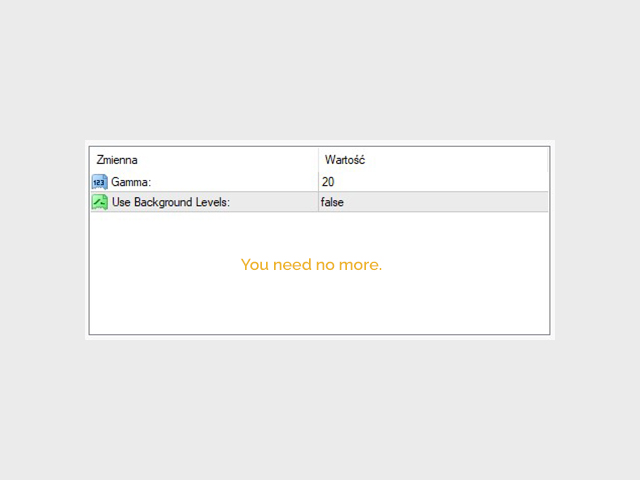

PARAMÈTRES
Gamma : Fondamentalement, une valeur "lookback" qui influence la longueur des vagues - ajustez-la en fonction de la période que vous utilisez.
Utiliser les niveaux d'arrière-plan : visualisation de l'épuisement derrière le tampon
AFFICHER

Ligne Gamma : montre l'épuisement du prix et éventuellement les niveaux de redistribution marquant les hauts et les bas.
Niveaux d'arrière-plan : affichez différents niveaux d'épuisement ajustés à la configuration par défaut.
Produits recommandés
Blahtech Market Profile
Blahtech Limited
4.61 (18)
Was: $249  Now: $99   Market Profile defines a number of day types that can help the trader to determine market behaviour. A key feature is the Value Area, representing the range of price action where 70% of trading took place. Understanding the Value Area can give traders valuable insight into market direction and establish the higher odds trade. It is an excellent addition to any system you may be using. Blahtech Limited presents their Market Profile indicator for the MetaTrader community. Ins
BoxChart MT4
Evgeny Shevtsov
4.57 (7)
The market is unfair if only because 10% of participants manage 90% of funds. An ordinary trader has slim changes to stand against these "vultures". This problem can be solved. You just need to be among these 10%, learn to predict their intentions and move with them. Volume is the only preemptive factor that faultlessly works on any timeframe and symbol. First, the volume appears and is accumulated, and only then the price moves. The price moves from one volume to another. Areas of volume accumu
Daily Candle Predictor est un indicateur qui prédit le cours de clôture d'une bougie. L'indicateur est principalement destiné à être utilisé sur les graphiques D1. Cet indicateur convient à la fois au trading forex traditionnel et au trading d'options binaires. L'indicateur peut être utilisé comme un système de trading autonome, ou il peut servir de complément à votre système de trading existant. Cet indicateur analyse la bougie actuelle, calcule certains facteurs de force à l'intérieur du corps
Infinity Trend Pro
Yaroslav Varankin
1 (1)
This is a trend indicator without redrawing Developed instead of the binary options strategy (by the color of the Martingale candlestick) Also works well in forex trading When to open trades (binary options) A signal will appear in the place with a candle signaling the current candle It is recommended to open a deal for one candle of the current timeframe M1 and M5 When a blue dot appears, open a deal up When a red dot appears, open a trade down. How to open trades on Forex. When a signal is rec
L'indicateur construit les cotations actuelles, qui peuvent être comparées aux cotations historiques et, sur cette base, faire une prévision de l'évolution des prix. L'indicateur dispose d'un champ de texte pour une navigation rapide jusqu'à la date souhaitée. Option : Symbole - sélection du symbole que l'indicateur affichera ; SymbolPeriod - sélection de la période à partir de laquelle l'indicateur prendra des données ; IndicatorColor - couleur de l'indicateur ; HorisontalShift -
Owl smart levels
Sergey Ermolov
4.63 (54)
Version MT5  |  FAQ L' indicateur Owl Smart Levels   est un système de trading complet au sein d'un seul indicateur qui comprend des outils d'analyse de marché populaires tels que   les fractales avancées de Bill Williams , Valable ZigZag qui construit   la structure d'onde correcte   du marché et   les niveaux de Fibonacci   qui marquent les niveaux exacts d'entrée. sur le marché et les endroits où prendre des bénéfices. Description détaillée de la stratégie Mode d'emploi de l'indicateur Conse
Un indicateur technique qui calcule ses lectures sur les volumes de transactions. Sous forme d'histogramme, il montre l'accumulation de la force de mouvement de l'instrument de trading. Il dispose de systèmes de calcul indépendants pour les directions haussières et baissières. Fonctionne sur tous les instruments de trading et délais. Peut compléter n’importe quel système commercial. L'indicateur ne redessine pas ses valeurs, les signaux apparaissent sur la bougie actuelle. Il est facile à util
Noize Absorption Index MT4
Ekaterina Saltykova
5 (1)
Noize Absorption Index - is the manual trading system that measures the difference of pressure between bears forces and bulls forces. Green line - is a noize free index that showing curent situation. Zero value of index shows totally choppy/flat market.Values above zero level shows how powerfull bullish wave is and values below zero measures bearish forces.Up arrow appears on bearish market when it's ready to reverse, dn arrow appears on weak bullish market, as a result of reverse expectation. S
Gold Phoenix
Yaroslav Varankin
The perfect tool for Scalng in the Forex markets You can trade both from signal to signal and using take profit  The algorithm does not use Zigzag!  No redrawing!  This is a channel instrument that uses a moving average as a filter. Moving Average  There are 2 parameters for the settings Ma Period = 5 period Moving Average  Channel 1.0 distance of channel lines from the chart Price Signal Filter - calculation of signal opening and filter There is a complete set of Alert There is a multi-timefram
Master Scalping M1 est un indicateur innovant qui utilise un algorithme pour déterminer rapidement et avec précision la tendance. L'indicateur calcule le temps d'ouverture et de fermeture des positions, les algorithmes de l'indicateur vous permettent de trouver les moments idéaux pour entrer dans une transaction (acheter ou vendre un actif), ce qui augmente le succès des transactions pour la plupart des commerçants. Avantages de l'indicateur : Facile à utiliser, ne surcharge pas le graphique ave
Blahtech Supply Demand
Blahtech Limited
4.63 (35)
Was: $299  Now: $99   Supply Demand uses previous price action to identify potential imbalances between buyers and sellers. The key is to identify the better odds zones, not just the untouched ones. Blahtech Supply Demand indicator delivers functionality previously unavailable on any trading platform. This 4-in-1 indicator not only highlights the higher probability zones using a multi-criteria strength engine, but also combines it with multi-timeframe trend analysis, previously confirmed swings
Volume by Price MT4
Brian Collard
4.71 (14)
The Volume by Price Indicator for MetaTrader 4 features Volume Profile and Market Profile TPO (Time Price Opportunity). Volume and TPO histogram bar and line charts. Volume Footprint charts. TPO letter and block marker collapsed and split structure charts. Session filtering and grouping. Static, dynamic and flexible range segmentation and compositing methods with relative and absolute visualizations. Graphical layering, positioning and styling options to suit the user's analytic and aesthetic n
TWO PAIRS SQUARE HEDGE METER INDICATOR Try this brilliant 2 pairs square indicator It draws a square wave of the relation between your two inputs symbols when square wave indicates -1 then it is very great opportunity to SELL pair1 and BUY Pair2 when square wave indicates +1 then it is very great opportunity to BUY pair1 and SELL Pair2 the inputs are : 2 pairs of symbols         then index value : i use 20 for M30 charts ( you can try other values : 40/50 for M15 , : 30 for M30 , : 10 for H1 ,
The Chaikin Oscillator is a technical indicator developed by Marc Chaikin that combines price and volume data to measure the accumulation and distribution of a financial instrument. It aims to identify potential buying and selling opportunities in the market. The Chaikin Oscillator is calculated by subtracting a 10-day exponential moving average of the Accumulation Distribution Line (ADL) from a 3-day exponential moving average of the ADL. Here's how to use the Chaikin Oscillator indicator in tr
Trade with Gann on your side!! MASTER CIRCLE 360 CIRCLE CHART, originally created by Gann admitted that this is “The Mother of all charts”. It is one of the last studies that this great trader left for us. The numeric tab le is apparently quite simple like all the tables and is based on square numbers, the SQUARE OF 12 and is by evolution, one of the most important square numbers. Here we can find CYCLE, PRICE AND TIME thanks to angles and grades, to show past and future support and resistance.
The indicator allows you to trade binary options. The recommended time frame is М1 and the expiration time is 1,2,3 minutes. The indicator suitable for auto and manual trading. A possible signal is specified as a arrows above/under a candle. You should wait until the candle closes! Arrows are not re-painted Trade sessions: TOKYO section (Half-end) Currency pairs: USD/JPY Working time frame: M1 Expiration time: 1,2,3 minutes. The indicator also shows good results when using the martingale strateg
FREE
Cosmic Diviner X Planet
Olena Kondratenko
4 (2)
This unique multi-currency strategy simultaneously determines the strength of trends and market entry points, visualizing this using histograms on the chart. The indicator is optimally adapted for trading on the timeframes М5, М15, М30, Н1. For the convenience of users, the indicator renders the entry point (in the form of an arrow), recommended take profit levels (TP1, TP2 with text labels) and the recommended Stop Loss level. The take profit levels (TP1, TP2) are automatically calculated for
VolumeProfile
Robert Hess
3.8 (5)
Descption: The Volume Profile displays detailed informations of historical trading activities at certain price levels (Market Profile). So you can locate the areas with the best prices in the market and get an advantage about other market participants. Features: Customizable Volume Profile / Market Profile Shows the "fair" Value Area with 70% of all Volume Shows critical low volume zones Shows VPOC, VAL and VAH Points Works on all timeframes Also available for MT5 ( https://www.mql5.com/en/m
VR Calculate Martingale
Vladimir Pastushak
5 (5)
The VR Calculate Martingale indicator is a powerful order and position calculator for calculating profit or loss. With the help of the order and position calculator, a trader can calculate the average price of any forex currency, stocks or crypto currency. Now you can connect the indicator and start superimposing virtual orders on your real orders and positions. By creating additional virtual positions, you can calculate any development of the situation. The indicator has a built-in lot calculat
COG LR Osc AM
Andriy Matviyevs'kyy
The presented indicator allows you to determine potential entry points into the market and set protective orders at reasonable levels. This product can be useful for both beginners and experienced traders. The indicator is based on calculation methods proven by time and practicing traders. The indicator is calculated in two stages: At the first stage, linear regression (LR) of the selected price type is determined for a given number of chart periods. At the second stage, the obtained data is p
The Th3Eng PipFinite indicator is based on a very excellent analysis of the right trend direction with perfect custom algorithms. It show the true direction and the best point to start trading. With StopLoss point and Three Take Profit points. Also it show the right pivot of the price and small points to order to replace the dynamic support and resistance channel, Which surrounds the price. And Finally it draws a very helpful Box on the left side on the chart includes (take profits and Stop loss
Trendiness Index
Libertas LLC
5 (3)
"The trend is your friend" is one of the best known sayings in investing, because capturing large trendy price movements can be extremely profitable. However, trading with the trend is often easier said than done, because many indicators are based on price reversals not trends. These aren't very effective at identifying trendy periods, or predicting whether trends will continue. We developed the Trendiness Index to help address this problem by indicating the strength and direction of price trend
For sure, this indicator has become very popular amongst traders. Through coding this indicator will give you the most accurate levels possible for your trading analysis. We have also added in the ability for you to receive alerts when the price breaks above or below a Support or Resistance lines! HOW TO USE The red rectangles represent your resistance/supply zone. The green rectangles represent your support/demand zone.  BONUS FEATURES We coded this indicator with the ability to switch between
The indicator analyzes the change in the minimum and maximum prices of the previous bars fixing the entrance of the big players. If the change (delta) increases, a signal is displayed on the graph in the form of an arrow. At the same time, virtual trade on history is carried out. In case of a repeat of the signal, the positions are increased (refilling). Thus the lot of positions can differ. The results of virtual trading in the form of losses / losses, profitability, drawdown and transaction li
The Market Profile Indicator for MT4 displays the price levels and zones where increased trading activity happens. These zones with substantial forex trading activity provide the forex traders with the best entry levels, support, and resistance levels. Moreover, price levels indicate the best reversal zones. As a result, forex traders can identify BULLISH and BEARISH market trends and BUY and SELL entry points as well as the best reversal points. The indicator works well in all intraday timefram
The Best One Scalping Trade Panel functional manual trade panel with risk reward, auto SL by candle ( original solution), lot size calculation, one-click trading, scale in and out of trades (partial close),  Works with all symbols not just currency pairs, perfect works on DAX, NASDAQ, GOLD, ...... I earn every day during live stream on ZakopiecFX - join Me Risk by lot Risk by percent SL by points SL by Candle, Renko, RangeBar ( original solution) TP by point TP by Risk/Reward Auto Trailing b
This is the FXTraderariel-TakeProfit - Stop Loss Indicator . It provides you 3 potential Take Profits and 1 Stop Loss. These potential targets are computed based on several methods . The indicator can be used on every time frame, but we advise to use it on H1, H4 and D1. Especially if you are a novice trader. Pro Traders can also you use it for scalping in smaller time frames (M1, M5 and M15). This indicator is not a complete trading system. It doesn't provide you a Signal nor can predict the m
We present you the indicator "Candle closing counter", which will become your indispensable assistant in the world of trading. That’s why knowing when the candle will close can help: If you like to trade using candle patterns, you will know when the candle will be closed. This indicator will allow you to check if a known pattern has formed and if there is a possibility of trading. The indicator will help you to prepare for market opening and market closure. You can set a timer to create a p
Point61 Indicator
Evgeniy Machok
5 (1)
The Point61 indicator is the result of many years of monitoring of price behavior of currency pairs and metals. It is not a secret, that in times of uncertainty, traders are looking for possible levels of support and resistance - the point, where price should stop its movement. There are 2 possible scenarios at these points: 1. Reverse (correction) to the opposite direction; 2. Breakthrough to continue movement. Very often these points are used to set stop orders - TakeProfit or
This is a new strategy for SUPPLY DEMAND areas It is based on a calculation using the tick volume to detect the big price action in market for both bear /bull actions this smart volume action candles are used to determine the supply and demand areas prices in between main supply and demand lines indicate sideway market  up arrows will be shown when prices moves above the main supply and the secondary supply lines Down arrows will be shown when prices moves below the main demand and the secondary
Les acheteurs de ce produit ont également acheté
Atomic Analyst
Issam Kassas
5 (3)
Tout d'abord, il convient de souligner que cet indicateur de trading n'est ni repainting, ni redrawing et ne présente aucun délai, ce qui le rend idéal à la fois pour le trading manuel et automatisé. Manuel de l'utilisateur : réglages, entrées et stratégie. L'Analyste Atomique est un indicateur d'action sur les prix PA qui utilise la force et le momentum du prix pour trouver un meilleur avantage sur le marché. Équipé de filtres avancés qui aident à éliminer les bruits et les faux signaux, et à
TPSpro RFI Levels
Roman Podpora
4.85 (20)
Reversal First Impulse levels (RFI)    INSTRUCTIONS        RUS       -       ENG              R ecommended to use with an indicator   -   TREND PRO -  Version MT5 A key element in trading is zones or levels from which decisions to buy or sell a trading instrument are made. Despite attempts by major players to conceal their presence in the market, they inevitably leave traces. Our task was to learn how to identify these traces and interpret them correctly. Main functions: Displaying active zones
Scalper Inside PRO
Alexey Minkov
4.74 (58)
An exclusive indicator that utilizes an innovative algorithm to swiftly and accurately determine the market trend. The indicator automatically calculates opening, closing, and profit levels, providing detailed trading statistics. With these features, you can choose the most appropriate trading instrument for the current market conditions. Additionally, you can easily integrate your own arrow indicators into Scalper Inside Pro to quickly evaluate their statistics and profitability. Scalper Inside
Actuellement 20% de réduction ! La meilleure solution pour tout débutant ou trader expert ! Ce logiciel de tableau de bord fonctionne sur 28 paires de devises. Il est basé sur 2 de nos principaux indicateurs (Advanced Currency Strength 28 et Advanced Currency Impulse). Il donne un excellent aperçu de l'ensemble du marché Forex. Il montre les valeurs de l'Advanced Currency Strength, la vitesse de mouvement des devises et les signaux pour 28 paires de devises dans tous les (9) délais. Imagine
TPSproTREND PrO
Roman Podpora
4.78 (18)
TPSpro TRENDPRO  - is a trend indicator that automatically analyzes the market and provides information about the trend and each of its changes, as well as giving signals for entering trades without redrawing! The indicator uses each candle, analyzing them separately. referring to different impulses - up or down impulse. Exact entry points into transactions for currencies, crypto, metals, stocks, indices!  -  Version MT5               DETAILED DESCRIPTION                R ecommended to use with
Enigmera
Ivan Stefanov
5 (3)
ENIGMERA : Le cœur du marché https://www.enigmera.com Introduction Cet indicateur et ce système de trading constituent une approche remarquable des marchés financiers. ENIGMERA utilise les cycles fractals pour calculer avec précision les niveaux de support et de résistance. Il indique la phase d'accumulation authentique et donne une direction et des objectifs.  Un système qui fonctionne que nous soyons dans une tendance ou une correction.  Comment fonctionne-t-il ? ENIGMERA comprend trois l
Présentation       Quantum Trend Sniper Indicator   , l'indicateur révolutionnaire MQL5 qui transforme la façon dont vous identifiez et négociez les inversions de tendance ! Développé par une équipe de traders expérimentés avec une expérience commerciale de plus de 13 ans,       Indicateur Quantum Trend Sniper       est conçu pour propulser votre parcours de trading vers de nouveaux sommets grâce à sa manière innovante d'identifier les inversions de tendance avec une précision extrêmement élevée
FX Volume
Daniel Stein
4.6 (35)
Obtenez votre mise à jour quotidienne du marché avec des détails et des captures d'écran via notre Morning Briefing ici sur mql5 et sur Telegram ! FX Volume est le PREMIER et SEUL indicateur de volume qui fournit un VRAI aperçu du sentiment du marché du point de vue d'un courtier. Il fournit des informations impressionnantes sur la façon dont les acteurs institutionnels du marché, comme les courtiers, sont positionnés sur le marché des changes, bien plus rapidement que les rapports COT. Voir c
Quantum Breakout Indicator PRO
Bogdan Ion Puscasu
4.96 (26)
Présentation       Quantum Breakout PRO   , l'indicateur révolutionnaire MQL5 qui transforme la façon dont vous négociez les zones d'évasion ! Développé par une équipe de traders expérimentés avec une expérience de trading de plus de 13 ans,   Quantum Breakout PRO   est conçu pour propulser votre parcours de trading vers de nouveaux sommets grâce à sa stratégie de zone de discussion innovante et dynamique. Quantum Breakout Indicator vous donnera des flèches de signalisation sur les zones d
Indicator : RealValueIndicator Description : RealValueIndicator is a powerful tool designed specifically for trading on the EURUSD pair. This indicator analyzes all EUR and USD pairs, calculates their real currency strength values, and displays them as a single realistic value to give you a head start on price. This indicator will tell you moves before they happen if you use it right. RealValueIndicator allows you to get a quick and accurate overview of the EURUSD currency pair tops and bottoms,
Up down v6T
Guner Koca
5 (1)
Thise indicator is up down v6  comes with tradingwiev pinescript. purchased people, after installed on terminal ,contact me on mql5  to get BONUS  TradingView pinescript. up-down indicator is no repaint and works all pairs and lower than weekly time frames charts. it is suitable also 1 m charts for all pairs. and hold long way to signal. dont gives too many signals. when red histogram cross trigger line that is up signal.and price probably will down when blue histogram cross trigger line that
ECM Channel MT4
Paulo Rocha
5 (1)
ECM Elite Channel is a volatility-based indicator, developed with a specific time algorithm, which consists of finding possible corrections in the market. This indicator shows two outer lines, an inner line (retracement line) and an arrow sign, where the channel theory is to help identify overbought and oversold conditions in the market. The market price will generally fall between the boundaries of the channel. If prices touch or move outside the channel, it's a trading opportunity. The
Gold Channel is a volatility-based indicator, developed with a specific timing algorithm for the XAUUSD pair, which consists of finding possible corrections in the market. This indicator shows two outer lines, an inner line (retracement line) and an arrow sign, where the theory of the channel is to help identify overbought and oversold conditions in the market. The market price will generally fall between the boundaries of the channel. If prices touch or move outside the channel it is a tra
Gann Signal
Kirill Borovskii
Gann Signal is a very simple indicator at first glance, but hidden inside is many years of experience in studying W.D.Ganna methods. The indicator gives accurate BUY/SELL signals, without redrawing. The indicator is very easy to use. All you need to do is attach it to your chart and follow its recommendations. The indicator constantly analyzes the market for entry opportunities. When such an opportunity appears, the indicator gives a signal in the form of an arrow. I repeat, all signals are NOT
Please send me Direct message on MQL5 CHAT after purchasing the Indicator for Training and Installation Support There are some additional files that is important to use with the Indicator . So be sure to contact me after purchasing the Indicator So that I can add you for training and support . If you find any difficulty with installation then send me Direct message here So that I can connect with you via Anydesk or Teamview for the product installation. " Smart Order Block Indicator " to find
Introduction to X3 Chart Pattern Scanner X3 Cherart Pattern Scanner is the non-repainting and non-lagging indicator detecting X3 chart patterns including Harmonic pattern, Elliott Wave pattern, X3 patterns, and Japanese Candlestick patterns. Historical patterns match with signal patterns. Hence, you can readily develop the solid trading strategy in your chart. More importantly, this superb pattern scanner can detect the optimal pattern of its kind. In addition, you can switch on and off individu
Currency Strength Exotics
Bernhard Schweigert
4.88 (33)
ACTUELLEMENT 20% DE RÉDUCTION ! La meilleure solution pour tout débutant ou trader expert ! Cet indicateur est spécialisé pour montrer la force de la devise pour tous les symboles comme les paires exotiques, les matières premières, les indices ou les contrats à terme. C'est le premier de son genre, n'importe quel symbole peut être ajouté à la 9ème ligne pour montrer la force réelle de la devise de l'or, l'argent, le pétrole, DAX, US30, MXN, TRY, CNH etc. Il s'agit d'un outil de trading uniq
TrendMaestro
Stefano Frisetti
5 (3)
note: this indicator is for METATRADER4, if you want the version for METATRADER5 this is the link:  https://www.mql5.com/it/market/product/108106 TRENDMAESTRO ver 2.4 TRENDMAESTRO recognizes a new TREND in the bud, he never makes mistakes. The certainty of identifying a new TREND is priceless. DESCRIPTION TRENDMAESTRO identifies a new TREND in the bud, this indicator examines the volatility, volumes and momentum to identify the moment in which there is an explosion of one or more of these data a
norepaint buy sell indicator is norepaint indicator.and works all pairs and all timeframes. using is wery simple ,it puts arrow on price probably buy sell arrows. thise indicator is suitable for beginner and experienced traders. there is cnt numbers that show how many bars you see the signal back. increasing it possible but up to chart have the how many bars . minimum value of this 500.
SNR LEVEL INDICATOR Accurate Snr level indicator will only display Fresh Levels that are close to the Current Market Price. This indicator is very accurate in mapping Support & resistance levels. there is an alert feature when the price TOUCHES the SNR LEVEL, WHEN CLOSE CANDLE BREAK/REJECT SNR LEVEL. INDICATOR MARKING :: - SUPPORT LEVEL == V SHAPE - RESISTANCE LEVEL == APEX LEVEL - GAP RESISTANCE & GAP SUPPORT == OPEN CLOSE CANDLE - SUPPORT BECAME RESISTANCE & RESISTANCE BECAME SUPPORT INDIC
GOLD Impulse with Alert
Bernhard Schweigert
4.56 (9)
Cet indicateur est une super combinaison de nos 2 produits Advanced Currency IMPULSE with ALERT  +   Currency Strength Exotics . Il fonctionne pour tous les cadres temporels et montre graphiquement l'impulsion de force ou de faiblesse pour les 8 principales devises plus un symbole ! Cet indicateur est spécialisé pour montrer l'accélération de la force des devises pour tout symbole comme l'or, les paires exotiques, les matières premières, les indices ou les contrats à terme. C'est le premi
All in One Trade
Alexey Minkov
4.48 (27)
The All-in-One Trade Indicator (AOTI) determines daily targets for EURUSD, EURJPY, GBPUSD, USDCHF, EURGBP, EURCAD, EURAUD, AUDJPY, GBPAUD, GBPCAD, GBPCHF, GBPJPY, AUDUSD, and USDJPY. All other modules work with any trading instruments. The indicator includes various features, such as Double Channel trend direction, Price channel, MA Bands, Fibo levels, Climax Bar detection, and others. The AOTI indicator is based on several trading strategies, and created to simplify market analysis. All-in-One
"The Squeeze indicator attempts to identify periods of consolidation in a market. In general the market is either in a period of quiet consolidation or vertical price discovery. By identifying these calm periods, we have a better opportunity of getting into trades with the potential for larger moves. Once a market enters into a "squeeze," we watch the overall market momentum to help forecast the market direction and await a release of market energy." Modified TTM Squeeze Indicator is a modifica
Entry Points Pro
Yury Orlov
4.7 (225)
Indicateur supérieur pour MT4 fournissant des signaux précis pour entrer dans un trade sans repeindre ! Il peut être appliqué à tous les actifs financiers : forex, cryptocurrencies, métaux, actions, indices.  La version MT5 est ici Il fournira des signaux de trading assez précis et vous dira quand il est préférable d'ouvrir un trade et de le fermer. Regardez la vidéo (6:22) avec un exemple de traitement d'un seul signal qui a rapporté à l'indicateur ! La plupart des traders améliorent l
Présentation de l'indicateur astronomique pour MT4 : Votre compagnon de trading céleste ultime Êtes-vous prêt à élever votre expérience de trading à des hauteurs célestes ? Ne cherchez pas plus loin que notre indicateur astronomique révolutionnaire pour MT4. Cet outil innovant transcende les indicateurs de trading traditionnels en exploitant des algorithmes complexes pour vous fournir des aperçus astronomiques inégalés et des calculs de précision. Un univers d'informations à portée de main : Con
Ace Supply Demand Zone Indicator The concept of supply demand relies on the quantity mismatching between buying and selling volumes in the financial market. Supply and demand zone can provide the good entry and exit. A zone is easier to trade than a line. The supply demand zone can provide the detailed trading plan and the risk management. Its ability to predict market direction is high. There are two distinctive points about Ace Supply Demand Zone Indicator. Ace Supply Demand Zone indicator was
Beast Super Signal
Dustin Vlok
4.76 (101)
Vous recherchez un puissant indicateur de trading forex qui peut vous aider à identifier facilement des opportunités de trading rentables ? Ne cherchez pas plus loin que le Beast Super Signal. Cet indicateur basé sur les tendances facile à utiliser surveille en permanence les conditions du marché, en recherchant de nouvelles tendances en développement ou en sautant sur celles existantes. Le Beast Super Signal donne un signal d'achat ou de vente lorsque toutes les stratégies internes s'alignent e
Tradeable Changer Indie
Opengates Success International
Tradeable Changer Indie Trade-able Changer Indie is an indicator that serves several purposes. The idea behind this operating indicator is to have a minimal set of indicator or experts on the chart in order to avoid clumsy chart window and at the same time have a great time trading profitably. This is a combination of Symbol/Time-frame Changer and a Trading system based on Trends following. It has a small board to display trade signals for the trader. Due to the nature of these com
Volatility Trend System - un système de trading qui donne des signaux pour les entrées. Le système de volatilité donne des signaux linéaires et ponctuels dans le sens de la tendance, ainsi que des signaux pour en sortir, sans redessiner ni retarder. L'indicateur de tendance surveille la direction de la tendance à moyen terme, montre la direction et son changement. L'indicateur de signal est basé sur les changements de volatilité et montre les entrées sur le marché. L'indicateur est équipé de
NAM Order Blocks
NAM TECH GROUP, CORP.
5 (1)
MT4 Multi-timeframe Order Blocks detection indicator. Features - Fully customizable on chart control panel, provides complete interaction. - Hide and show control panel wherever you want. - Detect OBs on multiple timeframes. - Select OBs quantity to display. - Different OBs user interface. - Different filters on OBs. - OB proximity alert. - ADR High and Low lines. - Notification service (Screen alerts | Push notifications). Summary Order block is a market behavior that indicates order collection
Plus de l'auteur
UR Basket MT5
Krzysztof Jan Debski
Panier UR   Le mieux que vous puissiez faire est de protéger vos commandes contre les pertes. Vous pouvez maintenant vous détendre et laisser UR Basket s'en occuper. Avantages d'utiliser UR Basket : Tous les paramètres sont dynamiquement modifiables dans le panneau graphique de votre graphique - Vous n'avez PAS besoin de redémarrer l'EA pour modifier les paramètres ou rappeler les paramètres que vous avez utilisés ! Vous pouvez suivre vos commandes via :   - Nombre magique   - Commentaire
UR TradeManager MT5
Krzysztof Jan Debski
UR_TradeManager pour MetaTrader 5 Maximisez votre potentiel de trading avec UR_TradeManager, l'outil ultime d'amélioration du trading conçu spécifiquement pour la plateforme MetaTrader 4. Conçu avec précision et fonctionnalité à l'esprit, cet outil complet est essentiel pour les traders qui cherchent à élever leurs compétences d'analyse de marché, d'exécution et de gestion. Caractéristiques Clés : Tableau de Bord de Trading Visuel   : Gérez vos trades directement depuis un tableau de bord sophis
UR Control Panel
Krzysztof Jan Debski
5 (2)
Panneau de configuration UR   UR Control Panel est un outil que je veux partager avec vous GRATUITEMENT. C'est un panel interactif qui m'a aidé dans mon trading et a boosté mon analyse du marché chaque jour. J'espère que cela répondra également à vos besoins ! Comment utiliser le panneau de contrôle UR ? Il s'agit d'un double panneau mobile et redimensionnable dont : - L'un d'eux montre la force de la devise sur la période donnée - L'autre permet aux options de se déplacer entre les symbo
FREE
UR Basket
Krzysztof Jan Debski
Panier UR   Le mieux que vous puissiez faire est de protéger vos commandes contre les pertes. Vous pouvez maintenant vous détendre et laisser UR Basket s'en occuper. Avantages d'utiliser UR Basket : Tous les paramètres sont dynamiquement modifiables dans le panneau graphique de votre graphique - Vous n'avez PAS besoin de redémarrer l'EA pour modifier les paramètres ou rappeler les paramètres que vous avez utilisés ! Vous pouvez suivre vos commandes via :   - Nombre magique   - Commentaire
UR DivergenceSpotter
Krzysztof Jan Debski
UR DivergenceSpotter   UR DivergenceSpotter est le résultat de nombreuses années d'expérience et parfois les moyens les plus simples sont les meilleurs. Il y a une bonne corrélation entre quelques indicateurs, mais quand ils ne correspondent pas - le prix essaie de "se réajuster" - et c'est à ce moment-là que nous recevons un signal avec UR DivergenceSpotter. Avantages d'utiliser UR Divergence Spotter : Aucun paramètre Ne se repeint pas après la création de la bougie Signale lorsque le si
UR VolumeTrend
Krzysztof Jan Debski
Tendance volume UR   UR VolumeTrend est l'indicateur de volume le plus clair montrant la tendance en cours en termes de volume. Fonctionne parfaitement avec d'autres indicateurs, tout comme UR TrendExhaustion pour signaler les hauts et les bas locaux. Limité à seulement 2 paramètres - plus les valeurs sont élevées, plus les tendances seront longues. Les extrêmes de gradient montrent des épuisements possibles du volume pour attraper un renversement potentiel. Deux lignes - La tendance du vol
UR TrendExhaustion
Krzysztof Jan Debski
UR TrendÉpuisement   UR TrendExhaustion est la meilleure solution pour les traders qui ne veulent pas gérer les valeurs des paramètres ni d'autres configurations - c'est à la fois facile et visuellement compréhensible pour tout le monde. Avantages d'utiliser UR TrendExhaustion : Aucun paramètre Vous avez 3 lignes qui décrivent le mieux ce qui se passe sur le graphique : la ligne d'épuisement de la tendance, la ligne de l'argent de la baleine et la ligne de l'argent au détail. L'interface
UR HighsAndLows
Krzysztof Jan Debski
Hauts et bas de l'UR   UR Highs&Lows effectue une analyse approfondie du mouvement des prix et de sa volatilité, et crée un canal dans lequel le prix évolue. Ce canal se déplace maintenant comme un oscillateur et est superposé à la déviation du prix pour signaler les épuisements potentiels et les inversions possibles. Avantages d'utiliser UR Highs&Lows : Aucun paramètre Vous avez 3 lignes qui décrivent le mouvement des prix - White Line qui est une moyenne du prix et Blue Lines qui sont s
UR Momenter
Krzysztof Jan Debski
UR Momentateur   UR Momenter calcule parfaitement la dynamique du prix en corrélation avec l'épuisement du mouvement de prix représenté sous forme d'oscillateur. Par conséquent, cela nous donne des signaux très précoces d'inversions ou de retracements potentiels. Cette formule a été découverte en 2018 après l'éclatement de la bulle du marché. Avantages d'utiliser UR Momenter : Aucun paramètre Vous avez 2 lignes qui décrivent le mouvement des prix - White Line qui est l'élan du prix en cor
UR FrontEndBackEnd
Krzysztof Jan Debski
UR FrontEndBackEnd   UR FrontEndBackEnd est ma formule préférée pour trouver les niveaux de support et de résistance les plus précis. Je les ai également divisés en différentes catégories (lignes pointillées, lignes pleines et zones) pour marquer leur force. Tout est stocké dans des tampons afin qu'ils soient faciles d'accès et implémentés dans d'autres outils. Ajout : L'outil peut devoir être ajusté à l'actif sur lequel il est appliqué - les actifs diffèrent en termes de nombre de chiffres
UR Bands
Krzysztof Jan Debski
Bandes UR (avec une formule utilisée dans les systèmes d'apprentissage automatique) UR Bands est un indicateur dérivé d'une formule qui intègre la volatilité du marché est similaire en principe à ceux utilisés dans les systèmes d'apprentissage automatique. Cette représentation mathématique des conditions de marché offre une analyse précise des tendances et de la dynamique des prix, en tenant compte de la volatilité inhérente aux marchés financiers. En incorporant la volatilité comme variable,
UR Vortex
Krzysztof Jan Debski
UR Vortex The Probabilistic UR Vortex Formula: An Accurate System for Predictive Market Analysis using Volatility and Standard Deviation Calculations. The   UR Vortex   indicator is a technical analysis tool that uses volatility and standard deviation calculations to predict potential tops and bottoms in a market. It measures the strength of a trend by calculating the distance between the current price and a moving average, and then standardizing this distance by dividing it by the average true
UR PulseScalp
Krzysztof Jan Debski
UR PulseScalp  Un indicateur de trading calibré pour les scalpers à la recherche de l'avantage ultime sur des marchés en évolution rapide UR PulseScalp est une solution de trading de pointe pour les scalpers à la recherche de l'avantage ultime sur des marchés en évolution rapide. Cet indicateur innovant est construit sur une formule scientifiquement calibrée qui combine la puissance de la volatilité, du MoneyFlow et de la force relative pour créer un signal très précis et fiable. Avantages
UR TradeManager
Krzysztof Jan Debski
UR_TradeManager pour MetaTrader 4 Maximisez votre potentiel de trading avec UR_TradeManager, l'outil ultime d'amélioration du trading conçu spécifiquement pour la plateforme MetaTrader 4. Conçu avec précision et fonctionnalité à l'esprit, cet outil complet est essentiel pour les traders qui cherchent à élever leurs compétences d'analyse de marché, d'exécution et de gestion. Caractéristiques Clés : Tableau de Bord de Trading Visuel : Gérez vos trades directement depuis un tableau de bord sophisti
UR DivergenceSpotter   UR DivergenceSpotter est le résultat de nombreuses années d'expérience et parfois les moyens les plus simples sont les meilleurs. Il y a une bonne corrélation entre quelques indicateurs, mais quand ils ne correspondent pas - le prix essaie de "se réajuster" - et c'est à ce moment-là que nous recevons un signal avec UR DivergenceSpotter. Avantages d'utiliser UR Divergence Spotter : Aucun paramètre Ne se repeint pas après la création de la bougie Signale lorsque le si
UR VolumeTrend MT5
Krzysztof Jan Debski
Tendance volume UR   UR VolumeTrend est l'indicateur de volume le plus clair montrant la tendance en cours en termes de volume. Fonctionne parfaitement avec d'autres indicateurs, tout comme UR TrendExhaustion pour signaler les hauts et les bas locaux. Limité à seulement 2 paramètres - plus les valeurs sont élevées, plus les tendances seront longues. Les extrêmes de gradient montrent des épuisements possibles du volume pour attraper un renversement potentiel. Deux lignes - La tendance du vol
UR TrendÉpuisement   UR TrendExhaustion est la meilleure solution pour les traders qui ne veulent pas gérer les valeurs des paramètres ni d'autres configurations - c'est à la fois facile et visuellement compréhensible pour tout le monde. Avantages d'utiliser UR TrendExhaustion : Aucun paramètre Vous avez 3 lignes qui décrivent le mieux ce qui se passe sur le graphique : la ligne d'épuisement de la tendance, la ligne de l'argent de la baleine et la ligne de l'argent au détail. L'interface
UR HighsAndLows MT5
Krzysztof Jan Debski
Hauts et bas de l'UR   UR Highs&Lows effectue une analyse approfondie du mouvement des prix et de sa volatilité, et crée un canal dans lequel le prix évolue. Ce canal se déplace maintenant comme un oscillateur et est superposé à la déviation du prix pour signaler les épuisements potentiels et les inversions possibles. Avantages d'utiliser UR Highs&Lows : Aucun paramètre Vous avez 3 lignes qui décrivent le mouvement des prix - White Line qui est une moyenne du prix et Blue Lines qui sont s
UR Momenter MT5
Krzysztof Jan Debski
UR Momentateur   UR Momenter calcule parfaitement la dynamique du prix en corrélation avec l'épuisement du mouvement de prix représenté sous forme d'oscillateur. Par conséquent, cela nous donne des signaux très précoces d'inversions ou de retracements potentiels. Cette formule a été découverte en 2018 après l'éclatement de la bulle du marché. Avantages d'utiliser UR Momenter : Aucun paramètre Vous avez 2 lignes qui décrivent le mouvement des prix - White Line qui est l'élan du prix en cor
UR FrontEndBackEnd   UR FrontEndBackEnd est ma formule préférée pour trouver les niveaux de support et de résistance les plus précis. Je les ai également divisés en différentes catégories (lignes pointillées, lignes pleines et zones) pour marquer leur force. Tout est stocké dans des tampons afin qu'ils soient faciles d'accès et implémentés dans d'autres outils. Ajout : L'outil peut devoir être ajusté à l'actif sur lequel il est appliqué - les actifs diffèrent en termes de nombre de chiffres
UR Gamma MT5
Krzysztof Jan Debski
UR Gamma (alimenté par des calculs similaires trouvés dans les systèmes d'apprentissage automatique) UR Gamma est un outil d'analyse financière de pointe qui offre une version nouvelle et améliorée de l'indicateur classique WaveTrend. En incorporant des techniques avancées de traitement du signal numérique, UR Gamma répond à certaines des limites des algorithmes WaveTrend traditionnels et fournit une approche plus précise, robuste et dynamique pour identifier et mesurer les tendances de l'act
UR Bands MT5
Krzysztof Jan Debski
Bandes UR (avec une formule utilisée dans les systèmes d'apprentissage automatique) UR Bands est un indicateur dérivé d'une formule qui intègre la volatilité du marché est similaire en principe à ceux utilisés dans les systèmes d'apprentissage automatique. Cette représentation mathématique des conditions de marché offre une analyse précise des tendances et de la dynamique des prix, en tenant compte de la volatilité inhérente aux marchés financiers. En incorporant la volatilité comme variable,
UR Vortex MT5
Krzysztof Jan Debski
UR Vortex MT5 The Probabilistic UR Vortex Formula: An Accurate System for Predictive Market Analysis using Volatility and Standard Deviation Calculations. The UR Vortex MT5 indicator is a technical analysis tool that uses volatility and standard deviation calculations to predict potential tops and bottoms in a market. It measures the strength of a trend by calculating the distance between the current price and a moving average, and then standardizing this distance by dividing it by the average
UR PulseScalp MT5
Krzysztof Jan Debski
UR PulseScalp MT5 Un indicateur de trading calibré pour les scalpers à la recherche de l'avantage ultime sur des marchés en évolution rapide UR PulseScalp MT5 est une solution de trading de pointe pour les scalpers à la recherche de l'avantage ultime sur des marchés en évolution rapide. Cet indicateur innovant est construit sur une formule scientifiquement calibrée qui combine la puissance de la volatilité, du MoneyFlow et de la force relative pour créer un signal très précis et fiable. Ava
Filtrer:
Aucun avis
Répondre à l'avis
Version 1.15 2024.05.15
Icon update
Version 1.10 2024.05.15
Strategy Tester : Adapted the calculations so they could be backtested in the strategy tester.