High Time Frame Relative Strength Index
- Indicateurs
- Safwan Rushdi Khalil Arekat
- Version: 1.0
- Activations: 10
MUST READ CAUTION BEFORE PURCHASE
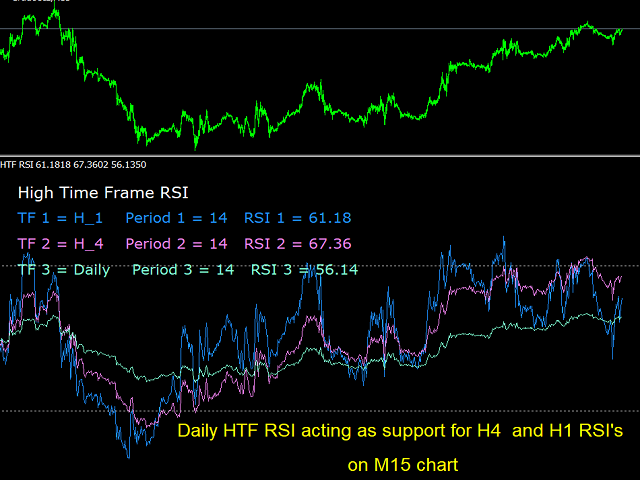
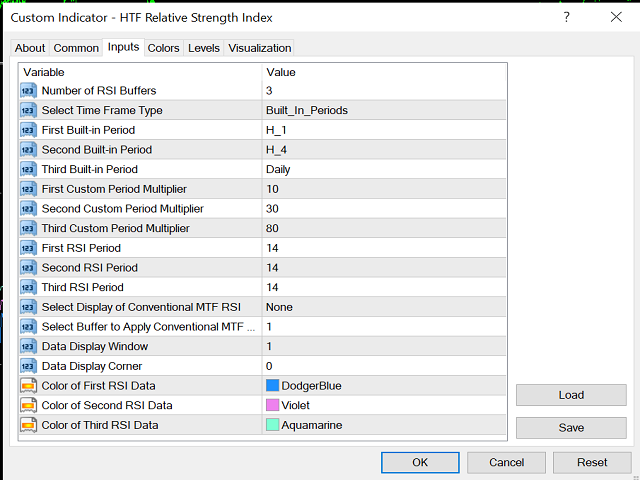
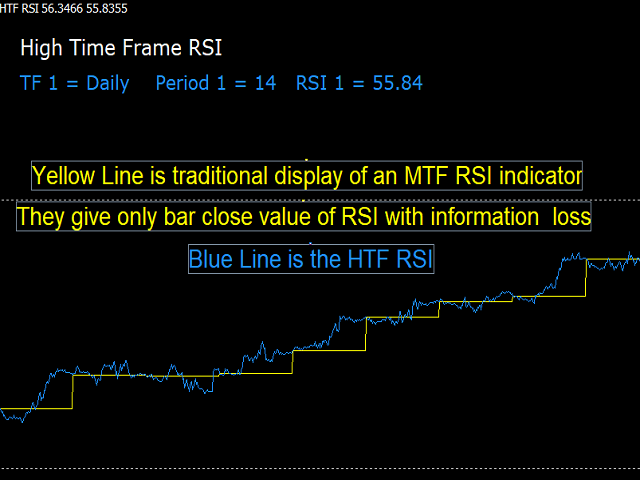
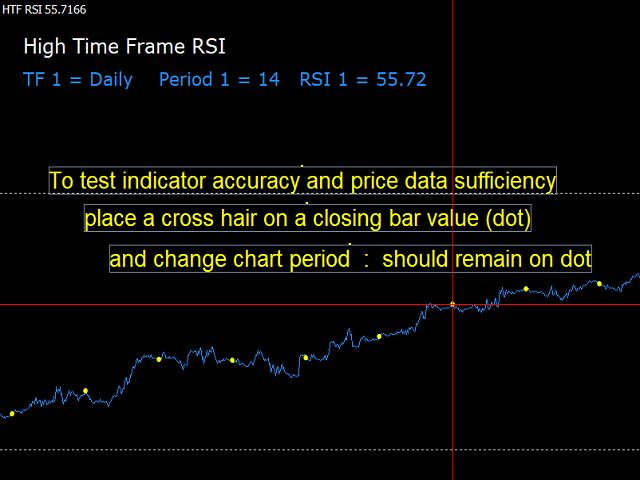
This one-of-a-kind indicator displays the instantaneous high resolution High Time Frame Relative Strength Index (HTF RSI), where up to three higher time-frame RSI's can be displayed simultaneously on the current chart. The indicator differs drastically from previous multi-time-frame RSI indicators in that it displays the high resolution bar-by-bar calculation of the HTF RSI - and not just the discrete values at the HTF bar closings. This allows for earlier observation of the onset of the classic oversold and overbought conditions. Importantly as well, the single-bar resolution enables following the HTF RSI trend much more accurately than the previous multi-time-frame RSI indicators, which displayed only stepped lines, thus suffering information loss. It is discovered that the HTF RSI's very often act as support and resistance to the lower time frame RSI's, offering strategic trade entry and exit points. The indicator allows setting the HTF periods as the built-in standard MT4 platform periods, or they can be custom-set by the user.
Follow the MQL5 site instructions for installation. Once the indicator is running, adjust the inputs to the desired settings. The higher time-frames must have periods larger than the current chart, otherwise an error message will be displayed. For the Demo version, try it out on the strategy tester on M15. It works on the other time frames as well.
CAUTION BEFORE PURCHASE: A note on historical price data: A requirement for optimising the functionality of the indicator is to have a large price history data for the chart and period used. This is because of the recursive nature for the RSI calculation, especially when high time-frame calculations are employed. Loading history data can be done in the history centre of the MT4 platform. If you want to use the indicator on all time frames, you must make sure you have enough historical data for the calculations and their convergence. Download historical data from multiple sources, for as far back as available. No refund will be given.
The indicator is causal. It does not repaint.
