• Aperçu
  • Avis
  • Commentaires

Dashboard 9TF Double CCI Double MA Angle Button

L'analyse de plusieurs périodes d'une paire de devises dans une seule fenêtre peut vous rendre confus.

Pour analyser plusieurs échelles de temps, vous avez besoin d'indicateurs fiables.

L'un d'eux utilise 9TF Double CCI Double MA.

J'ai travaillé jour et nuit pour créer un code simple mais fiable et couvrant les neuf périodes de temps dans un seul indicateur.

Regardons quelques-uns des avantages de cet indicateur :

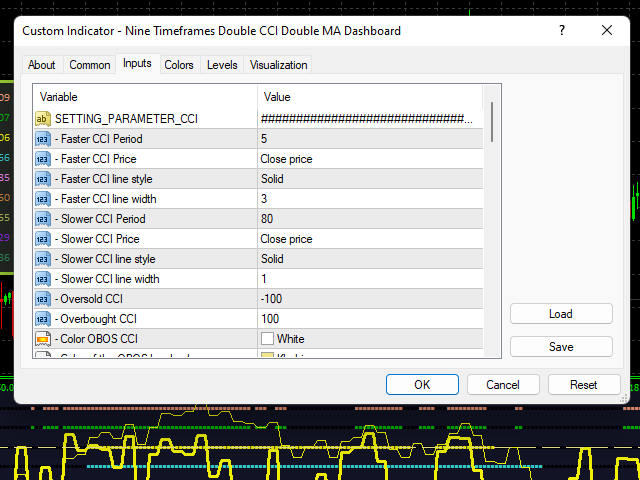
Double CCI, c'est-à-dire CCI plus rapide et CCI plus lent.
Double MA, c'est-à-dire MA plus rapide et MA plus lente.
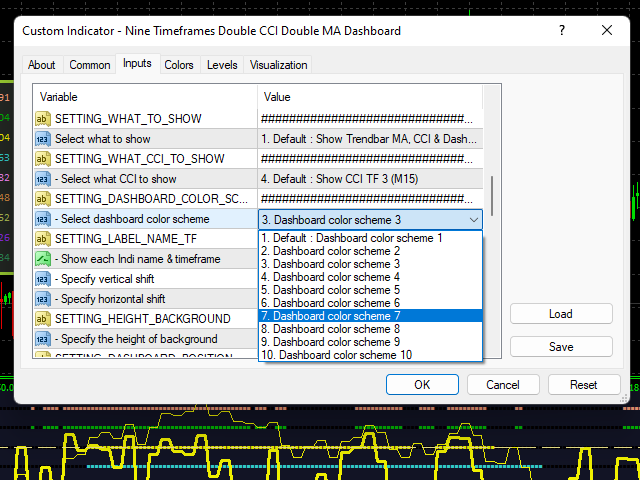
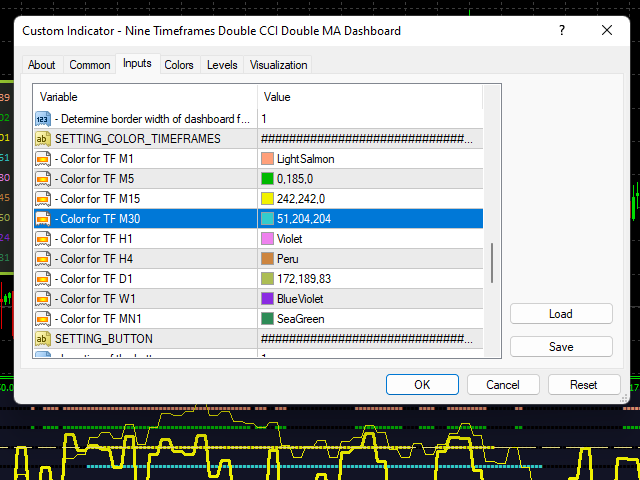
Schéma de 10 couleurs.
La couleur de la courbe dans chaque période est différente l'une de l'autre.
Ligne de niveau OBOS de la CCI.
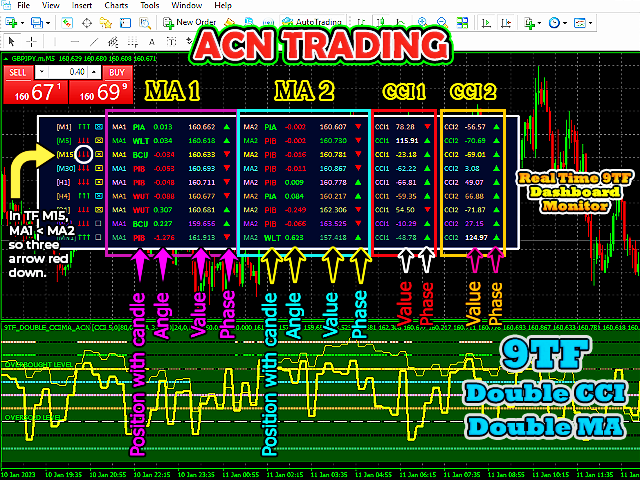
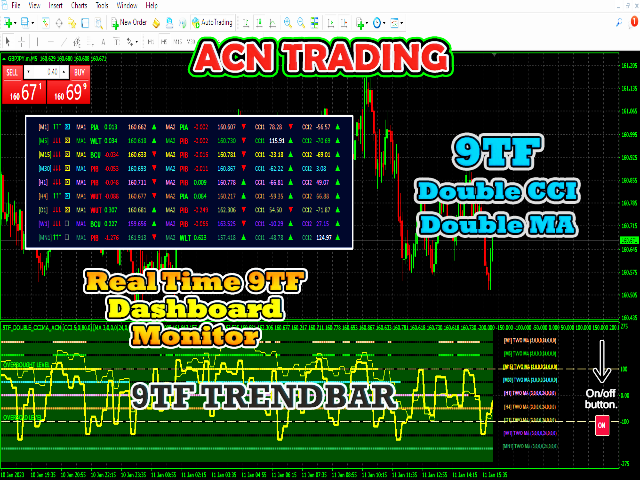
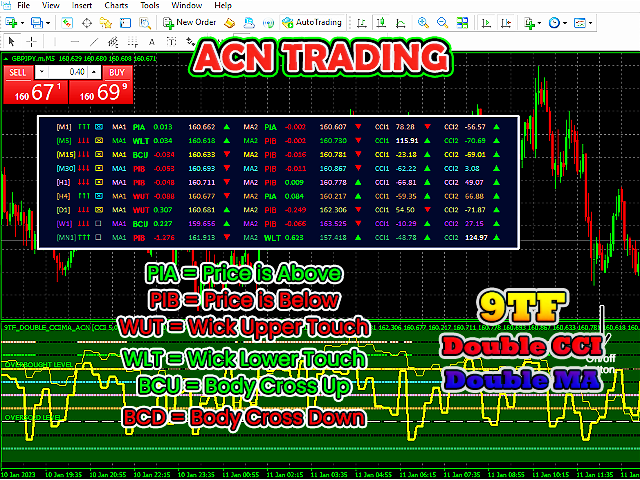
Moniteur de tableau de bord 9TF en temps réel.
Les calculs du moniteur de tableau de bord 9TF sont très précis même si vous changez d'une période à l'autre.
Surveiller quelle courbe CCI est au-dessus du niveau de surachat et laquelle est en dessous du niveau de survente.
Surveiller la courbe si la ligne rapide MA est au-dessus de la ligne lente MA ou vice versa.
Surveiller la courbe s'il y a un croisement entre la ligne rapide MA et la ligne lente MA.
Surveillance du mouvement du signal actuel avec le signal précédent. A la hausse ou à la baisse. (Remarque : il s'agit d'une fonctionnalité très importante pour le scalping !)
Une fonction de barre de tendance très importante pour repérer la tendance à plus long terme.
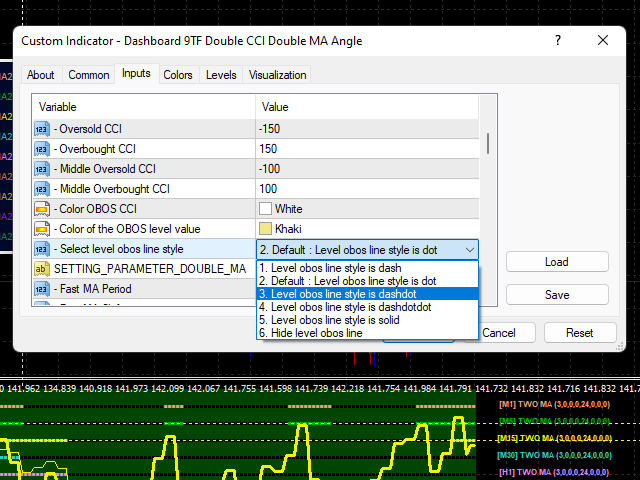
Possibilité de changer la couleur.
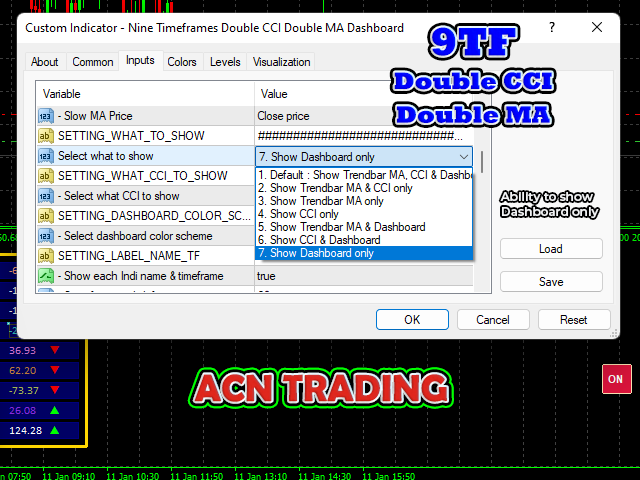
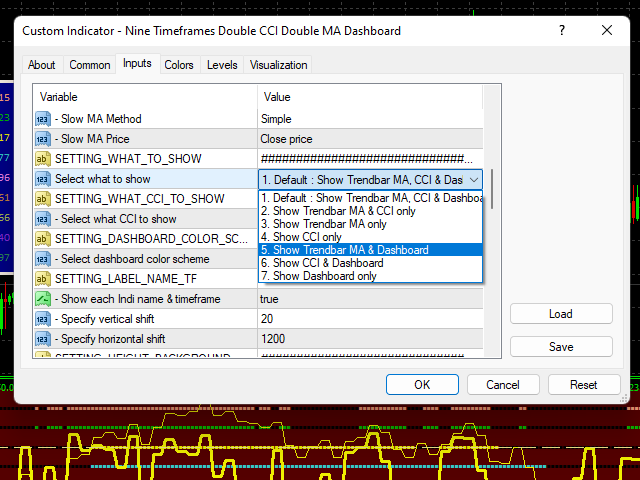
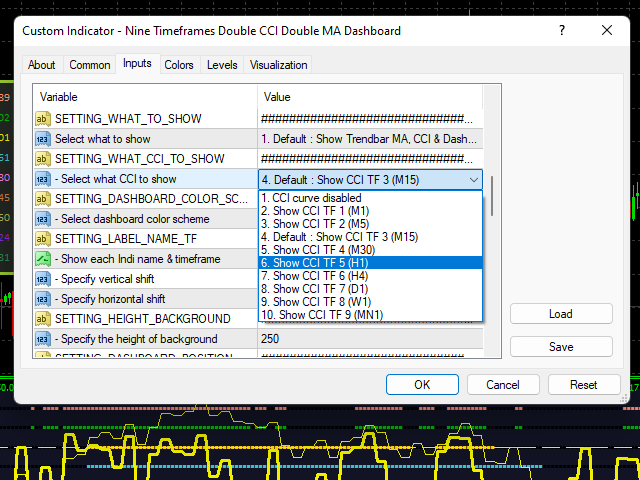
Possibilité de choisir la courbe à afficher.
Possibilité d'afficher CCI uniquement, MA uniquement, Tableau de bord uniquement, etc.
Possibilité de placer le moniteur de tableau de bord 9TF à l'emplacement souhaité.
Possibilité d'afficher ou de masquer l'indicateur en un seul clic.
Capacité à surveiller le mouvement de l'action des prix de la période la plus élevée à la petite période.
Peut être utilisé pour analyser le forex, les indices, le métal/l'énergie, les actions et la crypto-monnaie.
Q1. Comment savoir si la ligne CCI actuelle est supérieure à la ligne CCI précédente et inversement ?

A1. Jetez un œil à la phase CCI (exprimée sous la forme d'un triangle). Si la ligne CCI actuelle > la ligne CCI précédente, alors la phase se présente sous la forme d'un triangle vers le haut et est de couleur citron vert. L'opposé est un triangle vers le bas et est rouge.


Q2. Comment savoir si la ligne MA actuelle est supérieure à la ligne MA précédente et vice versa ?

A2. Jetez un oeil à la phase MA (exprimée sous la forme d'un triangle). Si la ligne MA actuelle > la ligne MA précédente, alors la phase se présente sous la forme d'un triangle orienté vers le haut et est de couleur citron vert. L'opposé est un triangle vers le bas et est rouge.


Q3. Comment savoir si la ligne MA plus rapide actuelle est supérieure à la ligne MA plus lente actuelle et vice versa ?

A3. Regardez les trois flèches. Si la ligne MA plus rapide actuelle > la ligne MA plus lente actuelle, alors les trois flèches sont tournées vers le haut et sont de couleur citron vert. L'opposé est tourné vers le bas et est rouge.


Vous pouvez regarder la fonctionnalité complète sur ma chaîne YouTube. Rien à cacher.

Mon intention de créer cet indicateur est d'augmenter vos gains et vos profits.

Faites des entrées en toute confiance avec le meilleur indicateur de trading Double CCI Double MA.

Obtenez maintenant et tradez comme un pro.

Merci.


Produits recommandés
VR Cub
Vladimir Pastushak
VR Cub est un indicateur permettant d'obtenir des points d'entrée de haute qualité. L'indicateur a été développé pour faciliter les calculs mathématiques et simplifier la recherche de points d'entrée dans un poste. La stratégie de trading pour laquelle l'indicateur a été rédigé prouve son efficacité depuis de nombreuses années. La simplicité de la stratégie de trading est son grand avantage, qui permet même aux traders débutants de négocier avec succès avec elle. VR Cub calcule les points d'ouve
Infinity Trend Pro
Yaroslav Varankin
1 (1)
This is a trend indicator without redrawing Developed instead of the binary options strategy (by the color of the Martingale candlestick) Also works well in forex trading When to open trades (binary options) A signal will appear in the place with a candle signaling the current candle It is recommended to open a deal for one candle of the current timeframe M1 and M5 When a blue dot appears, open a deal up When a red dot appears, open a trade down. How to open trades on Forex. When a signal is rec
PABT Pattern Indicator - it's classical system one of the signal patterns. Indicator logic - the Hi & Lo of the bar is fully within the range of the preceding bar, look to trade them as pullback in trend. In the way if indicator found PABT pattern it's drawing two lines and arrow what showing trend way.  - First line - it's entry point and drawing at: 1. On the high of signal bar or on middle of the signal bar (depending from indicator mode) for buy; 2. On the low of signal bar or on middle of t
The CCI Divergence is a reasonably useful indicator in itself, but it is even more effective when used with divergence pattern trading. The CCI Divergence indicator signal is one of the most potent signals among the indicators that exist in the market. Here is new version for Divergence Indicator using CCI method, with more improvements. Divergences indicate a potential investment point because the directional moment does not confirm the price. A bullish divergence occurs when the underlying
PZ Trend Trading
PZ TRADING SLU
4.8 (5)
Capture every opportunity: your go-to indicator for profitable trend trading Special Offer: Purchase now to receive free bonuses worth $159! (Read more for details) Trend Trading is an indicator designed to profit as much as possible from trends taking place in the market, by timing pullbacks and breakouts. It finds trading opportunities by analyzing what the price is doing during established trends. [ Installation Guide | Update Guide | Troubleshooting | FAQ | All Products ] Trade financial
Insider Scalper Binary This tool is designed to trade binary options. for short temporary spends. to make a deal is worth the moment of receiving the signal and only 1 candle if it is m1 then only for a minute and so in accordance with the timeframe. for better results, you need to select well-volatile charts.... recommended currency pairs eur | usd, usd | jpy .... the indicator is already configured, you just have to add it to the chart and trade .... The indicator signals the next can
Owl smart levels
Sergey Ermolov
4.58 (55)
Version MT5  |  FAQ L' indicateur Owl Smart Levels   est un système de trading complet au sein d'un seul indicateur qui comprend des outils d'analyse de marché populaires tels que   les fractales avancées de Bill Williams , Valable ZigZag qui construit   la structure d'onde correcte   du marché et   les niveaux de Fibonacci   qui marquent les niveaux exacts d'entrée. sur le marché et les endroits où prendre des bénéfices. Description détaillée de la stratégie Mode d'emploi de l'indicateur Conse
True SnD
Indra Lukmana
5 (1)
This Supply & Demand indicator uses a unique price action detection to calculate and measures the supply & demand area. The indicator will ensure the area are fresh and have a significant low risk zone. Our Supply Demand indicator delivers functionality previously unavailable on any trading platform. Trading idea You may set pending orders along the supply & demand area. You may enter a trade directly upon price hit the specific area (after a rejection confirmed). Input parameters Signal - S
This indicator is another variant of the famous powerful indicator Fibonacci-SS https://www.mql5.com/en/market/product/10136 but has different behaviour in placing Pending Order and TP Line. Automatically places Fibonacci retracement lines from the last highest and lowest visible bars on the chart with: An auto Pending Order (Buy/Sell). Taking Profit 1, Taking Profit 2 is pivot point and Taking Profit 3 for extended reward opportunity. The best risk and reward ratio. Simple and powerful indica
Introducing our advanced MQL4 Indicator, a groundbreaking tool for identifying support and resistance zones with unmatched precision. Elevate your trading strategy with a host of features, including a dual-color upper and lower box system that allows for easy visual recognition of market trends. Key Features: Dual-Color Box for the Support and Resistance Zones Customize your analysis with dual-color box. The upper and lower boxes offer distinct colors, providing a clear visual representation o
Trendiness Index
Libertas LLC
5 (3)
"The trend is your friend" is one of the best known sayings in investing, because capturing large trendy price movements can be extremely profitable. However, trading with the trend is often easier said than done, because many indicators are based on price reversals not trends. These aren't very effective at identifying trendy periods, or predicting whether trends will continue. We developed the Trendiness Index to help address this problem by indicating the strength and direction of price trend
Master Scalping M1 est un indicateur innovant qui utilise un algorithme pour déterminer rapidement et avec précision la tendance. L'indicateur calcule le temps d'ouverture et de fermeture des positions, les algorithmes de l'indicateur vous permettent de trouver les moments idéaux pour entrer dans une transaction (acheter ou vendre un actif), ce qui augmente le succès des transactions pour la plupart des commerçants. Avantages de l'indicateur : Facile à utiliser, ne surcharge pas le graphique ave
The Th3Eng PipFinite indicator is based on a very excellent analysis of the right trend direction with perfect custom algorithms. It show the true direction and the best point to start trading. With StopLoss point and Three Take Profit points. Also it show the right pivot of the price and small points to order to replace the dynamic support and resistance channel, Which surrounds the price. And Finally it draws a very helpful Box on the left side on the chart includes (take profits and Stop loss
Indicator without redrawing Divergent MAX The DivirgentMAX indicator is a modification based on the MACD. The tool detects divergence based on OsMA and sends signals to buy or sell (buy|sell), taking into account the type of discrepancies detected. Important!!!! In the DivirgentMAX indicator, the optimal entry points are drawn using arrows in the indicator's basement. Divergence is also displayed graphically. In this modification of the MACD, the lag problem characteristic of its predecessor
Trend PA
Mikhail Nazarenko
5 (3)
The Trend PA indicator uses   Price Action   and its own filtering algorithm to determine the trend. This approach helps to accurately determine entry points and the current trend on any timeframe. The indicator uses its own algorithm for analyzing price changes and Price Action. Which gives you the advantage of recognizing, without delay, a new nascent trend with fewer false positives. Trend filtering conditions can be selected in the settings individually for your trading style. The indicator
Laser Trend
Nicolas Zouein
The trend is your friend! This is what this indicator is all about. Follow this famous saying and be safe. Characteristics: Buy/Sell signals fixed on the close of a bar. Works on all symbols and all timeframes. Clear visual market trend laser line, Buy/Sell signal arrows, market strength meter, TP1 & TP2 boxes. Visual signals when to enter, when to exit the market. No repainting. Compatible with Flexible EA for trading automation. (Ask for a free set file optimized to perform 2010-2018) Para
Binary Options Support Resistance Indicator This indicator is designed for binary options trading and effectively shows retracements from support and resistance levels. Signals appear on the current candle. A red arrow pointing downwards indicates a potential selling opportunity, while a blue arrow pointing upwards suggests buying opportunities. All that needs adjustment is the color of the signal arrows. It is recommended to use it on the M1-M5 timeframes as signals are frequent on these timef
ZhiBiCCI MT4
Qiuyang Zheng
5 (1)
[ZhiBiCCI] indicators are suitable for all cycle use, and are also suitable for all market varieties. [ZhiBiCCI] Green solid line is a reversal of bullish divergence. The green dotted line is a classic bullish divergence. [ZhiBiCCI] The solid line to the red is a reverse bearish divergence. The red dotted line is a classical bearish divergence. [ZhiBiCCI] can be set in the parameters (Alert, Send mail, Send notification), set to (true) to send instant signals to the alarm window, email, in
Arriator
Nadiya Mirosh
The Arriator forex indicator algorithm allows you to quickly determine the current trend in the market. The Elephant indicator accompanies long-term trends and can be used without restrictions on instruments or timeframes. This indicator not only helps predict future values, but also generates buy and sell signals. It tracks market trends, ignoring wild swings and market noise around the average price. The indicator implements a type of technical analysis based on the idea of ​​market cyclicalit
Atomic Analyst
Issam Kassas
5 (3)
Tout d'abord, il convient de souligner que cet indicateur de trading n'est ni repainting, ni redrawing et ne présente aucun délai, ce qui le rend idéal à la fois pour le trading manuel et automatisé. Manuel de l'utilisateur : réglages, entrées et stratégie. L'Analyste Atomique est un indicateur d'action sur les prix PA qui utilise la force et le momentum du prix pour trouver un meilleur avantage sur le marché. Équipé de filtres avancés qui aident à éliminer les bruits et les faux signaux, et à
Fibonacci retracement and extension line drawing tool Fibonacci retracement and extended line drawing tool for MT4 platform is suitable for traders who use  golden section trading Advantages: There is no extra line, no too long line, and it is easy to observe and find trading opportunities Trial version: https://www.mql5.com/zh/market/product/35884 Main functions: 1. Multiple groups of Fibonacci turns can be drawn directly, and the relationship between important turning points
PZ 123 Pattern
PZ TRADING SLU
3.75 (4)
Unlock powerful breakout opportunities The 123 Pattern is one of the most popular, powerful and flexible chart patterns. The pattern is made up of three price points: a bottom, a peak or valley, and a Fibonacci retracement between 38.2% and 71.8%. A pattern is considered valid when the price breaks beyond the last peak or valley, moment at which the indicator plots an arrow, rises an alert, and the trade can be placed. [ Installation Guide | Update Guide | Troubleshooting | FAQ | All Products ]
Cosmic Diviner X Planet
Olena Kondratenko
4 (2)
This unique multi-currency strategy simultaneously determines the strength of trends and market entry points, visualizing this using histograms on the chart. The indicator is optimally adapted for trading on the timeframes М5, М15, М30, Н1. For the convenience of users, the indicator renders the entry point (in the form of an arrow), recommended take profit levels (TP1, TP2 with text labels) and the recommended Stop Loss level. The take profit levels (TP1, TP2) are automatically calculated for
Fib Zone
Ezinne Judith Orji
A Chart Analytics Program and helps in asset analysis using the Fibonacci Complex.  The primary Fibonacci numbers used in trading are 61.8% and 38.2%. 8% is derived from dividing any number in the Fibonacci sequence by its previous one. F n / F n-1 2% is derived by squaring 61.8 and alternatively by dividing any number in the sequence by the number two places to its right. F n  /F n+2 The second tier of Fibonacci numbers used in trading is 23.6%, 76.4%, and 78.6%. 6% is derived from dividing a
The indicator displays the data of the Stochastic oscillator from a higher timeframe on the chart. The main and signal lines are displayed in a separate window. The stepped response is not smoothed. The indicator is useful for practicing "manual" forex trading strategies, which use the data from several screens with different timeframes of a single symbol. The indicator uses the settings that are identical to the standard ones, and a drop-down list for selecting the timeframe. Indicator Parame
The indicator displays a matrix of indicators across multiple timeframes with a sum total and optional alert. Custom indicators can also be added to the matrix, in a highly configurable way. The alert threshold can be set to say what percentage of indicators need to be in agreement for an alert to happen. The alerts can turned on/off via on chart tick boxes and can be set to notify to mobile or sent to email, in addition to pop-up. The product offers a great way to create an alert when multiple
Trade with Gann on your side!! MASTER CIRCLE 360 CIRCLE CHART, originally created by Gann admitted that this is “The Mother of all charts”. It is one of the last studies that this great trader left for us. The numeric tab le is apparently quite simple like all the tables and is based on square numbers, the SQUARE OF 12 and is by evolution, one of the most important square numbers. Here we can find CYCLE, PRICE AND TIME thanks to angles and grades, to show past and future support and resistance.
Distinctive
Tatiana Savkevych
Distinctive is a forex trending arrow indicator for identifying potential entry points. I like it, first of all, because it has a simple mechanism of work, adaptation to all time periods and trading tactics. Created on the basis of a regression channel with filters. Plotting the Lawrence indicator signals on a price function chart using a mathematical approach. How it works - when the price breaks out in the overbought / oversold zone (channel levels), a buy or sell signal is generated. Every
Noize Absorption Index MT4
Ekaterina Saltykova
5 (1)
Noize Absorption Index - is the manual trading system that measures the difference of pressure between bears forces and bulls forces. Green line - is a noize free index that showing curent situation. Zero value of index shows totally choppy/flat market.Values above zero level shows how powerfull bullish wave is and values below zero measures bearish forces.Up arrow appears on bearish market when it's ready to reverse, dn arrow appears on weak bullish market, as a result of reverse expectation. S
Monster Harmonic Indicator
Paul Geirnaerdt
4.61 (31)
Monster Harmonics Indicator is a harmonic pattern indicator. It recognizes Gartley, Bat, Crab, Butterfly, Cypher, White Swan, Black Swan, Shark and several other patterns. Projected patterns that are not yet completed are recognized, too. Monster even shows the PRZ (Potential Reversal Zone). Users can add their own user defined patterns to Monster. Besides the current pattern, Monster also shows all patterns in the symbols history. Monster will provide alerts for developing patterns. Introduced
Les acheteurs de ce produit ont également acheté
Gann Made Easy
Oleg Rodin
4.88 (100)
Gann Made Easy est un système de trading Forex professionnel et facile à utiliser qui est basé sur les meilleurs principes de trading en utilisant la théorie de mr. WD Gann. L'indicateur fournit des signaux d'ACHAT et de VENTE précis, y compris les niveaux Stop Loss et Take Profit. Vous pouvez échanger même en déplacement en utilisant les notifications PUSH. S'il vous plaît contactez-moi après l'achat! Je partagerai avec vous mes astuces de trading et d'excellents indicateurs bonus gratuitement!
Trend Punch
Mohamed Hassan
4.91 (23)
This indicator is unstoppable when combined with our other indicator called  Support & Resistance . After purchase, send us a message and you will get it   for  FREE as a BONUS! Introducing Trend Punch , the revolutionary forex trend indicator that will transform the way you trade! Trend Punch is uniquely designed to provide precise buy and sell arrows during strong market trends, making your trading decisions clearer and more confident. Whether you're trading major currency pairs or exotic sym
Gold Stuff
Vasiliy Strukov
4.9 (270)
Gold Stuff est un indicateur de tendance conçu spécifiquement pour l'or et peut également être utilisé sur n'importe quel instrument financier. L'indicateur ne se redessine pas et ne traîne pas. Délai recommandé H1. Au niveau de l'indicateur de travail, l'Expert Advisor EA Gold Stuff est entièrement automatique. Vous pouvez le trouver sur mon profil. Vous pouvez obtenir une copie gratuite de notre indicateur Strong Support et Trend Scanner, veuillez envoyer un message privé. moi! Contactez
FX Power MT4 NG
Daniel Stein
5 (13)
Obtenez votre mise à jour quotidienne du marché avec des détails et des captures d'écran via notre Morning Briefing ici sur mql5 et sur Telegram ! FX Power MT4 NG est la nouvelle génération de notre très populaire indicateur de force des devises, FX Power. Et qu'est-ce que ce compteur de force de nouvelle génération offre ? Tout ce que vous avez aimé de l'original FX Power PLUS Analyse de la force de l'OR/XAU Des résultats de calcul encore plus précis Périodes d'analyse configurables individuel
VEUILLEZ LIRE LES INFORMATIONS CI-DESSOUS AVANT D'ACHETER LE PRODUIT! Apollo Pips PLUS SP est un produit unique! C'EST POUR CEUX QUI VEULENT OBTENIR MON NOUVEL INDICATEUR "APOLLO PIPS" PLUS BONUS "SUPER PACK" AVEC ACCÈS À TOUS MES INDICATEURS DE TRADING! En achetant le produit Apollo Pips PLUS SP, vous achetez en fait une toute nouvelle version de mon indicateur Apollo Pips. Cette version de l'indicateur dispose d'un algorithme amélioré et d'un paramètre facile à utiliser qui vous donne la possi
TPSproTREND PrO
Roman Podpora
4.79 (19)
TPSpro TREND PRO   est un indicateur de tendance qui analyse automatiquement le marché et fournit des informations sur la tendance et chacun de ses changements, ainsi que des signaux pour entrer dans des transactions sans redessiner ! L'indicateur utilise chaque bougie et les analyse séparément. faisant référence à différentes impulsions - impulsion ascendante ou descendante. Points d'entrée précis dans les transactions sur les devises, les crypto-monnaies, les métaux, les actions, les indices 
Trend Pulse
Mohamed Hassan
5 (5)
Please contact me after purchase to immediately get your PDF strategy + documentation for Trend Pulse !  Official release price of $89  (2 /50 copies left). Next price is $199 . Introducing Trend Pulse , a unique and robust indicator capable of detecting bullish, bearish, and even ranging trends! Trend Pulse uses a special algorithm to filter out market noise with real precision. If the current symbol is moving sideways, Trend Pulse will send you a ranging signal, letting you know that it'
Scalper Inside PRO
Alexey Minkov
4.75 (60)
An exclusive indicator that utilizes an innovative algorithm to swiftly and accurately determine the market trend. The indicator automatically calculates opening, closing, and profit levels, providing detailed trading statistics. With these features, you can choose the most appropriate trading instrument for the current market conditions. Additionally, you can easily integrate your own arrow indicators into Scalper Inside Pro to quickly evaluate their statistics and profitability. Scalper Inside
Currency Strength Wizard est un indicateur très puissant qui vous offre une solution tout-en-un pour un trading réussi. L'indicateur calcule la puissance de telle ou telle paire de devises en utilisant les données de toutes les devises sur plusieurs périodes. Ces données sont représentées sous la forme d'un indice de devise facile à utiliser et de lignes électriques de devise que vous pouvez utiliser pour voir la puissance de telle ou telle devise. Tout ce dont vous avez besoin est d'attacher l'
Actuellement 20% de réduction ! La meilleure solution pour tout débutant ou trader expert ! Ce logiciel de tableau de bord fonctionne sur 28 paires de devises. Il est basé sur 2 de nos principaux indicateurs (Advanced Currency Strength 28 et Advanced Currency Impulse). Il donne un excellent aperçu de l'ensemble du marché Forex. Il montre les valeurs de l'Advanced Currency Strength, la vitesse de mouvement des devises et les signaux pour 28 paires de devises dans tous les (9) délais. Imagine
Clear Breakout
Martin Alejandro Bamonte
5 (1)
L'indicateur "Breakout Buy-Sell" est conçu pour identifier et mettre en évidence des opportunités d'achat et de vente potentielles basées sur les ruptures de prix pendant différentes sessions de marché (Tokyo, Londres et New York). Cet indicateur aide les traders à visualiser clairement les zones d'achat et de vente, ainsi que les niveaux de take-profit (TP) et de stop-loss (SL). Stratégie d'utilisation L'indicateur peut être utilisé comme suit : Configuration initiale : Sélectionnez la session
ACTUELLEMENT 26% DE RÉDUCTION La meilleure solution pour tout débutant ou trader expert ! Cet indicateur est un outil de trading unique, de haute qualité et abordable car nous avons incorporé un certain nombre de caractéristiques exclusives et une nouvelle formule. Avec seulement UN graphique, vous pouvez lire la force de la devise pour 28 paires Forex ! Imaginez comment votre trading va s'améliorer parce que vous êtes capable de repérer le point de déclenchement exact d'une nouvelle tendan
Le système PRO Renko est un système de trading très précis spécialement conçu pour le trading de graphiques RENKO. Il s'agit d'un système universel qui peut être appliqué à divers instruments de négociation. Le système neutralise efficacement ce qu'on appelle le bruit du marché en vous donnant accès à des signaux d'inversion précis. L'indicateur est très facile à utiliser et n'a qu'un seul paramètre responsable de la génération du signal. Vous pouvez facilement adapter l'outil à n'importe q
Gold Channel is a volatility-based indicator, developed with a specific timing algorithm for the XAUUSD pair, which consists of finding possible corrections in the market. This indicator shows two outer lines, an inner line (retracement line) and an arrow sign, where the theory of the channel is to help identify overbought and oversold conditions in the market. The market price will generally fall between the boundaries of the channel. If prices touch or move outside the channel it is a tra
Tout d'abord, il convient de souligner que cet outil de trading est un indicateur non repeint, non redessiné et non retardé, ce qui le rend idéal pour le trading professionnel. Cours en ligne, manuel utilisateur et démonstration. L'indicateur Smart Price Action Concepts est un outil très puissant à la fois pour les nouveaux et les traders expérimentés. Il regroupe plus de 20 indicateurs utiles en un seul, combinant des idées de trading avancées telles que l'analyse du trader Inner Circle et les
ACTUELLEMENT 31% DE RÉDUCTION ! ! La meilleure solution pour tout débutant ou Expert Trader ! Cet indicateur est un outil de trading unique, de haute qualité et abordable car nous avons incorporé un certain nombre de caractéristiques exclusives et une formule secrète. Avec seulement UN graphique, il donne des alertes pour les 28 paires de devises. Imaginez comment votre trading s'améliorera parce que vous serez capable de repérer le point de déclenchement exact d'une nouvelle tendance ou d'
NAM Order Blocks
NAM TECH GROUP, CORP.
5 (1)
MT4 Multi-timeframe Order Blocks detection indicator. Features - Fully customizable on chart control panel, provides complete interaction. - Hide and show control panel wherever you want. - Detect OBs on multiple timeframes. - Select OBs quantity to display. - Different OBs user interface. - Different filters on OBs. - OB proximity alert. - ADR High and Low lines. - Notification service (Screen alerts | Push notifications). Summary Order block is a market behavior that indicates order collection
RelicusRoad Pro
Relicus LLC
4.73 (141)
Maintenant 147 $ (augmentant à 499 $ après quelques mises à jour) - Comptes illimités (PCS ou Mac) Manuel d'utilisation RelicusRoad + Vidéos de formation + Accès au groupe Discord privé + Statut VIP UNE NOUVELLE FAÇON DE REGARDER LE MARCHÉ RelicusRoad est l'indicateur de trading le plus puissant au monde pour le forex, les contrats à terme, les crypto-monnaies, les actions et les indices, offrant aux traders toutes les informations et tous les outils dont ils ont besoin pour rester renta
TPSpro RFI Levels
Roman Podpora
4.83 (24)
Reversal First Impulse levels (RFI)    INSTRUCTIONS        RUS       -       ENG              R ecommended to use with an indicator   -   TPSpro  TREND PRO -  Version MT5 A key element in trading is zones or levels from which decisions to buy or sell a trading instrument are made. Despite attempts by major players to conceal their presence in the market, they inevitably leave traces. Our task was to learn how to identify these traces and interpret them correctly. Main functions: Displaying activ
Break and Retest
Mohamed Hassan
4.17 (18)
This Indicator only places quality trades when the market is really in your favor with a clear break and retest. Patience is key with this price action strategy! If you want more alert signals per day, you increase the number next to the parameter called: Support & Resistance Sensitivity.  After many months of hard work and dedication, we are extremely proud to present you our  Break and Retest price action indicator created from scratch. One of the most complex indicators that we made with ove
Order Block Hunter
Noha Mohamed Fathy Younes Badr
5 (2)
Order block hunter indicator is the best indicator for  hunt the order blocks that area where there has been a large concentration of limit orders waiting to be executed Order blocks are identified on a chart by observing previous price action and looking for areas where the price experienced significant movement or sudden changes in direction .This indicator does that for you by using very complicated codes and helps you to take the best areas To buy and sell because it make marks at the best a
Scalper Vault
Oleg Rodin
5 (29)
Scalper Vault est un système de scalpage professionnel qui vous fournit tout ce dont vous avez besoin pour un scalpage réussi. Cet indicateur est un système de trading complet qui peut être utilisé par les traders de forex et d'options binaires. Le délai recommandé est M5. Le système vous fournit des signaux fléchés précis dans le sens de la tendance. Il vous fournit également des signaux supérieurs et inférieurs et des niveaux de marché Gann. Les indicateurs fournissent tous les types d'alertes
M1 Arrow
Oleg Rodin
4.73 (15)
Une stratégie intraday basée sur deux principes fondamentaux du marché. L'algorithme est basé sur l'analyse des volumes et des vagues de prix à l'aide de filtres supplémentaires. L'algorithme intelligent de l'indicateur ne donne un signal que lorsque deux facteurs de marché se combinent en un seul. L'indicateur calcule les vagues d'une certaine plage sur le graphique M1 en utilisant les données de la période la plus élevée. Et pour confirmer la vague, l'indicateur utilise une analyse en volume.
Backtest and Read Overview before purchase. Chart patterns have been a topic of debate among traders; some believe they are reliable signalers, while others do not. Our Chart Patterns All-in-One indicator displays various chart patterns to help you test these theories for yourself. The profitability of these patterns is not a reflection of the indicator's effectiveness but rather an evaluation of the patterns themselves. The Chart Patterns All-in-One indicator is an excellent tool for visualizin
Advanced Supply Demand
Bernhard Schweigert
4.9 (314)
CURRENTLY 26% OFF !! Best Solution for any Newbie or Expert Trader! This indicator is a unique, high quality and affordable trading tool because we have incorporated a number of proprietary features and a new formula. With this update, you will be able to show double timeframe zones. You will not only be able to show a higher TF but to show both, the chart TF, PLUS the higher TF: SHOWING NESTED ZONES. All Supply Demand traders will love it. :) Important Information Revealed Maximize the potenti
AW Trend Predictor
AW Trading Software Limited
4.74 (39)
La combinaison des niveaux de tendance et de panne dans un seul système. Un algorithme d'indicateur avancé filtre le bruit du marché, détermine la tendance, les points d'entrée, ainsi que les niveaux de sortie possibles. Les signaux indicateurs sont enregistrés dans un module statistique, qui vous permet de sélectionner les outils les plus appropriés, montrant l'efficacité de l'historique des signaux. L'indicateur calcule les marques Take Profit et Stop Loss. Manuel et instruction ->   Ici   /
Connect Indicator
Sukunthakan Ngernbamrung
Connect Indicator is a tool used for connecting indicators between the MQL market and MT4. The connected indicators are made by our group and can be used for other applications, such as sending messages to the Line application or Telegram application. If you have any questions, please don't hesitate to ask us to receive support. Function and indicator buffer Buffer one is the high price of the previous candle. Buffer two is the high price of the previous candle. Usage To connect indicators to fu
Découvrez le secret pour réussir le trading Forex avec notre indicateur MT4 personnalisé! Vous êtes-vous déjà demandé comment réussir sur le marché du Forex, gagnant régulièrement des bénéfices tout en minimisant les risques? Voici la réponse que vous avez recherchée! Permettez-nous d'introduire notre indicateur MT4 propriétaire qui révolutionnera votre approche du trading. Polyvalence unique Notre indicateur est spécialement conçu pour les utilisateurs qui préfèrent les formations de bou
Entry Points Pro
Yury Orlov
4.7 (226)
Indicateur supérieur pour MT4 fournissant des signaux précis pour entrer dans un trade sans repeindre ! Il peut être appliqué à tous les actifs financiers : forex, cryptocurrencies, métaux, actions, indices.  La version MT5 est ici Il fournira des signaux de trading assez précis et vous dira quand il est préférable d'ouvrir un trade et de le fermer. Regardez la vidéo (6:22) avec un exemple de traitement d'un seul signal qui a rapporté à l'indicateur ! La plupart des traders améliorent l
Sense
Ivan Stefanov
SENSE est un système automatisé qui combine des méthodes GANN sélectionnées avec des calculs fractals. Le système nous indique où ouvrir et fermer les transactions. Plus besoin de perdre du temps avec des calculs complexes - SENSE fait tout pour vous. Il suffit d'installer l'indicateur. Principes de base : Le marché est haussier lorsque le prix se situe au-dessus des lignes blanches. Acheter au-dessus des lignes blanches, s'arrêter en dessous Les lignes vertes sont des objectifs de haus
Plus de l'auteur
[V 1.00] MTF NRPA 5 Moving Average RTD est sorti ! Tableau de bord en temps réel avec flèche non repeinte. Si vous recherchez le meilleur indicateur de moyenne mobile, vous êtes sur la bonne page. Généralement, les gens installeront deux moyennes mobiles car l'intersection des deux moyennes mobiles (le croisement) déterminera la direction de la prochaine tendance des prix. Si la moyenne mobile rapide croise la moyenne mobile lente et rapide> lente, la tendance est à la hausse. Inversement,
L'analyse de plusieurs périodes d'une paire de devises dans une seule fenêtre peut vous rendre confus. Pour analyser plusieurs échelles de temps, vous avez besoin d'indicateurs fiables. L'un d'eux utilise la courbe MACD 9TF. J'ai travaillé jour et nuit pour créer un code simple mais fiable et couvrant les neuf périodes de temps dans un seul indicateur. Regardons quelques-uns des avantages de cet indicateur : Histogramme coloré. La couleur de la courbe dans chaque période est différent
L'analyse de plusieurs périodes d'une paire de devises dans une seule fenêtre peut vous rendre confus. Pour analyser plusieurs échelles de temps, vous avez besoin d'indicateurs fiables. L'un d'eux utilise 9TF STOCH RSI. J'ai travaillé jour et nuit pour créer un code simple mais fiable et couvrant les neuf périodes de temps dans un seul indicateur. Regardons quelques-uns des avantages de cet indicateur : Histogramme coloré. La couleur de la courbe dans chaque période est différente l'u
Analyzing multiple time frames of a currency pair in one window can make you confused. To analyze multiple time frames, you need reliable indicators. One of them is using 9TF RSI MA . I've been working day and night to create code that is simple but reliable and covers all nine time frames in just one indicator .  Let's look at some of the advantages of this indicator: Colorful histogram . The color of the curve in each timeframe is different from one another.  Arrows indicating the crossing of
Analyzing multiple time frames of a currency pair in one window can make you confused. To analyze multiple time frames, you need reliable indicators. One of them is using 9TF MACD Limited Bar . I've been working day and night to create code that is simple but reliable and covers all nine time frames in just one indicator .  Attention! When first installed, the indicator does not look intact. Changing the timeframe will solve the problem. Let's look at some of the advantages of this indicator: C
Analyzing multiple time frames of a currency pair in one window can make you confused. To analyze multiple time frames, you need reliable indicators. One of them is using 9TF STOCH RSI LIMITED BAR . I've been working day and night to create code that is simple but reliable and covers all nine time frames in just one indicator .  Attention! When first installed, the indicator does not look intact. Changing the timeframe will solve the problem. Let's look at some of the advantages of this indicat
L'analyse de plusieurs périodes d'une paire de devises dans une seule fenêtre peut vous rendre confus. Pour analyser plusieurs échelles de temps, vous avez besoin d'indicateurs fiables. L'un d'eux utilise 9TF Double RSI Double MA. J'ai travaillé jour et nuit pour créer un code simple mais fiable et couvrant les neuf périodes de temps dans un seul indicateur. Regardons quelques-uns des avantages de cet indicateur : Double RSI, c'est-à-dire RSI plus rapide et RSI plus lent. Double MA, c
Un indicateur CCI précis est disponible. Tableau de bord Trend Bar Smart Level 9TF Double CCI. Double CCI, c'est-à-dire Fast CCI & Slow CCI Pourquoi avez-vous besoin d'une deuxième CCI ? L'utilisation d'indicateurs supplémentaires nous convaincra davantage dans le trading en direct Courbe CCI rapide 9TF 9TF Courbe CCI lente Angle CCI en temps réel 9TF Valeur CCI en temps réel 9TF Direction/phase CCI en temps réel 9TF Barre de tendance 9TF Nouvel algo dans le calcul de la barre de tendance Bou
Un indicateur RSI précis est disponible. Dashboard Trend Bar Smart Level 9TF double rsi. Double RSI, c'est-à-dire RSI rapide et RSI lent Pourquoi avez-vous besoin du deuxième RSI? L'utilisation d'indicateurs supplémentaires nous convaincra davantage dans le trading en direct Courbe RSI 9TF Fast Courbe RSI lent 9tf Angle RSI en temps réel 9TF 9tf Valeur RSI en temps réel 9tf Direction / phase RSI en temps réel Barre de tendance 9tf Nouvel algo dans le calcul de la barre de tendance Bouton ON /
Un indicateur MACD précis est disponible. Barre de tendance du tableau de bord Smart Level 9TF Double MACD. Double MACD, c'est-à-dire rapide (MACD 1) et lent (MACD 2) Pourquoi avez-vous besoin d'un deuxième MACD ? L'utilisation d'indicateurs supplémentaires nous convaincra davantage dans le trading en direct Courbe MACD 1 rapide 9TF Courbe MACD 2 lente 9TF Angle MACD en temps réel 9TF Valeur MACD en temps réel 9TF Direction MACD en temps réel 9TF Un indicateur MACD précis est disponible. Ba
Un indicateur stochastique précis est disponible. Barre de tendance du tableau de bord Smart Level 9TF Dual Stochastic. Stochastique double, c'est-à-dire stochastique rapide et stochastique lent Pourquoi avez-vous besoin d'un deuxième stochastique ? L'utilisation d'indicateurs supplémentaires nous convaincra davantage dans le trading en direct Courbe stochastique rapide 9TF 9TF Courbe stochastique lente Angle stochastique en temps réel 9TF 9TF valeur stochastique en temps réel Direction/phase
Si vous perdez souvent des transactions parce que vous n'utilisez qu'un seul indicateur, essayez cet outil de trading. Cet outil de trading utilise plus d'un indicateur. J'observe souvent des traders qui utilisent uniquement l'indicateur RSI. Très souvent, le marché est survendu mais toujours en baisse ou le marché est suracheté mais toujours en hausse. Pour cette raison, vous devez utiliser plusieurs indicateurs. Présentation de la nouvelle version V 3.40 MTF PPAAF : Flèche d'action précise su
[V 1.00] MTF NRPA 5 RSI RTD est sorti ! Tableau de bord en temps réel avec flèche non repeinte. Si vous en avez assez d'utiliser divers indicateurs RSI mais que vous constatez qu'ils sont inexacts, essayez cet outil. Habituellement, les gens n'installent qu'un seul RSI pour déterminer le niveau d'OBOS dans un laps de temps. La mauvaise nouvelle est que vous ne pouvez pas voir les niveaux et les tendances OBOS sur différentes périodes à la fois. C'est pourquoi j'ai développé cet outil de tra
Introducing the advanced trading tools of 2023. MTF PPAAF Model S. This is sub window version of my best trading tool : MTF Precise Price Action Arrow Filtered.  Click here to learn more about MTF PPAAF . This trading tool is equipped with various powerful features : MTF = Multi Time Frame = Time Frame can be changed. On/off button. Non Repaint Arrows.  Customizable parameter, color etc.  Can show all time frame (ATF) crossover arrows of fast stochastic main line & fast stochastic signal line (
If you are curious about the position of the stochastic, RSI, CCI curve, whether it is at the OBOS level or not, then this trading tool is for you. Introducing the advanced trading tools of 2024. ATF Trend Following Trend Bar OBOS. This indicator is similar to MTF PPAAF Model S but have two layers.  Click here to learn more about MTF PPAAFS . This trading tool is equipped with various powerful features : MTF = Multi Time Frame = Time Frame can be changed. On/off button. Customizable parameter,
Bonjour les commerçants. Présentation de mon meilleur outil de trading. FIM PPAAF Modèle T. Flèche d'action de prix précise sur plusieurs délais filtrée Modèle T.  Cet outil de trading est mon meilleur travail après des années de création de divers outils de trading. Pourquoi cet outil de trading est-il le meilleur et le plus fiable ?  1. Cet outil utilise 6 indicateurs :  Double CCI = CCI rapide x CCI lent Double stochastique = stochastique rapide (ligne principale stochast
Avec cet outil de trading, vous pouvez analyser 15 marchés simultanément. Présentation du nouvel indicateur de trading 2024 : ️ Tableau de bord multi-devises multi-périodes stochastiques. Il y a au moins deux raisons pour lesquelles j'ai créé cet outil de trading : Premièrement, j'en ai marre de n'observer qu'un seul marché. Deuxièmement, je ne veux pas perdre le moment d’entrée sur un autre marché. C'est pourquoi je souhaite connaître en même temps les autres conditions du marché.
Avec cet outil de trading, vous pouvez analyser 15 marchés simultanément. Présentation du nouvel indicateur de trading 2024 : ️ Tableau de bord multi-devises multi-périodes Double CCI. Il y a au moins deux raisons pour lesquelles j'ai créé cet outil de trading : Premièrement, j'en ai marre de n'observer qu'un seul marché. Deuxièmement, je ne veux pas perdre le moment d’entrée sur un autre marché. C'est pourquoi je souhaite connaître en même temps les autres conditions du marché. Po
Avec cet outil de trading, vous pouvez analyser 15 marchés simultanément. Présentation du nouvel indicateur de trading 2024 : ️ Tableau de bord multi-devises multi-périodes Double RSI. Il y a au moins deux raisons pour lesquelles j'ai créé cet outil de trading : Premièrement, j'en ai marre de n'observer qu'un seul marché. Deuxièmement, je ne veux pas perdre le moment d’entrée sur un autre marché. C'est pourquoi je souhaite connaître en même temps les autres conditions du marché. Po
Filtrer:
Aucun avis
Répondre à l'avis