SUM Swing HL n CP MT5
- Indicateurs
- Liu Ying Pei
- Version: 1.0
- Activations: 10
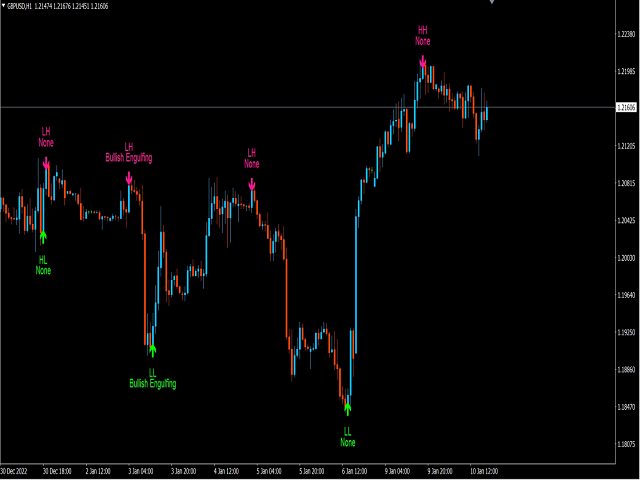
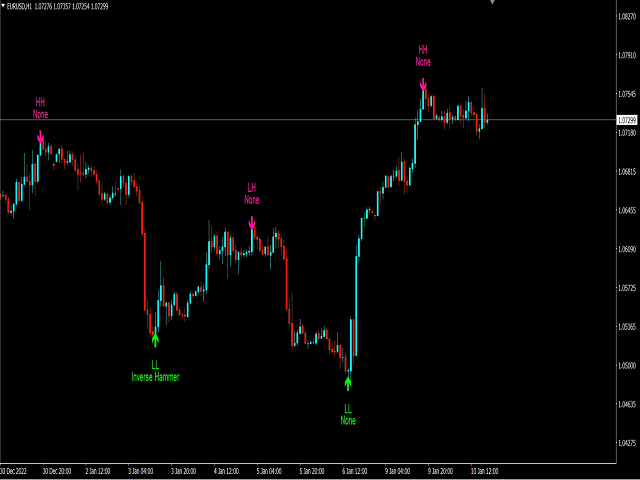
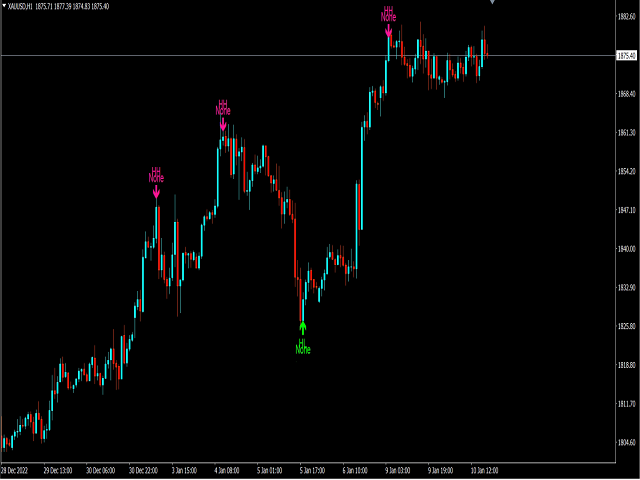
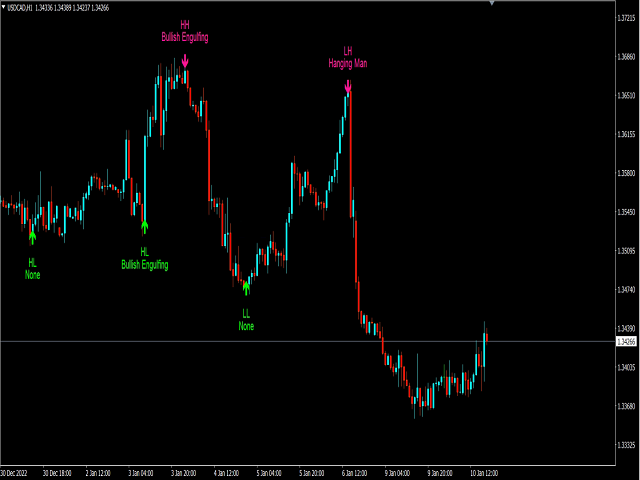
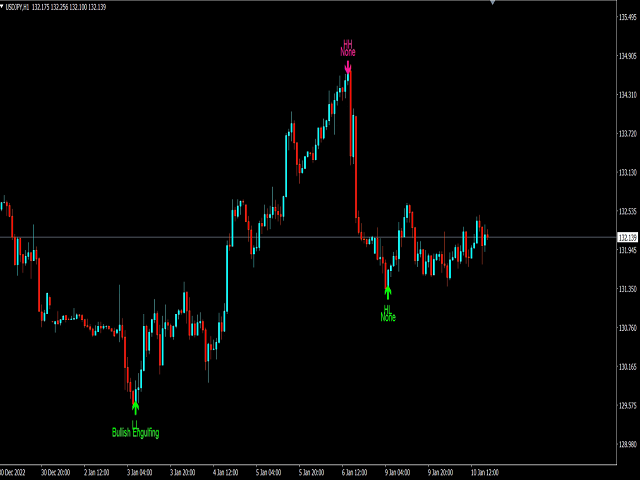
This indicator labels swing highs and swing lows as well as the candle pattern that occurred at that precise point.
The indicator can detect the following 6 candle patterns: hammer, inverse hammer, bullish engulfing, hanging man, shooting star and bearish engulfing.
The notations HH, HL, LH, and LL you can see on the labels are defined as follows:
- HH : Higher high
- HL : Higher low
- LH : Lower high
- LL : Lower low
Setting
- Length: Sensitivity of the swing high/low detection, with lower values returning the maximum/minimum of shorter-term price variations.
Usage & Details
It can be interesting to see if a top or bottom is associated with a specific candle pattern, this allows us to study the potential of such a pattern to indicate a reversal. You can hover on a label with a specific pattern to see more details about it.
Note that the labels are offset, and will appear later in real-time, as such this indicator is not intended to detect tops/bottoms in real-time.