TradeighT
- Indicateurs
- Lorenzo Monari
- Version: 31.48
- Mise à jour: 9 mai 2024
- Activations: 5
⭐ L'instrument identifie le mouvement réel que le marché utilise, avec de vrais calculs mathématiques basés sur les changements de prix.
⭐ L'exécution de TradeighT est vraiment basée sur cette relation mathématique qui existe depuis toujours.
⭐ La plupart des investisseurs regardent les mêmes choses, et étudient les mêmes informations, c'est la raison pour laquelle la majorité d'entre eux perdent de l'argent.
⭐ Il s'agit d'un produit basé non pas sur les idées communes à tous mais sur les 4 fondements réels qui dominent le marché.
⭐ L'instrument est un outil visuel, facile à comprendre et simple à utiliser, disponible pour tous les symboles backtestables.
Exclusivement pour MT4.
L'indicateur utilise des niveaux de prix très réactifs:
☆ fournit des prix take-profit actuels
☆ fournit des niveaux à utiliser avec l'analyse technique
☆ fournit le zigzag
☆ fournit le trend actuel
☆ fournit des objectifs ayant un % élevé de réussite
________________________________________________________________________________________________________________________________________________
TRENDLINE (sélectionnables)
TRENDLINE HORIZONTALE NON PERMANENTE BUY
- numérotées de 1 à 5
- couleur modifiable dans PROPRIÉTÉ DE l'INDICATEUR
- prix à utiliser comme takeprofit dans un ordre BUY
TRENDLINE HORIZONTALE NON PERMANENTE SELL
- numérotées de 1 à 5
- couleur modifiable dans PROPRIÉTÉ DE l'INDICATEUR
- prix à utiliser comme takeprofit dans un ordre SELL
TRENDLINE HORIZONTALE NON PERMANENTE
- à utiliser comme support ou résistance
TRENDLINE VERTICALE
- à utiliser comme référence temporelle pour le lancement d'une TRENDLINE HORIZONTALE NON PERMANENTE
________________________________________________________________________________________________________________________________________________
MÉTRIQUE GÉNÉRALE
Chaque NUMÉRO est lié à une bougie.
Chaque NUMÉRO a sa propre TRENDLINE HORIZONTALE NON PERMANENTE.
Chaque TRENDLINE HORIZONTALE NON PERMANENTE a sa propre TRENDLINE VERTICALE.
Lorsque la TRENDLINE HORIZONTALE NON PERMANENTE est touchée par le prix, elle disparaît.
Lorsqu'une TRENDLINE HORIZONTALE NON PERMANENTE disparaît, le NUMÉRO et la TRENDLINE VERTICALE liés à cette TRENDLINE HORIZONTALE NON PERMANENTE disparaissent.
Si la TRENDLINE HORIZONTALE NON PERMANENTE disparaît avant d'être touchée par les prix, une nouvelle TRENDLINE HORIZONTALE NON PERMANENTE avec le NUMÉRO suivant apparaît dans la direction opposée.
________________________________________________________________________________________________________________________________________________
LIGNES VERTICALES
LIGNE VERTICALE BUY
- couleur de la TRENDLINE HORIZONTALE NON PERMANENTE BUY
- indique un TREND BUY
LIGNE VERTICALE SELL
- couleur de la TRENDLINE HORIZONTALE NON PERMANENTE SELL
- indique un TREND SELL
________________________________________________________________________________________________________________________________________________
OPÉRATIVITÉ
L'instrument fournit toutes les informations nécessaires pour identifier avec une extrême précision les futurs mouvements de prix
avec la possibilité d'analyser l'historique par recherche et statistique.
En plus de fournir tous les détails nécessaires à une analyse complète, l'instrument génère des signaux avec un % de réussite élevé.
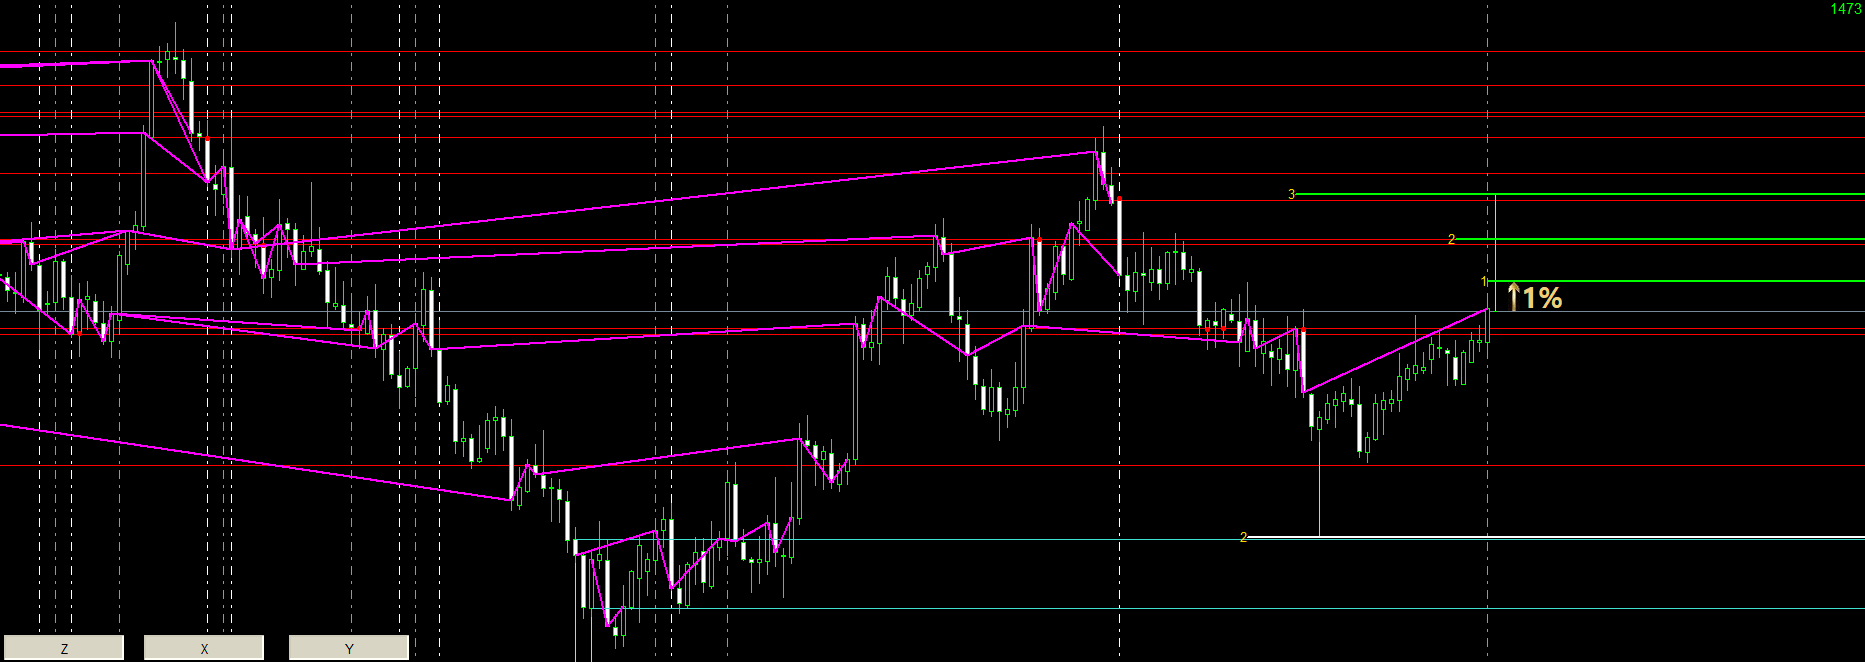
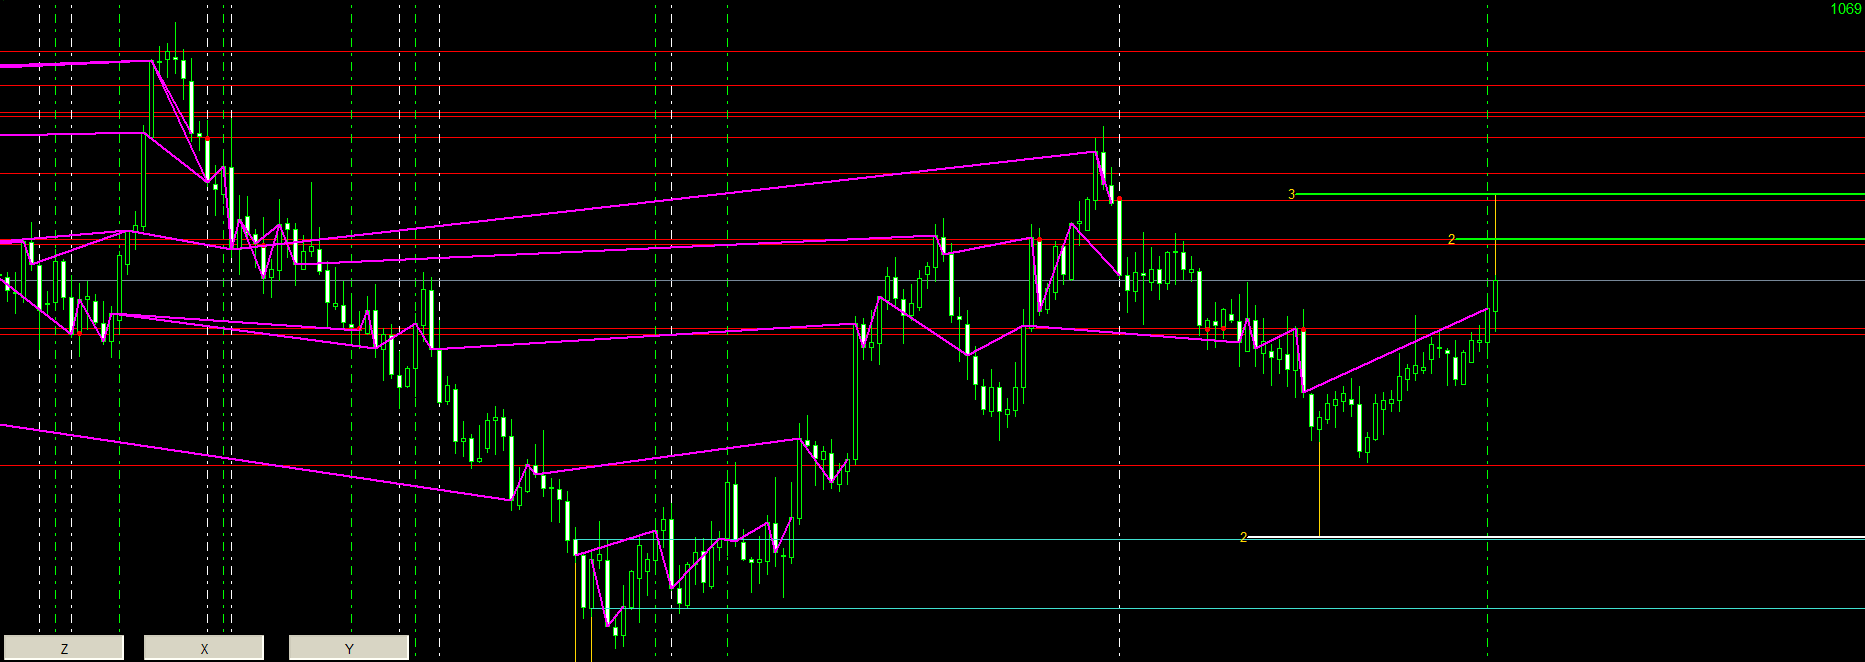
SIGNAL BUY
Si la bougie qui précède la bougie actuelle possède la LIGNE VERTICALE BUY,
utiliser le TP1 SIGNAL BUY comme cible, c'est-à-dire la TRENDLINE HORIZONTALE NON PERMANENTE BUY 1 (TP1) avec le NUMÉRO mis en évidence par la LIGNE VERTICALE BUY.
Exemple dans les images.
Si le TP1 SIGNAL BUY disparaît avant d'avoir été touché par le prix, choisir si:
- changer de direction d'investissement en utilisant TP2 comme nouvel objectif
- interrompre la série et attendre un nouveau TP1 SIGNAL
- clôturer l'investissement
La gestion monétaire joue un rôle important, où l'investisseur a la possibilité de choisir si:
- récupérer la perte du TP1 SIGNAL BUY avec les TP suivants de cette bougie (TP2, TP3..)
- récupérer la perte du TP1 SIGNAL BUY avec le TP1 SIGNAL suivant
- subir la perte
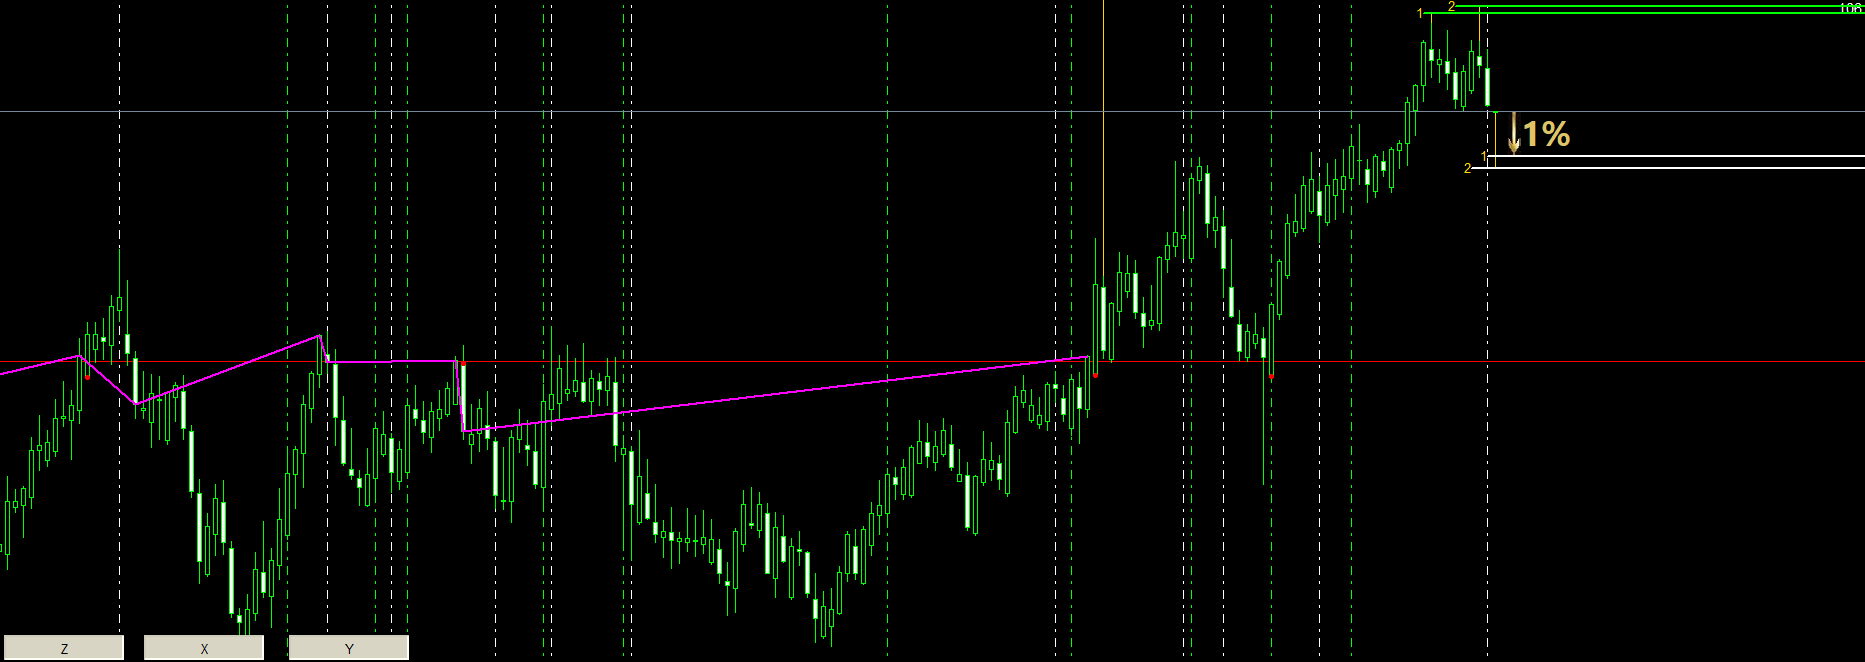
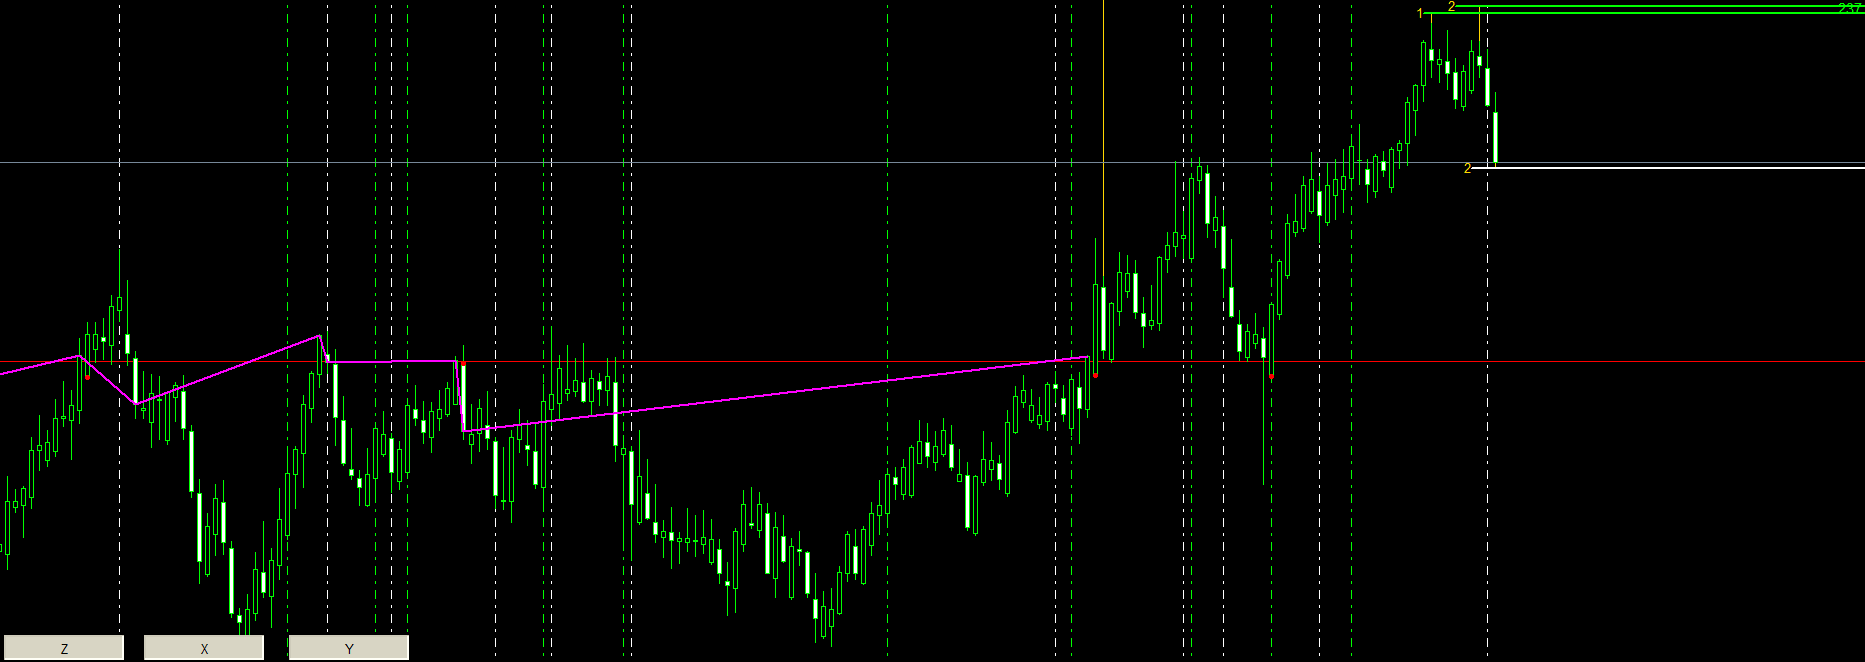
SIGNAL SELL
Si la bougie qui précède la bougie actuelle possède la LIGNE VERTICALE SELL,
utiliser le TP1 SIGNAL SELL comme cible, c'est-à-dire la TRENDLINE HORIZONTALE NON PERMANENTE SELL 1 (TP1) avec le NUMÉRO mis en évidence par la LIGNE VERTICALE SELL.
Calculer le volume de l'investissement en fonction de l'ampleur du mouvement, pour une valeur monétaire du mouvement, de 1% du capital.
Exemple dans les images.
Si le TP1 SIGNAL SELL disparaît avant d'avoir été touché par le prix, choisir si:
- changer de direction d'investissement en utilisant TP2 comme nouvel objectif
- interrompre la série et attendre un nouveau TP1 SIGNAL
- clôturer l'investissement
La gestion monétaire joue un rôle important, où l'investisseur a la possibilité de choisir si:
- récupérer la perte du TP1 SIGNAL SELL avec les TP suivants de cette bougie (TP2, TP3..)
- récupérer la perte du TP1 SIGNAL SELL avec le TP1 SIGNAL suivant
- subir la perte
________________________________________________________________________________________________________________________________________________
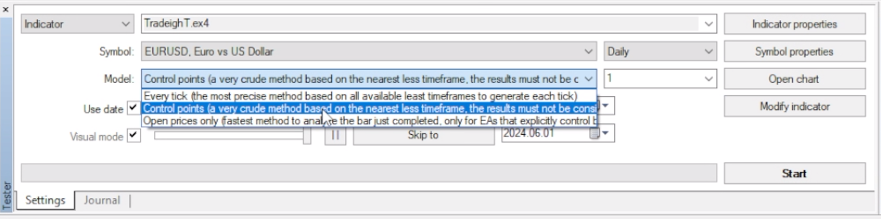
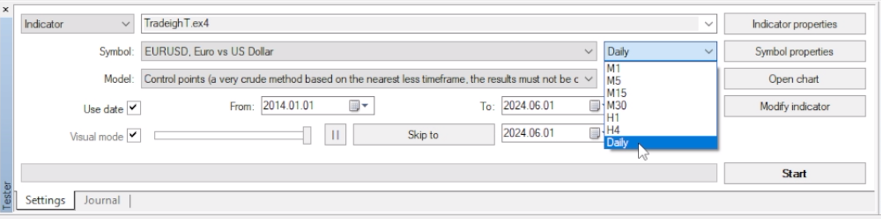
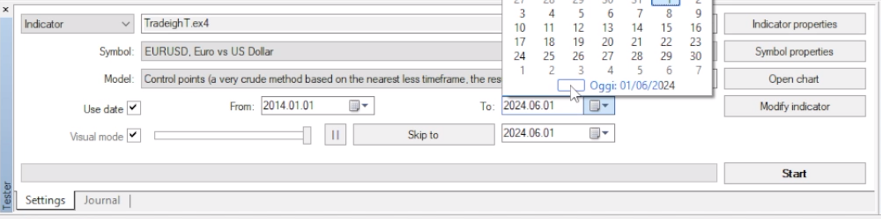
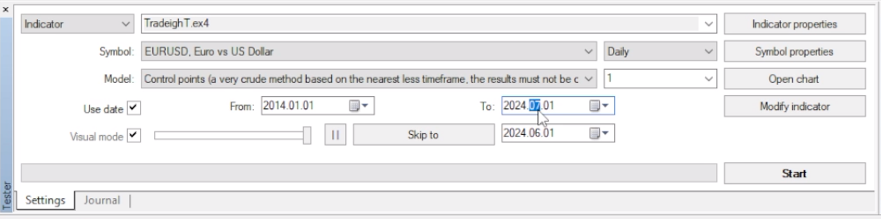
PARAMÈTRES
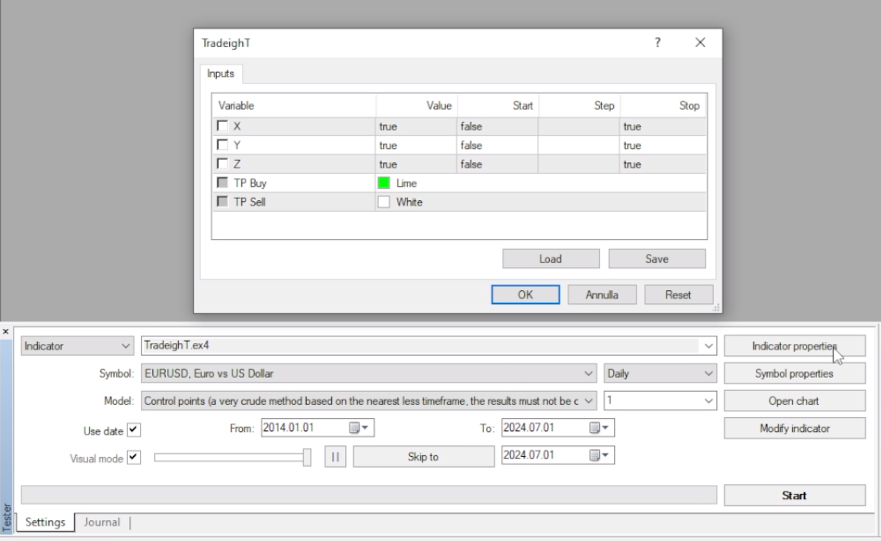
Possibilité d'activer et de désactiver des objets, avant le backtest à partir des PROPRIÉTÉ DE l'INDICATEUR, après et pendant le backtest avec les BOUTONS sur le graphique:
- X = TRENDLINE HORIZONTALES PERMANENTES
- Y = LIGNES VERTICALES
- Z = ZIGZAG
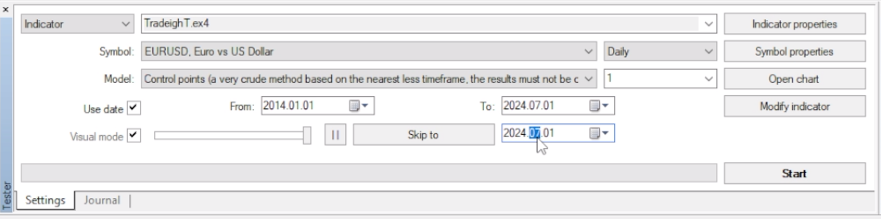
-(1)- Pour une analyse complète, utiliser comme date de début du backtest, 10 ans plus tôt que la date actuelle.
-(2)- Ajouter 1 mois à la date actuelle et utilisez-le comme date de fin du backtest.
-(3)- Pour accélérer le backtest cliquer sur SAUTER PAR-DESSUS, et entrer la date correspondante à la date de fin du backtest.
Consultez les images pour de plus amples détails.
________________________________________________________________________________________________________________________________________________
🛎️ https://t.me/tradeightrading
Demandez au groupe privé Telegram pour échanger des opinions et des analyses avec d’autres utilisateurs.
L'utilisateur n'a laissé aucun commentaire sur la note