Prometheus Trade Engine MT4
- Indicateurs
- Philip Muga
- Version: 1.0
- Activations: 5
Chart Features
1. Reversal Zone
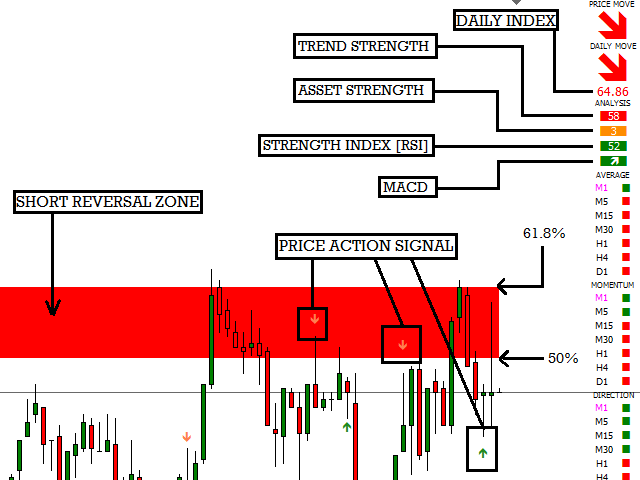
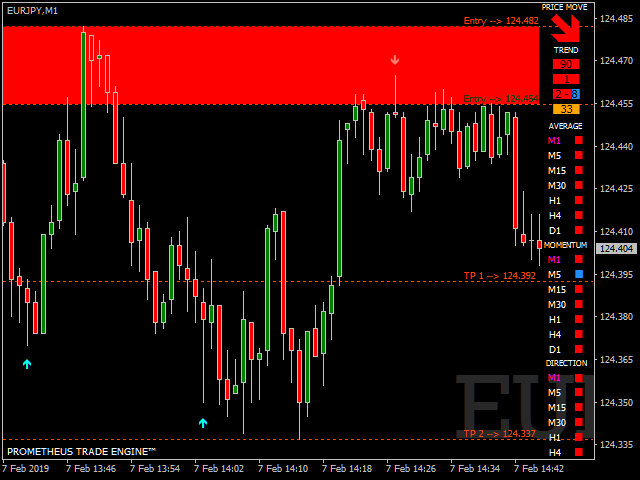
- It is the rectangular box on your chart which is based on a close approximation to 50% & 61.8% fibonacci retracement levels over the high-low period of 100 bars.
- By default, Blue rectangle is set to indicate that you are temporarily on a LONG trend with 50% above & 61.8% below;
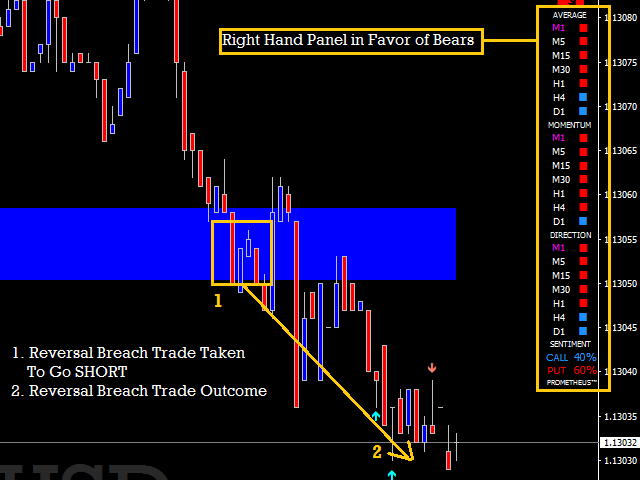
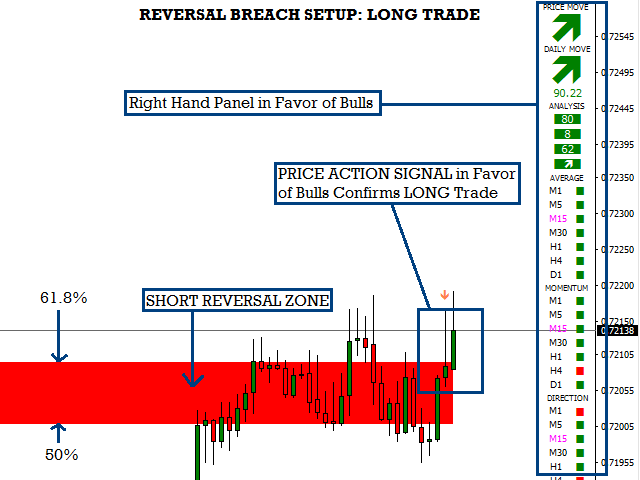
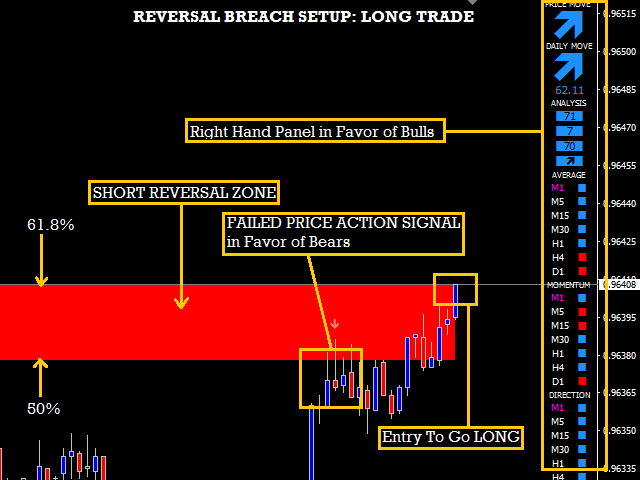
- Red rectangle is set to indicate that you are temporarily on a SHORT trend with 61.8% above & 50% below. It is drawn automatically so when the trend changes the tool redraws it automatically depending on your timeframe of choice.
- It gives you a level where bulls and bears battle it out on who will dominate future price moves
- When the Reversal Zone holds then price will bounce off that zone but when the Reveral Zone is breached it gives you a[leading]indication ahead of time that the current trend is MOST likely about to change so adjust your trading rational appropriately
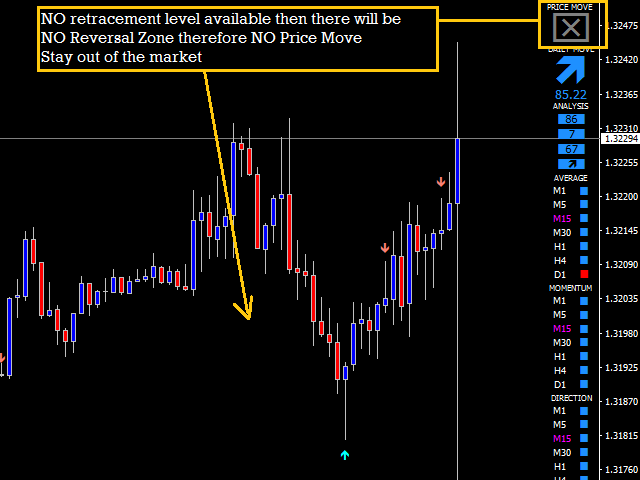
- When there is NO retracement level available then there will be NO Reversal Zone thus NO Price Move, so you stay out of the market
2. Price Action Signal
- It is the arrow displayed on a specific candle. These arrows are NOT buy/sell arrows but rather price action signals.
- It can be reversal signals or trend continuation signals, this will depend on where it appears on your chart. They DO NOT repaint
- Scenarion I: If you have a bullish arrow on a bullish candle then price is most likely going to shoot LONG;If its a bearish arrow on a bearish candle then price is most likely going to collapse SHORT.
- Scenarion II: If its a bullish arrow on a bearish candle then price is most likely going to move LONG momentarily before collapsing SHORT;If its a bearish arrow on a bullish candle the price is most likely going to move SHORT momentarily before shooting LONG
- DO NOT rely only on these signals but use them together with the other indicators to increase your probability for some signals will undoubtedly fail but if you use them with the rest of the indicators then you have an edge;
- You can even use a failed signal to your advantage
3. Price Move - It is based on where price is relative to the reversal zone; Above = bullish moves; Below = bearish moves
4. Daily Move - It is based on where price is relative to the daily open
5. Daily Index - It is based on current price relative to the open-high-low-close price of the daily candle; scale is 0 to 100 [0 = daily open & 100 = new high or new low]
The higher the value the further the price is to the open; The lower the value the closer price is to the open
6. Analysis
- Trend Strength - Displays the overall strength of the trend; Scale is 50 to 100 [50 = weak & 100 = strong]
- Asset Strength - Displays the strength of the asset; Scale is 0 to 9 [0 = weak & 9 = strong]
- Strength Index [RSI] - Displays the RSI level
- MACD - Displays whether the MACD is above or below zero
8. Momentum - Displays set momentum bullish or bearish across each time frame
9. Direction [ADX] - Displays set average directional movement index bullish or bearish across each timeframe
10. Market Sentiment - Displays the traders choice of market direction call or put
Parameters
Period Settings
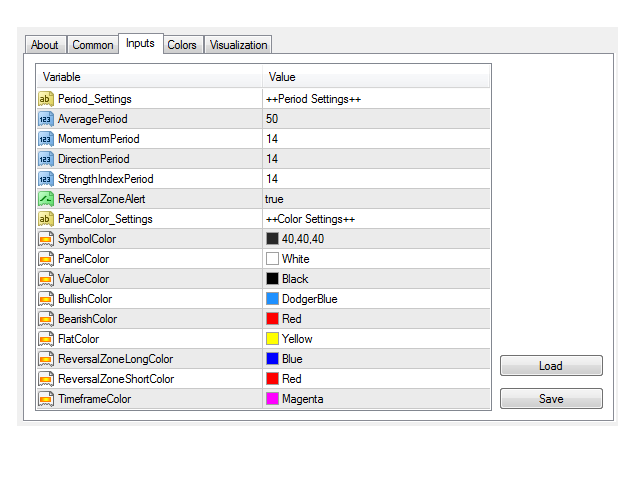
- Average Period - Set period for Moving Average, default set to 50 [Recommended]
- Momentum Period - Set period for Momentum, default set to 14 [Recommended]
- Direction Period - Set period for ADX, default set to 14 [Recommended]
- Stength Index Period - Set period for RSI, default set to 14 [Recommended]
- Reversal Zone Alert - Set alert screen pop-up message, default set to TRUE [Optional]
- Symbol Color - Set color symbol on your chart, set to [Black 40,40,40] for Blackboards [Default] & DarkGray for Whiteboards [Recommended]
- Panel Color - Set color for the right hand panel, set to White for Blackboards [Default] & DarkGray for Whiteboards [Recommended]
- Value Color - Set color for values on the Analysis Section, set to Black for Blackboards [Default] & White for Whiteboards [Recommended]
- Bullish Color - Set color for bullish indicator move, set to DodgerBlue for Blackboards [Default] & Green for Whiteboards [Recommended]
- Bearish Color - Set color for bearish indicator move, default set to Red for Blackboards & Whiteboards
- Flat Color - Set color for flat indicator move, set to Yellow for Blackboards [Default] & Gold for Whiteboards [Recommended]
- ReversalZoneLong Color - Set color for LONG Reversal Zone, set to Blue for Blackboards [Default] & Green for Whiteboards [Recommended]
- ReversalZoneShort Color - Set color for SHORT Reversal Zone, default set to Red for Blackboards & Whiteboards
- Timeframe Color - Set color of current chart timeframe, default set to Magenta for Blackboards & Whiteboards
Trade Setups
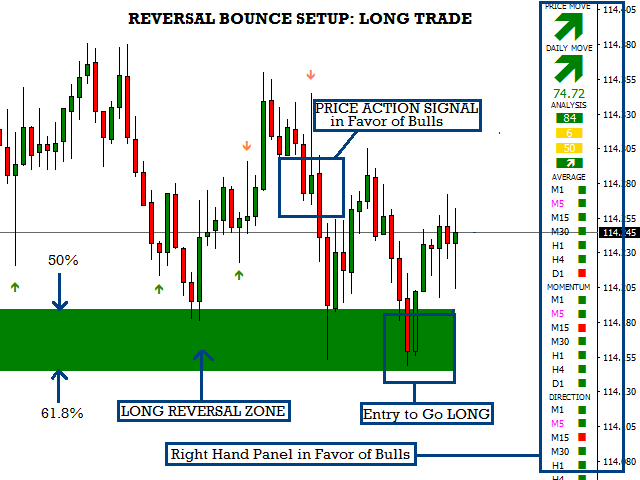
1. Reversal BounceTake a Reversal Bounce trade when price has bounced off the SHORT/LONG Reversal Zone based on HIGH PROBABILITY CONFLUENCE from Prometheus Trade Engine &
price action signal. Price MUST close INSIDE/BELOW the SHORT reversal zone for a PUT OR INSIDE/ABOVE the LONG reversal zone for a CALL.The closer the price
is to the Reversal Zone the better the entry
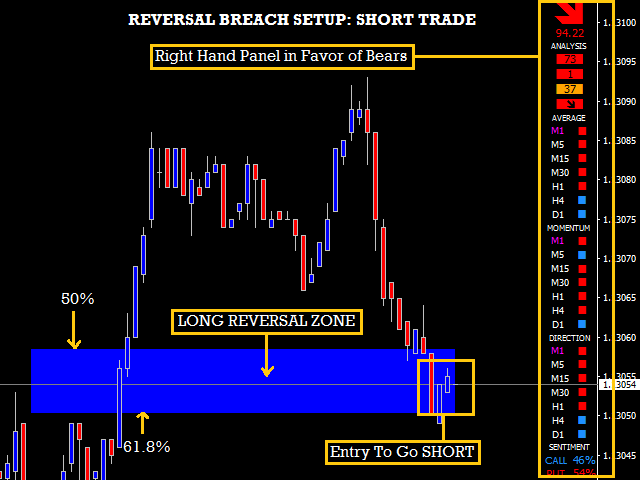
2. Reversal Breach
Take a Reversal Breach trade when price has breached through the SHORT/LONG Reversal Zone based on HIGH PROBABILITY CONFLUENCE from Prometheus Trade Engine &
price action signal. Price MUST close INSIDE/ABOVE the SHORT reversal zone for a CALL OR INSIDE/BELOW the LONG reversal zone for a PUT.The closer the price
is to the Reversal Zone the better the entry
Please share comments, ratings & reviews

