Forex Sniper Indicator
- Indicateurs
- Elias Mtwenge
- Version: 1.0
- Activations: 15
Dear Trader It is my pleasure to introduce to you my tool called the "Forex Sniper Indicator". The major aim of this tool is to help serious traders and investors in all type of Financial Markets to catch price next movement right at the moment the price direction is about to change. This tool can be used to snipe the price direction in both down trend, uptrend and ranging markets. This tool can be used as the stand alone tool though it may be combined with other tools as well.
My goal is to help both novice and experienced traders to find an edge over the market by providing them with reliable tools. All is needed is you to not miss a chance of trying this tool, learn it to master it, after you are very sure that you have mastered the tool then go ahead and invest with it wisely. I believe this tool may add value to your trading journey as long as you use it correctly as per instructions below.
How is this tool designed?
The design is simple, clean and color coded.
- This tool is designed to work in the separate window.
Inputs
- No complicated inputs
Components of the Indicator
- It has three lines all with meaningful uses.
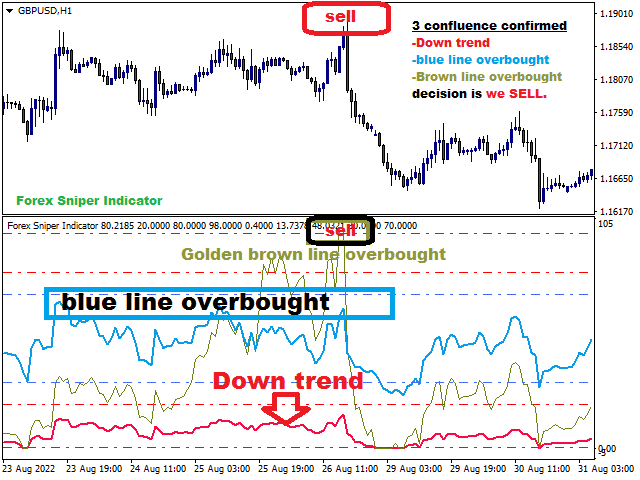
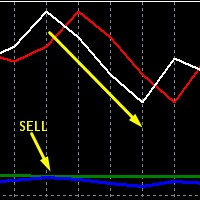
- There is a red line that will be used to analyse the direction of the trend.
- There is a blue line that will be used to analyse the overbought and oversold levels.
- There is a golden-brown color also for analyzing the overbought and oversold zones.
- There are red and blue dashed horizontal lines at the top and the bottom of the indicator to show the important key levels.
How we analyse the Trend direction (using the Red Line)
1. Uptrend
- We say that the pair is in uptrend when the red line is above the 20 level value (the upper horizontal line at the bottom) and it is pointing upward.
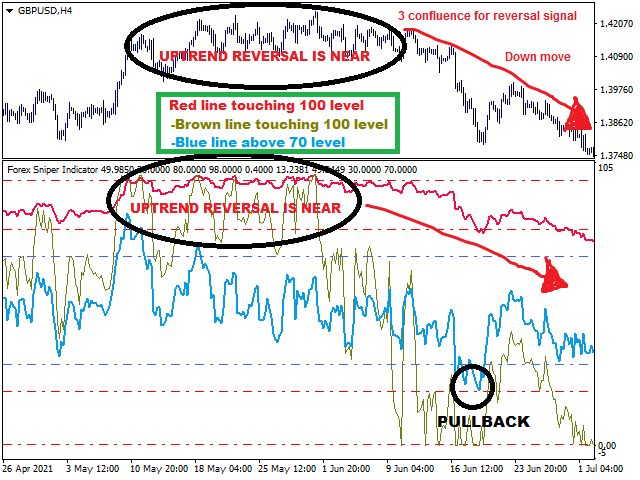
- We say that the pair has entered a very strong uptrend zone when the red line crosses above 80 level value (the lower red horizontal line at the top) and remain there for long time. In this zone the red line may remain flat or just going up and down without breaking below this level. This will be a very strong sign for strong uptrend. Some time when the red trend line fail and then break below the 80 level value (dotted line) a strong down move may happen. Sometime we expect the trend line to break below the 80 level and then come back to this level and just remain between the 80 and 100 levels as a sign of a strong bullish trend.
2. Down Trend
- We say that the pair is in downtrend when the red line is below the 80 level value (the lower horizontal line at the top) and it is pointing downward.
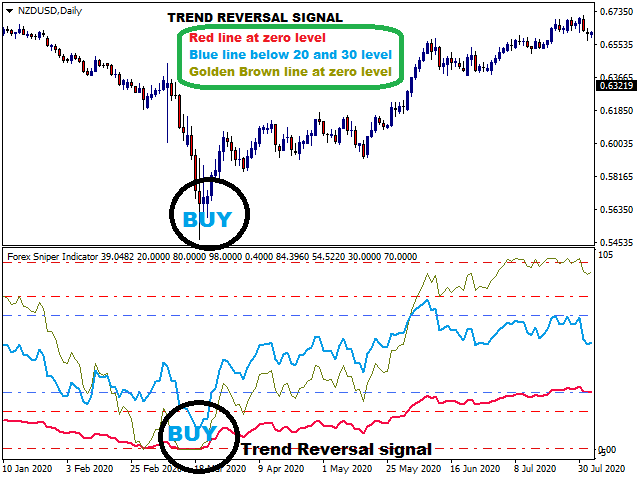
- We say that the pair has entered a very strong downtrend zone when the red line crosses below 20 level value (the upper red horizontal line at the bottom) and remain between the 20 and 0 level for long time. In this zone the red line may remain flat or just oscillate up and down without breaking above the 20 level. This will be a sign for a very strong downtrend. Sometime the red trend line break to above the 20 level and then fail and come back and remain below the 20 level and 0 level (dotted line). When the red trend line touches the 0 level it is strong sign that there is a possible trend reversal to the upside.
How we analyse the Overbought and Oversold zones
To analyse the Overbought and Oversold zones we use the golden brown and the blue line. Each line has its own use.
The Golden Brown Line
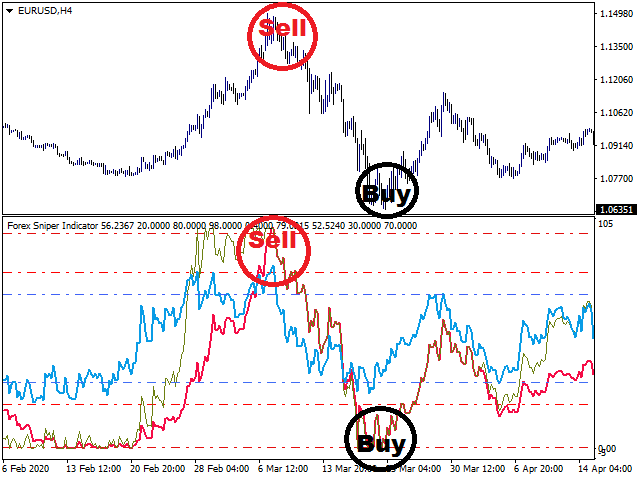
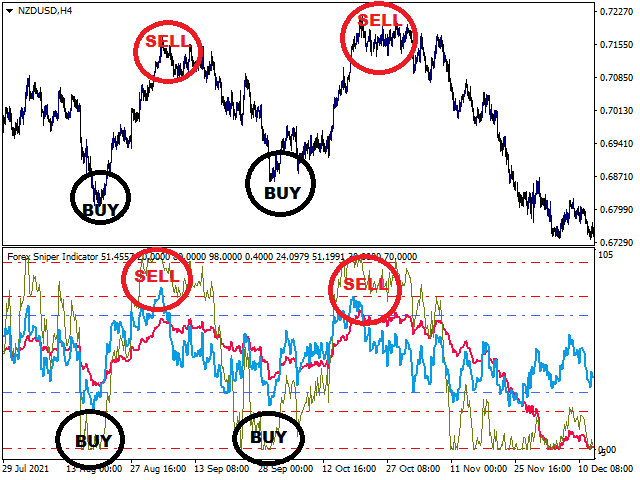
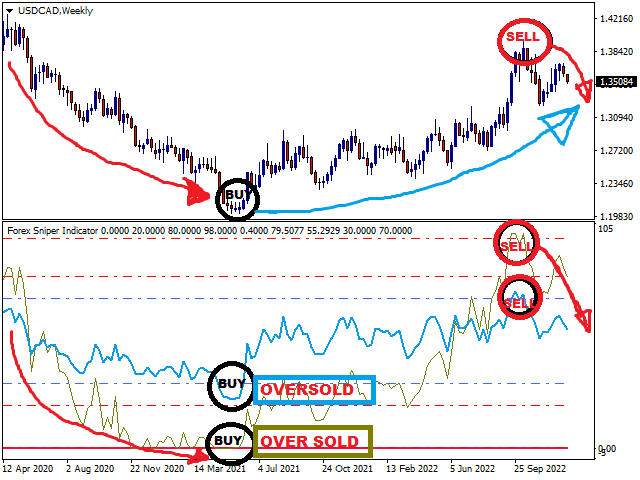
- This line should be used as the major signal line. When the trend is down trend and this golden brown line touches the 100 level at the top we look for selling opportunities for the price is extremely overbought.
- When the trend is uptrend and it touches the zero level at the bottom then we look for buy opportunities for the price is extremely oversold.
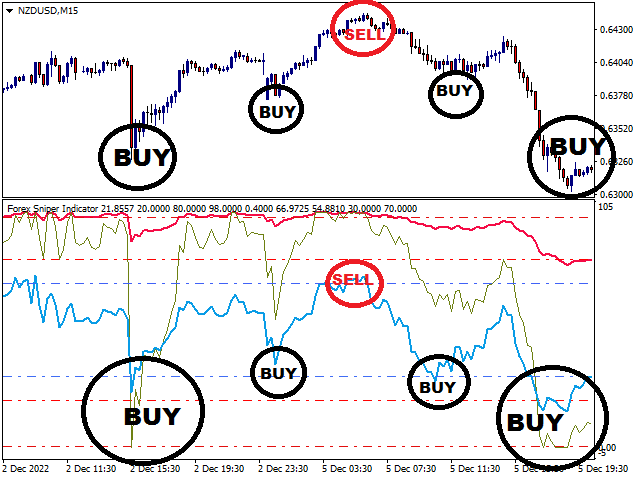
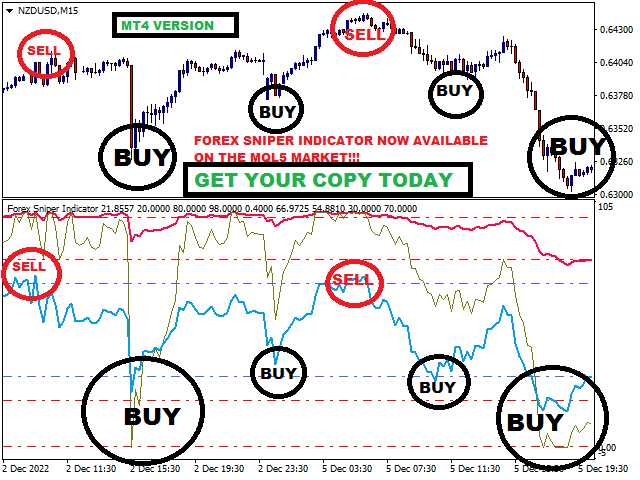
The blue line should be used as the minor oversold/overbought signal line. When this line is below 30 level we look for buy opportunities as price is oversold. If the blue line is above or very close to the 70 level we look for sell opportunities. This line is ideal for scalping strategy while the golden brown line is ideal for day trading or swing trading.
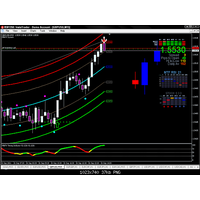
Note: Use all lines to analyse the trend, the overbought levels and make informed trades. Watch the screenshots for more information.
Disclaimer: No guaranteed results
Last word: Thank you for choosing my tools. I wish you all the best! Let me know if you need any help.

