ERXGen Filter
- Indicateurs
- Chima Nwokoro
- Version: 2.4
- Mise à jour: 26 novembre 2021
- Activations: 5
Without volatility, trading the financial market is close to impossible. Profit is made ONLY when the price is moving. The ERXGen (Early Riser Next Generation) system is a short-term trading technique built around the phenomenon that there are certain times during a trading day when the price volatility has the tendency to be high. In essence, ERXGen is based on the very popular London Open Breakout strategy, although with bespoke tried and tested rules that increase consistency and profitability.
Price action during the Tokyo trading session is used to determine entry conditions. Buy or Sell trades are taken mostly during the London Trading session.
The three key rules are:
- Intra-week trend
- Tight Tokyo Range (gap between high and low price during the Tokyo session)
- Location of the Tokyo Range (price action during the Tokyo session must happen either at the top or bottom of the previous day's range)
Parameters
- Enter GMT Correction Hours – difference, in hours, between MT4 platform time and GMT.
- Enter Number of Tokyo Hours to monitor – number of hours during the Tokyo session to be used to monitor price action. Usually set to six.
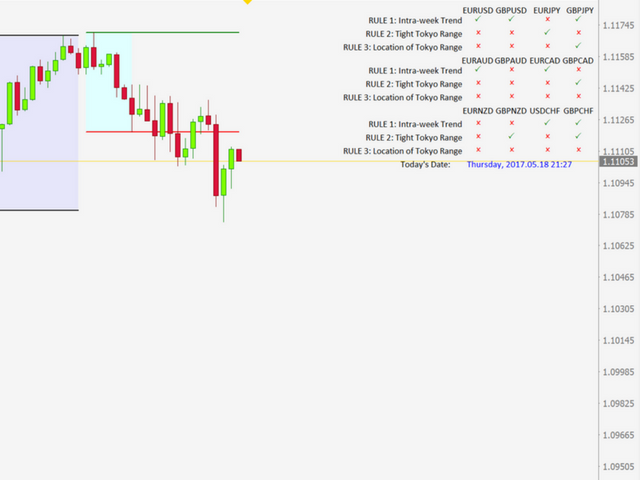
- HeadingColour – color of the matrix text title, see the images below.
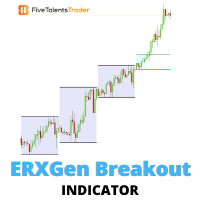
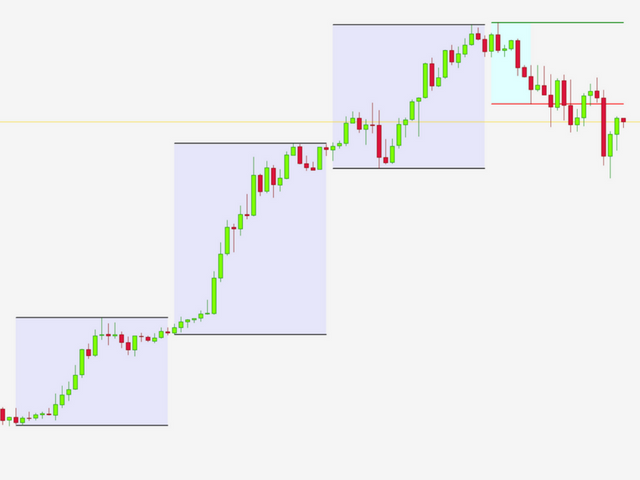
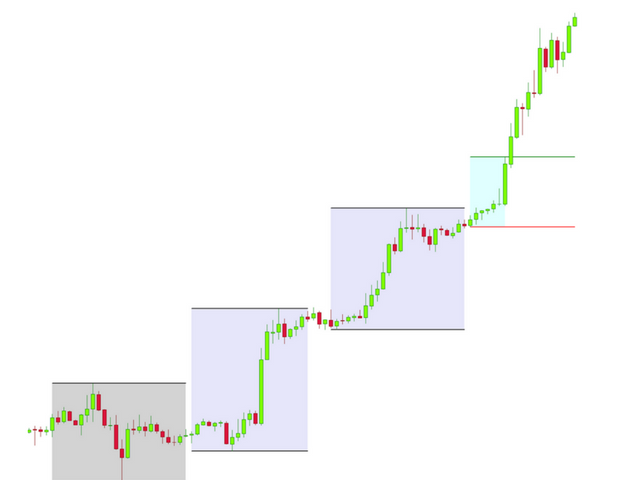
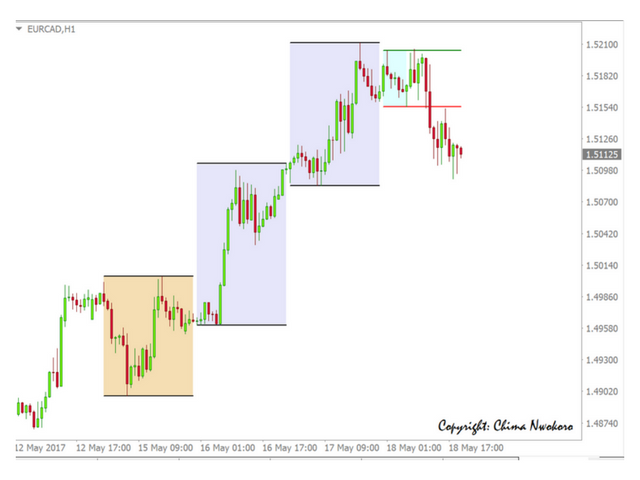
- ShowLOB – images (if TRUE, there is a visual display of three previous days and the current day price action. Three previous days are shown in boxes of different colors depending on whether they were up or down days. The current day price action shows two sets of lines. The red line indicates low price during Tokyo session and the green line indicates the highest price during the Tokyo session. Objects are displayed only on PERIOD_H1 and PERIOD_M15).
- ShowSignalMatrix – if TRUE, this displays the three key rules for 12 currency pairs. Ticks or crosses indicate if the rules are met or not. This option is the unique advantage of the ERXGen Filter. It cuts down multiple chart analysis time. All analysis can be completed in less than a minute vs. hours of individually analyzing each pair.
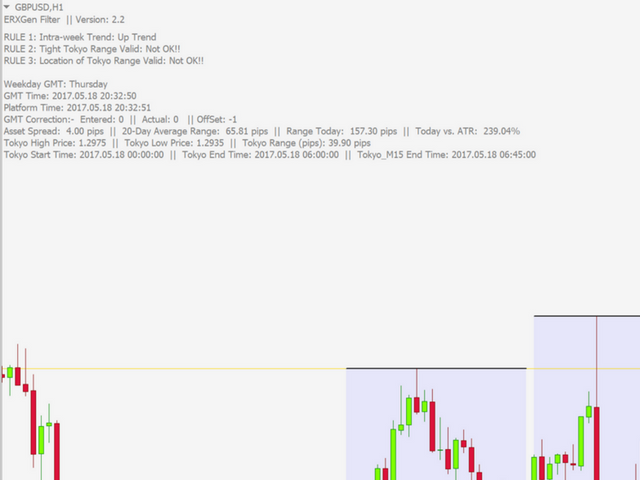
- ShowComments – if TRUE, this displays comments on the chart showing information to support decisions, e.g. current indicator version, Weekday, Tokyo High Price, Tokyo Low Price, actual GMT and correction hours entered, etc.
See the screenshots and the video below for further details.






L'utilisateur n'a laissé aucun commentaire sur la note