SecondsOfMinute
- Indicateurs
- Lorenzo Marchesin
- Version: 1.0
It is the simplest indicator in existence.
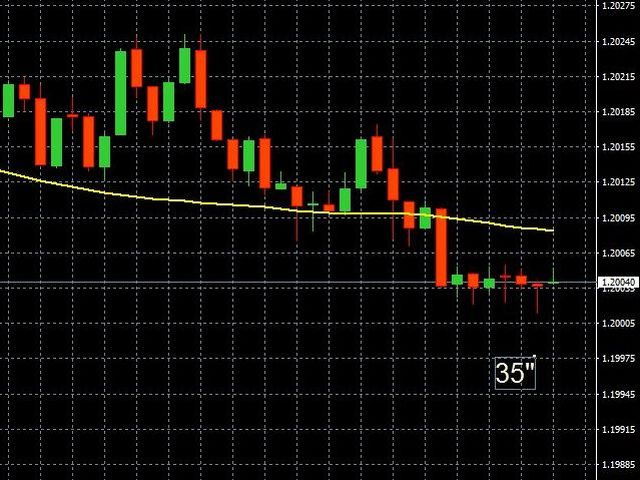
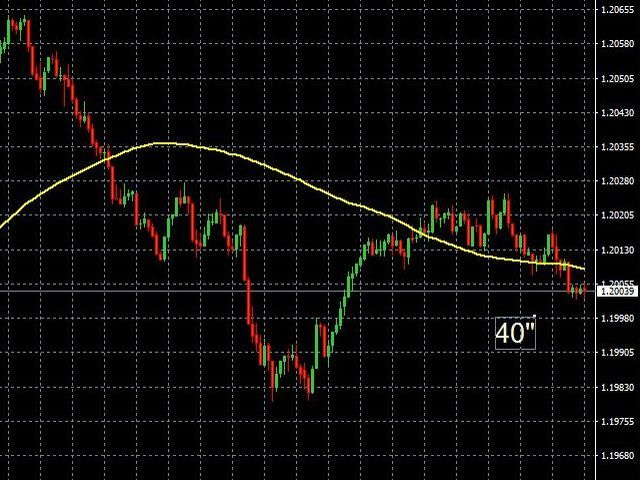
It has only one function: report the seconds elapsed since the last minute end in a very convenient way, with a label that can be moved in the chart, so that the trader does not have to take his eye off the forming candle.
It is used on M1, but also on larger intervals, for those interested in opening/closing positions at the best time.
Sometimes an intense movement in the last 10" of the minute gives indications of future trend, and can be used for scalping.
Often the movement that occurs in the first 15" has no predictive value. With this label we can avoid being fooled by this behavior.
Recommended for scalpers, but also useful for those who want to catch the best time to act.
Try to follow the behavior of the candle by having an eye on the seconds and you will quickly understand its usefulness. Useful for symbols that have rapid fluctuations as gpb and indexes.