IconTrade
- Indicateurs
- Vadim Gorodetskii
- Version: 2.1
- Activations: 20
Place the indicator on the chart, preferably with a timeframe of H1 or H4. If you are trading in the daily range or, conversely, on lower timeframes, you will need to adjust the RSI and ATR levels accordingly.
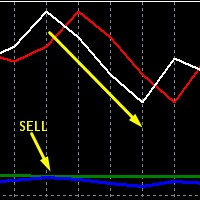
The blue arrows of the indicator will be a signal to open a long position, the red arrows will be a signal to open a short position:
1) Blue arrow for longs (growth) and red arrow for shorts (decline).
2) Two horizontal lines for current positions (one for entry and one for stop).
3) If you have placed an order, and the second blue or red arrow in a row indicates entry into the market, then the position is increased when this second arrow appears.
4) Close one lot when a yellow (green) plane appears, close the next one when an arrow of the opposite color appears.
As soon as you see the blue or red arrow opposite your entry, close all orders in this direction and start opening the opposite ones.
There are also signal notifications, a pop-up window


