• Aperçu
  • Avis (9)
  • Commentaires (11)

Visual Bollinger Bands Divergence

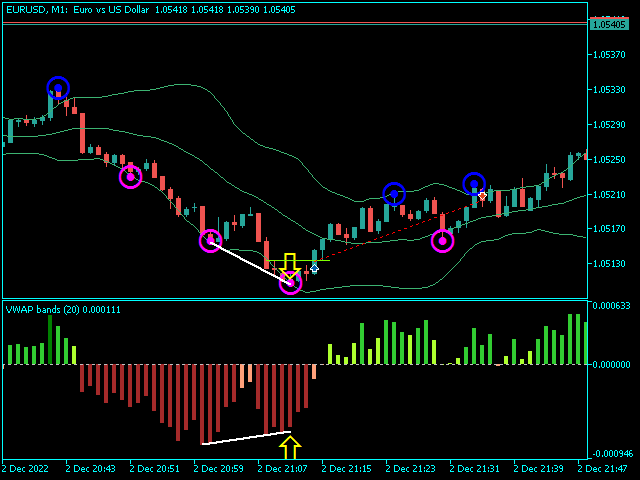
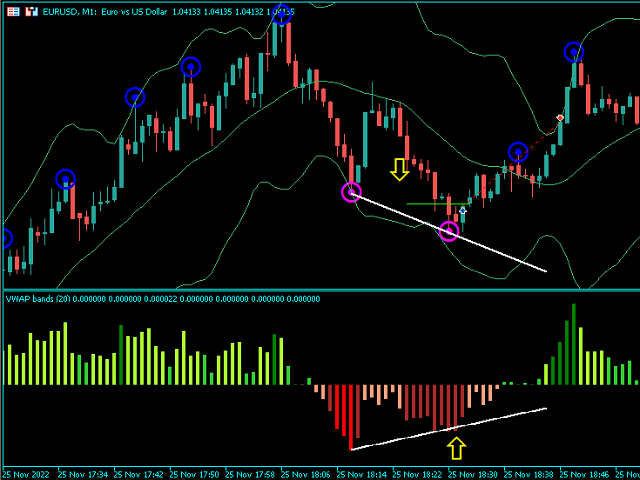
Bandes VWAP Style visuel 1.0

Les indicateurs des marchés financiers sont des outils essentiels utilisés par les commerçants et les investisseurs pour analyser et prendre des décisions sur les marchés financiers. Le VWAP et les bandes de Bollinger sont deux outils d'analyse technique populaires utilisés par les traders pour mesurer les tendances du marché et la volatilité des prix. Dans ce produit, nous proposons de combiner les deux indicateurs pour créer un produit unique qui fournit une analyse complète des tendances et de la volatilité du marché. Ce produit sera idéal pour les traders et les investisseurs qui souhaitent prendre des décisions éclairées basées sur une analyse basée sur les données.

La stratégie de divergence est une technique d'analyse technique populaire utilisée par les traders pour identifier les inversions de tendance potentielles sur le marché. La stratégie repose sur l'identification des divergences entre les mouvements de prix et les indicateurs techniques. Dans cette section, nous décrirons la stratégie de divergence en utilisant le style visuel et les bandes de Bollinger.

La stratégie de divergence utilisant le style visuel et les bandes de Bollinger, par exemple, est une technique d'analyse technique populaire utilisée par les traders pour identifier les inversions de tendance potentielles sur le marché. La stratégie repose sur l'identification des divergences entre le RSI et l'action des prix du titre. En utilisant cette stratégie, les traders peuvent prendre des décisions éclairées basées sur une analyse basée sur les données, conduisant à des transactions et des investissements plus rentables.
Produits recommandés
This indicator is an extended implementation of Weis waves. It builds Weis waves on absolute volumes (which is the classical approach) or delta of volumes (unique feature) using different methods of wave formation and visualization. It works with real volumes, if available, or with tick volumes otherwise, but also provides an option to use so called "true volume surrogates", as an artificial substitution for missing real volumes (for example, for Forex symbols), which was introduced in correspo
Harmonic Patterns of Tony
Jhon Michael Antony Florez Roa
Discover the power of harmony in the markets with this advanced harmonic pattern indicator. Designed for demanding technical traders, this indicator automatically detects 11 of the most popular harmonic patterns, including the Gartley, Bat, Crab, Butterfly, Shark, Cypher, and many more. Thanks to its dynamic dashboard, you can easily manage the visibility of patterns on the chart, activating or deactivating the ones you want in real time without overloading your platform. This flexibility allo
FREE
Here I present you this awesome indicator I made. This is a nique combination witch puts you in the same level as MM's. So you can surf a lot of waves and identify the rally time, breakouts, and the perfect time to get in the market. ---- The SSL Channel is a great all-rounder based on 2 Simple Moving Averages, one of recent Highs, one of recent Lows. The calculation prints a   channel   on the chart consisting of 2 lines. This strategy gives a Long signal when price closes above the top of thes
WAPV Weis Wave Chart Forex
Eduardo Da Costa Custodio Santos
Le Weis Wave Chart Forex pour MT5 est un indicateur de prix et de volume. La lecture du prix et du volume a été largement diffusée par Richard Demille Wyckoff sur la base des trois lois qu'il a créées : l'offre et la demande, la cause et l'effet et l'effort contre le résultat. En 1900 R.Wyckoff utilisait déjà le wave chart dans ses analyses. De nombreuses années plus tard, vers 1990, David Weis a automatisé le diagramme d'onde de R. Wyckoff et aujourd'hui nous vous apportons l'évolution du diagr
MultiSymbolsWpr Indice x IBOV
Israel Goncalves Moraes De Souza
O Indicador identifica relação do Índice com a soma dos principais ativos, funciona para qualquer mercado do mund o, possui um oscilador WPR com a soma dos principais ativos escolhidos, indicando a antecipação do movimento em relação ao Índice. Características WPR com a soma dos papéis escolhidos - branco WPR do papel atual - vermelho Canal de Tendência O indicador pode indicar movimento de entradas, sendo: cruzamento das linhas cruzamento da linha Multi Symbols no -50 cruzamento entre os canai
FREE
An anchored Vwap With Arrows is an indicator that includes a moving average weighted by volume that allows you to plot on a bottom or a top. Usually banks and institutions measure an average price, this average price is a price range where they agree to make a trade. Using the logic of anchored vwap with arrows it is possible to understand that if the price breaks the vwap it means that someone with enough buying and selling power has lost control. You can use vwap anchored with arrows in any ti
Market Fractal Analysis, Fractal Swing, Market Flow Fractal Cycles looks for Similar Patterns in the Market that repeat themselves because of the Market Fractal Nature. These patterns are displayed with help of Graphical Objects and Alerts can be received on their arrival. Read the   Blog   for full information. Features:- Auto Detection of Patterns Customization for Color and Line Styles Alerts, Emails & Push Notifications
Watermark Centralized
Ronnie Ferreira Silva
3.67 (3)
Filigrane centralisé Ajoute un filigrane centré avec le nom de l'actif et la période choisie. Il est possible de remplacer le type de police, la taille de police, la couleur de police et le caractère de séparation. Le filigrane est positionné derrière les bougies, ne perturbant pas la visualisation. Il a un recentrage automatique si la fenêtre est redimensionnée. J'espère que cet indicateur vous aidera, bon trading ;)
FREE
Functional in the Forex market. Functional in the B3 market - Bolsa Brasil Balcão. Motivation The technical Fibonacci retraction indicator for many is essential and the basis for all market movement forecasts. The name of the tool comes from the Italian mathematician Leonardo de Pisa (13th century). This DEMO version will work in Meta Trader with Demo and Strategy Tester. To purchase the Full version that works on a Real account, click on: https://www.mql5.com/en/market/product/38089 Opera
FREE
ArcTracer
Syed Oarasul Islam
This Indicator draws Fibonacci Arc levels in two different ways. You can select whether to draw Fibonacci Arc levels based on your favourite ZigZag settings or you can let the indicator to draw Arc levels based on given number of bars or candles.  You can also set Mobile and Email notification for your favourite Arc levels individually. With this indicator you will not have to feel lonely as the it can generate Voice alerts, which will keep you focused on your trading and remove boredom.  Produc
Add an image or logo on a chart. Parameters: "File name for On mode" - location of image file depending MQL5 folder. "Background object" - set the logo as a background object. “x”, “y” – coordinates on the chart, from which the logo shows.   If you want to delete the logo, just remove ea from the chart. The suggested resolution for the image is 200x200 pixels.   You can use this ea while recording a video.
Cet indicateur vous permet d'afficher les étiquettes des niveaux de Fibonacci avec une grande taille de police . Il prend en charge jusqu'à 25 niveaux de Fibonacci - Dès que vous dessinez Fibonacci, il affiche les niveaux que vous avez ajoutés comme paramètre d'entrée avec une grande taille de police avec la couleur et la police que vous choisissez. Options personnalisables : 1. Police de texte Fibo 2. Taille du texte Fibo 3. Couleur du texte Fibo 3. Ajoutez une description à chaque nivea
Description The indicator uses market profile theory to show the most relevant trading zones, on a daily basis. The zones to be shown are LVN (low volume nodes) and POC (point of control). An LVN zone is one which represents price areas with the least time or volume throughout the day. Typically, these areas indicate a supply or demand initiative, and in the future, they can turn into important breakout or retracement zones. A POC zone is one which represents price areas with the most time or vo
r  qa*f 3214-* 85qa 812-3 ** fa- 143r- af- /1-q3*2 f*//* 23/-*rfa //*f-/s d - /-1 2/*32rf a-* /zfxv-* /wqr31q2 e8fva- f91 4-qr3f v6*a9-1 rfas 85/aw e/fs/-f+ 1*-rfra+sr5-*q+w/a ef-* 1244-erfv a5-wrtf4 2*-5 + f3sd- 8r321q8-f 8/a-,23q*+8rf /aw- 2413qr-f 5-1*r  sz/a aw3 favxz-3-/*-  2-3qrf/aw*3* afsdvx *23qref qwad5*-8 352*-fa8 5-813/ -rfa s8-fsdc x 858 3 8-23 q-r5we*f-a 53qr-
Mean Reversion Supply Demand Indicator Mean Reversion Supply Demand is the indicator to detect the important supply demand zone in your chart. The concept of supply demand trading relies on the quantity mismatching between buying and selling volumes in the financial market. Typically, supply demand zone serves to predict the turning point. The wave pattern, for any supply demand zone to work as an successful trade, looks like the price must touch the base zone, move away and then return to zone
The Penta-O is a 6-point retracement harmonacci pattern which usually precedes big market movements. Penta-O patterns can expand and repaint quite a bit. To make things easier this indicator implements a twist: it waits for a donchian breakout in the right direction before signaling the trade. The end result is an otherwise repainting indicator with a very reliable trading signal. The donchian breakout period is entered as an input. [ Installation Guide | Update Guide | Troubleshooting | FAQ | A
Harmonic Patterns Osw MT5
William Oswaldo Mayorga Urduy
MOTIFS HARMONIQUES OSW MT5 Cet indicateur est chargé de détecter les motifs harmoniques afin que vous puissiez les opérer, vous donnant un signal afin que vous puissiez ajouter une analyse manuelle si vous prenez la commande ou non. Parmi les motifs harmoniques détectés par l'indicateur figurent : >gartley > chauve-souris >Papillon > crabe >Requin Parmi les fonctions que vous pouvez trouver sont : >Générer des alertes par courrier, mobile et PC > Changez les couleurs des harmoniques,
FibExtender
Syed Oarasul Islam
This Indicator draws Fibonacci Extension levels in two different ways. You can select whether to draw Fibonacci Extension levels based on your favourite ZigZag settings or you can let the indicator to draw Fibonacci Extension  level based on given number of Bars or Candles.  You can also set Mobile and Email notification for your favourite Extension  levels individually. With this indicator you will not have to feel lonely as the it can generate Voice alerts, which will keep you focused on your
L'indicateur SMC Venom Model BPR est un outil professionnel pour les traders travaillant dans le concept Smart Money (SMC). Il identifie automatiquement deux modèles clés sur le graphique des prix: FVG   (Fair Value Gap) est une combinaison de trois bougies, dans laquelle il y a un écart entre la première et la troisième bougie. Forme une zone entre les niveaux où il n'y a pas de support de volume, ce qui conduit souvent à une correction des prix. BPR   (Balanced Price Range) est une combinaiso
FabFlowInPrice
Fabiano Luiz Roberto
Tape Reading, flow monitoring. FabFlowInPrice   is a powerful indicator for those who like Tape Reading (Times & Trades). It presents the volumes traded at each price level, considering the purchase, sale and direct aggressions for each level. Excellent tool for market flow analysis. Thought of flow so monitor who is attacking the most, buyers, sellers or direct exchanges, thought FabFlowInPrice. The indicator displays information in 4 distinct and fixed periods, on any timeframe: @Day - All t
Mt5 Market Profile
Mcblastus Gicharu Ndiba
Market Profile Introducing the Market Profile MetaTrader Indicator—your gateway to mastering market dynamics with precision and insight. This powerful tool delivers a classic Market Profile analysis, revealing price density over time and highlighting crucial levels, including the value area and control value for any trading session.  Compatible with timeframes from M1 to D1, it adapts to daily, weekly, monthly, or even intraday sessions, offering you unmatched flexibility. Lower timeframes prov
Historical Memory
Marat Sultanov
3.33 (3)
Indicator-forecaster. Very useful as an assistant, acts as a key point to forecast the future price movement. The forecast is made using the method of searching the most similar part in the history (pattern). The indicator is drawn as a line that shows the result of change of the close price of bars. The depth of history, the number of bars in the forecast, the patter size and the quality of search can be adjusted via the indicator settings. Settings: PATTERN_Accuracy_ - quality of the search.
FREE
Simple Candle Countdown
Emanuel Cavalcante Amorim Filho
Simple candle countdown - never again miss how much time is left to open a new bar! This indicator doesn't plot any line on the chart - it uses only objects and calculates the time left to open a new bar. You can set custom colors for the panel background and border and for the text color. Simple as that, the indicator is ready to use. If you find any bugs, feel free to contact me. 
FREE
Seconds Candle Period
Fernando Lahude Ritter
5 (1)
This is an extension indicator that allows the user to select any second time-frame from 1 to 60 second without any multiplier limitaion (ex, 7 seconds, 13 seconds ... are all allowed).  There is only one input called Interval that allows you to set the seconds timeframe you want given is in the range above. You can use indicators on that new time frame with no problems and also build your EAs based on any second timeframe. I hope this is useful, please let me know any bugs you find! Note: Since
FREE
Fibo Harmonic Levels Indicator  Overview The   Fibo Harmonic Levels   indicator is a powerful MetaTrader 5 (MT5) tool designed to automatically plot harmonic Fibonacci-based support and resistance levels on your chart. These levels and can be applied to different timeframes (Daily, Weekly, Monthly) either automatically or manually. The indicator also includes an   alert system   that notifies traders when price touches or crosses any harmonic level, with configurable pause intervals to prevent
To get access to MT4 version please click here . This is the exact conversion from TradingView: "[SHK] Schaff Trend Cycle (STC)" by "shayankm". This is a light-load processing indicator. This is a non-repaint indicator. Buffers are available for processing in EAs. All input fields are available. You can message in private chat for further changes you need. Thanks for downloading
Keltner Channel Indicator for MetaTrader 5 - Precision in Every Trade Unlock precision in your trading with the "Keltner Channel Indicator" tailored for MetaTrader 5. This powerful tool, based on Chester Keltner's work, offers you unparalleled insights into price volatility, helping you make well-informed trading decisions. Basic Details : Indicator Type : Keltner Channel Indicator for MetaTrader 5 Key Metrics : Real-time analysis of price volatility and trend identification. Customization : Ful
Best SAR MT5
Ashkan Hazegh Nikrou
4.33 (3)
La description :  nous sommes heureux de vous présenter notre nouvel indicateur gratuit basé sur l'un des indicateurs professionnels et populaires du marché des changes (PSAR). Cet indicateur est une nouvelle modification de l'indicateur SAR parabolique original. Dans l'indicateur pro SAR, vous pouvez voir un croisement entre les points et le graphique des prix. le croisement n'est pas un signal mais parle du potentiel de fin de mouvement, vous pouvez commencer à acheter par un nouveau point b
FREE
Trade smarter, not harder: Empower your trading with Harmonacci Patterns This is arguably the most complete harmonic price formation auto-recognition indicator you can find for the MetaTrader Platform. It detects 19 different patterns, takes fibonacci projections as seriously as you do, displays the Potential Reversal Zone (PRZ) and finds suitable stop-loss and take-profit levels. [ Installation Guide | Update Guide | Troubleshooting | FAQ | All Products ] It detects 19 different harmonic pri
Introducing the B4S BidLine CandleTimer An insightful indicator that combines real-time bid line visualization with a dynamic countdown timer. Gain a competitive edge in your trading as you stay informed about the time remaining until the next candle starts, all displayed seamlessly on your chart. Why B4S BidLine CandleTimer? Unleash the potential of your trading strategy with the B4S BidLine CandleTimer. Here's why this indicator stands out: Real-Time Bid Line: Witness market movements like nev
Les acheteurs de ce produit ont également acheté
Trend Screener Pro MT5
STE S.S.COMPANY
4.85 (82)
Indicateur de tendance, solution unique révolutionnaire pour le trading et le filtrage des tendances avec toutes les fonctionnalités de tendance importantes intégrées dans un seul outil ! Il s'agit d'un indicateur multi-période et multi-devises 100 % non repeint qui peut être utilisé sur tous les symboles/instruments : forex, matières premières, crypto-monnaies, indices et actions. Trend Screener est un indicateur de suivi de tendance efficace qui fournit des signaux de tendance fléchés avec des
Divergence Bomber
Ihor Otkydach
5 (4)
Chaque acheteur de cet indicateur reçoit également gratuitement : L’outil exclusif « Bomber Utility », qui accompagne automatiquement chaque opération de trading, fixe les niveaux de Stop Loss et de Take Profit, et clôture les positions selon les règles de la stratégie Des fichiers de configuration (set files) pour adapter l’indicateur à différents actifs Des set files pour configurer le Bomber Utility selon différents modes : « Risque Minimum », « Risque Équilibré » et « Stratégie d’Attente » U
Algo Pumping
Ihor Otkydach
5 (11)
PUMPING STATION – Votre stratégie personnelle «tout compris» Nous vous présentons PUMPING STATION – un indicateur Forex révolutionnaire qui transformera votre façon de trader en une expérience à la fois efficace et passionnante. Ce n’est pas seulement un assistant, mais un véritable système de trading complet, doté d’algorithmes puissants pour vous aider à trader de manière plus stable. En achetant ce produit, vous recevez GRATUITEMENT : Fichiers de configuration exclusifs : pour un réglage auto
Golden Trend Indicator MT5
Noha Mohamed Fathy Younes Badr
4.89 (18)
Golden Trend indicator  is The best indicator for predicting trend movement this indicator never lags and never repaints and never back paints    and give  arrow buy and sell    before the candle appear  and it will help you and  will make your trading decisions clearer its work on all currencies and  gold and crypto and all time frame This unique  indicator uses very secret algorithms to catch the  trends, so you can trade using this indicator and see the trend clear on charts  manual guide and
TPSproTREND PrO MT5
Roman Podpora
4.72 (18)
VERSION MT4        —        ИНСТРУКЦИЯ RUS           —        INSTRUCTIONS  ENG Fonctions principales : Signaux d'entrée précis SANS RENDU ! Si un signal apparaît, il reste d’actualité ! Il s'agit d'une différence importante par rapport aux indicateurs de redessinage, qui peuvent fournir un signal puis le modifier, ce qui peut entraîner une perte de fonds en dépôt. Vous pouvez désormais entrer sur le marché avec plus de probabilité et de précision. Il existe également une fonction de coloration
TPSpro RFI Levels MT5
Roman Podpora
4.55 (20)
Zones de retournement / Volumes de pointe / Zones actives d'un acteur majeur =       SYSTÈME TS TPSPRO INSTRUCTIONS RUS       /       INSTRUCTIONS       FR       /           Version MT4        Chaque acheteur de cet indicateur reçoit en plus GRATUITEMENT : 6 mois d'accès aux signaux de trading du service RFI SIGNALS - points d'entrée prêts à l'emploi selon l'algorithme TPSproSYSTEM. Supports de formation avec mises à jour régulières - plongez-vous dans la stratégie et développez votre niveau p
Gold Stuff mt5
Vasiliy Strukov
4.93 (179)
Gold Stuff mt5 est un indicateur de tendance conçu spécifiquement pour l'or et peut également être utilisé sur n'importe quel instrument financier. L'indicateur ne se redessine pas et ne traîne pas. Délai recommandé H1. Contactez-moi immédiatement après l'achat pour obtenir les réglages et un bonus personnel !   Vous pouvez obtenir une copie gratuite de notre indicateur Strong Support et Trend Scanner, veuillez envoyer un message privé. moi!   RÉGLAGES Dessiner la flèche - on off. dessiner d
Support And Resistance Screener est dans un indicateur de niveau pour MetaTrader qui fournit plusieurs outils à l'intérieur d'un indicateur. Les outils disponibles sont : 1. Filtre de structure de marché. 2. Zone de repli haussier. 3. Zone de recul baissier. 4. Points pivots quotidiens 5. points pivots hebdomadaires 6. Points pivots mensuels 7. Support et résistance forts basés sur le modèle harmonique et le volume. 8. Zones au niveau de la banque. OFFRE D'UNE DURÉE LIMITÉE : L'indicateur de sup
RelicusRoad Pro MT5
Relicus LLC
4.79 (19)
Maintenant 147 $ (augmentant à 499 $ après quelques mises à jour) - Comptes illimités (PCS ou Mac) Manuel d'utilisation RelicusRoad + Vidéos de formation + Accès au groupe Discord privé + Statut VIP UNE NOUVELLE FAÇON DE REGARDER LE MARCHÉ RelicusRoad est l'indicateur de trading le plus puissant au monde pour le forex, les contrats à terme, les crypto-monnaies, les actions et les indices, offrant aux traders toutes les informations et tous les outils dont ils ont besoin pour rester rentables
Quantum TrendPulse
Bogdan Ion Puscasu
5 (13)
Présentation de   Quantum TrendPulse   , l'outil de trading ultime qui combine la puissance de   SuperTrend   ,   RSI   et   Stochastic   dans un seul indicateur complet pour maximiser votre potentiel de trading. Conçu pour les traders qui recherchent précision et efficacité, cet indicateur vous aide à identifier les tendances du marché, les changements de dynamique et les points d'entrée et de sortie optimaux en toute confiance. Caractéristiques principales : Intégration SuperTrend :   suivez f
Matrix Arrow Indicator MT5
Juvenille Emperor Limited
5 (13)
Matrix Arrow Indicator MT5   est une tendance unique 10 en 1 suivant un indicateur multi-période   100% non repeint   qui peut être utilisé sur tous les symboles/instruments:   forex ,   matières premières ,   crypto-monnaies ,   indices ,  actions .  Matrix Arrow Indicator MT5  déterminera la tendance actuelle à ses débuts, en rassemblant des informations et des données à partir d'un maximum de 10 indicateurs standard, qui sont: Indice de mouvement directionnel moyen (ADX) Indice de canal de m
FX Power MT5 NG
Daniel Stein
5 (15)
FX Power : Analysez la force des devises pour des décisions de trading plus intelligentes Aperçu FX Power est l'outil essentiel pour comprendre la force réelle des principales devises et de l'or, quelles que soient les conditions du marché. En identifiant les devises fortes à acheter et les faibles à vendre, FX Power simplifie vos décisions de trading et révèle des opportunités à forte probabilité. Que vous suiviez les tendances ou anticipiez les retournements à l'aide de valeurs extrêmes de D
FX Volume MT5
Daniel Stein
4.82 (17)
FX Volume : Découvrez le Sentiment du Marché tel que perçu par un Courtier Présentation Rapide Vous souhaitez faire passer votre approche de trading au niveau supérieur ? FX Volume vous fournit, en temps réel, des informations sur la manière dont les traders particuliers et les courtiers sont positionnés—bien avant la publication de rapports retardés comme le COT. Que vous visiez des gains réguliers ou recherchiez simplement un avantage plus solide sur les marchés, FX Volume vous aide à repére
*** Entry In The Zone et SMC Multi Timeframe est un outil d’analyse de marché en temps réel basé sur le concept Smart Money Concept (SMC). Il intègre efficacement des signaux de retournement et identifie automatiquement les zones de retournement clés grâce à la détection de structures multi-timeframes, ainsi que l’identification des Points d'Intérêt (POI). Cet outil est conçu pour aider les traders à planifier et à prendre des décisions avec plus de confiance et une approche plus structurée. **
FX Levels MT5
Daniel Stein
5 (4)
FX Levels : Des zones de Support et Résistance d’une Précision Exceptionnelle pour Tous les Marchés Présentation Rapide Vous recherchez un moyen fiable pour déterminer des niveaux de support et résistance dans n’importe quel marché—paires de devises, indices, actions ou matières premières ? FX Levels associe la méthode traditionnelle « Lighthouse » à une approche dynamique de pointe, offrant une précision quasi universelle. Grâce à notre expérience réelle avec des brokers et à des mises à jour
MetaBands M5
Vahidreza Heidar Gholami
4.5 (2)
MetaBands uses powerful and unique algorithms to draw channels and detect trends so that it can provide traders with potential points for entering and exiting trades. It’s a channel indicator plus a powerful trend indicator. It includes different types of channels which can be merged to create new channels simply by using the input parameters. MetaBands uses all types of alerts to notify users about market events. Features Supports most of the channel algorithms Powerful trend detection algorith
Atomic Analyst MT5
Issam Kassas
4.32 (19)
Tout d'abord, il convient de souligner que cet indicateur de trading n'est ni repainting, ni redrawing et ne présente aucun délai, ce qui le rend idéal à la fois pour le trading manuel et automatisé. Manuel de l'utilisateur : réglages, entrées et stratégie. L'Analyste Atomique est un indicateur d'action sur les prix PA qui utilise la force et le momentum du prix pour trouver un meilleur avantage sur le marché. Équipé de filtres avancés qui aident à éliminer les bruits et les faux signaux, et à
Tout d'abord, il convient de souligner que cet outil de trading est un indicateur non repeint, non redessiné et non retardé, ce qui le rend idéal pour le trading professionnel. Cours en ligne, manuel utilisateur et démonstration. L'indicateur Smart Price Action Concepts est un outil très puissant à la fois pour les nouveaux et les traders expérimentés. Il regroupe plus de 20 indicateurs utiles en un seul, combinant des idées de trading avancées telles que l'analyse du trader Inner Circle et le
MonetTrend — Премиум-индикатор для торговли по тренду (M30, H1, H4) MonetTrend — это мощный и визуально понятный трендовый индикатор, созданный для торговли на таймфреймах M30, H1 и H4. Он идеально подходит для работы с волатильными инструментами, такими как: • Золото (XAUUSD) • Криптовалюты (BTCUSD) • Валютные пары (EURUSD, USDJPY и др.) Ключевые особенности MonetTrend: • Автоматическое отображение Take Profit 1 (TP1) и Stop Loss (SL): После появления сигнала индикатор сразу показывает: • TP
IX Power MT5
Daniel Stein
4.86 (7)
IX Power : Découvrez des insights de marché pour les indices, matières premières, cryptomonnaies et forex Vue d’ensemble IX Power est un outil polyvalent conçu pour analyser la force des indices, matières premières, cryptomonnaies et symboles forex. Tandis que FX Power offre une précision maximale pour les paires de devises en utilisant toutes les données disponibles, IX Power se concentre exclusivement sur les données du symbole sous-jacent. Cela fait de IX Power un excellent choix pour les m
ICT, SMC, SMART MONEY CONCEPTS, SMART MONEY, Smart Money Concept, Support and Resistance, Trend Analysis, Price Action, Market Structure, Order Blocks, BOS/CHoCH,   Breaker Blocks ,  Momentum Shift,   Supply&Demand Zone/Order Blocks , Strong Imbalance,   HH/LL/HL/LH,    Fair Value Gap, FVG,  Premium  &   Discount   Zones, Fibonacci Retracement, OTE, Buy Side Liquidity, Sell Side Liquidity, BSL/SSL Taken, Equal Highs & Lows, MTF Dashboard, Multiple Time Frame, BigBar, HTF OB, HTF Market Structure
MONEYTRON – ТВОЙ ЛИЧНЫЙ СИГНАЛ НА УСПЕХ! XAUUSD | AUDUSD | USDJPY | BTCUSD Поддержка таймфреймов: M5, M15, M30, H1 Почему трейдеры выбирают Moneytron? 82% успешных сделок — это не просто цифры, это результат продуманной логики, точного алгоритма и настоящей силы анализа. Автоматические сигналы на вход — не нужно гадать: когда покупать, когда продавать. 3 уровня Take Profit — ты сам выбираешь свой уровень прибыли: безопасный, уверенный или максимум. Четкий Stop Loss — контролируешь риск
FX Dynamic : Suivez la volatilité et les tendances grâce à une analyse ATR personnalisable Vue d’ensemble FX Dynamic est un outil performant s’appuyant sur les calculs de l’Average True Range (ATR) pour fournir aux traders des informations incomparables sur la volatilité quotidienne et intrajournalière. En définissant des seuils de volatilité clairs — par exemple 80 %, 100 % et 130 % — vous pouvez rapidement repérer des opportunités de profit ou recevoir des avertissements lorsque le marché dé
Special offer : ALL TOOLS , just $35 each! New tools   will be   $30   for the   first week   or the   first 3 purchases !  Trading Tools Channel on MQL5 : Join my MQL5 channel to update the latest news from me Découvrez la puissance du concept Inversion Fair Value Gap (IFVG) de l’ICT avec l’ Indicateur Inversion Fair Value Gaps ! Cet outil de pointe pousse les Fair Value Gaps (FVG) à un niveau supérieur en identifiant et affichant les zones de FVG inversées — des zones clés de support et de ré
Blahtech Supply Demand MT5
Blahtech Limited
4.54 (13)
Was: $299  Now: $149  Supply Demand uses previous price action to identify potential imbalances between buyers and sellers. The key is to identify the better odds zones, not just the untouched ones. Blahtech Supply Demand indicator delivers functionality previously unavailable on any trading platform. This 4-in-1 indicator not only highlights the higher probability zones using a multi-criteria strength engine, but also combines it with multi-timeframe trend analysis, previously confirmed swings
Ce tableau de bord affiche les derniers   modèles harmoniques   disponibles pour les symboles sélectionnés, ce qui vous permettra de gagner du temps et d'être plus efficace /   version MT4 . Indicateur gratuit:   Basic Harmonic Pattern Colonnes de l'indicateur Symbol :   les symboles sélectionnés apparaissent Trend   :   haussière ou baissière Pattern :   type de motif (gartley, papillon, chauve-souris, crabe, requin, cypher ou ABCD) Entry:   prix d'entrée SL:   prix du stop loss TP1:   1er
Tout d'abord, il convient de souligner que ce système de trading est un indicateur non repeint, non redessiné et non retardé, ce qui le rend idéal pour le trading manuel et automatisé. Cours en ligne, manuel et téléchargement de préréglages. Le "Système de Trading Smart Trend MT5" est une solution de trading complète conçue pour les traders débutants et expérimentés. Il combine plus de 10 indicateurs premium et propose plus de 7 stratégies de trading robustes, ce qui en fait un choix polyvalent
Tout d'abord, il convient de souligner que cet indicateur de trading ne repinte pas, ne redessine pas et n'a pas de retard, ce qui le rend idéal tant pour le trading manuel que pour le trading algorithmique. Le manuel utilisateur, les préréglages et le support en ligne sont inclus. AI Trend Pro Max est un système de trading sophistiqué tout-en-un, conçu pour les traders à la recherche de précision, de puissance et de simplicité. Basé sur des années de développement à travers des indicateurs préc
- Real price is 80$ - 40% Discount (It is 49$ now) - Lifetime update free Contact me for instruction, any questions! Related Product:  Gold Trade Expert MT5 - Non-repaint - I just sell my products in Elif Kaya Profile, any other websites are stolen old versions, So no any new updates or support. Introduction The breakout and retest strategy is traded support and resistance levels. it involves price breaking through a previous level.  The break and retest strategy is designed to help traders do
Auto Order Block with break of structure based on ICT and Smart Money Concepts (SMC) Futures Break of Structure ( BoS )             Order block ( OB )            Higher time frame Order block / Point of Interest ( POI )    shown on current chart           Fair value Gap ( FVG ) / Imbalance   -  MTF      ( Multi Time Frame )    HH/LL/HL/LH  -  MTF      ( Multi Time Frame )  Choch  MTF      ( Multi Time Frame )  Volume Imbalance     ,  MTF          vIMB Gap’s Power of 3 Equal High / Low’s  
Plus de l'auteur
Infinity Indicator
Luiz Felipe De Oliveira Caldas
Infinity Indicator MT4 3.3 Panel Win Rate based on CandleMT4 Exit Button Calculates the StdDev standard deviation indicator on the RSI data, stored in the matrix similar to the keltner. input int HourCalculate = 12; RsiLength  = 5; RsiPrice   = PRICE_CLOSE; HalfLength = 4; DevPeriod  = 100; Deviations = 0.9; UseAlert   = true; DrawArrows = true; TimerWork=300; LevelUp = 80; LevelDown = 20; MoreSignals = true;
Eagle Grid
Luiz Felipe De Oliveira Caldas
Grid trading is executed when orders are placed above or below a set price, creating a grid of orders with rising and falling prices. Our patented trader makes it possible to open new grids at the average price, thereby increasing the chances of recovering a negative floating balance. Unlike other trading strategies, our focus is on decreasing Bollinger bands. This means that if the market has abruptly moved into a region and is weakening, it is more vulnerable to a reversal. This innovative a
Fibonacci Trend Tracker
Luiz Felipe De Oliveira Caldas
An expert advisor (EA) is an automated trading system designed to execute trades on behalf of traders in the financial markets. In the context of a buy and sell grid system of levels breakout, the EA is programmed to identify key price levels and initiate buy or sell trades when those levels are broken. Here's a step-by-step description of how such an EA might work: Level Identification: The EA identifies significant price levels on the chart, such as support and resistance levels or trendlines.
Infinity Indicator MT5
Luiz Felipe De Oliveira Caldas
Infinity Indicator MT5 1.0 Panel Asset Rate % EURUSD   96.0% GBPUSD     94.1% AUDCAD     90.5% USDCHF     87.8% BTCUSD     78.4% Panel Win Rate based on CandleMT4 Exit Button Calculates the StdDev standard deviation indicator on the RSI data, stored in the matrix similar to the keltner. input int HourCalculate = 12; RsiLength  = 5; RsiPrice   = PRICE_CLOSE; HalfLength = 4; DevPeriod  = 100; Deviations = 0.9; UseAlert   = true; DrawArrows = true; TimerWork=300; LevelUp = 80; LevelDown = 20; MoreS
Eagle Grid MT5
Luiz Felipe De Oliveira Caldas
Grid trading is when orders are placed above and below a set price, creating an order grid with increasing and decreasing prices. Grid trading is most commonly associated with the foreign exchange market. In general, the technique seeks to capitalize on the normal volatility of an asset's price by placing buy and sell orders at certain regular intervals above and below a predefined base price. For example, a forex trader can place buy orders every 15 pips above a set price, while also placing se
RSI Divergence Signal
Luiz Felipe De Oliveira Caldas
RSI Divergence Signal The  RSI Divergence Signal  is a technical analysis tool used in financial markets to identify potential trend reversals. It compares the Relative Strength Index (RSI) with price action to detect divergences. When the RSI moves in the opposite direction of the price, it signals a potential change in momentum, suggesting that the current trend may be weakening. This divergence can indicate a buying opportunity in a downtrend or a selling opportunity in an uptrend. Traders u
Filtrer:
liken0908
179
liken0908 2024.11.20 10:51 
 

L'utilisateur n'a laissé aucun commentaire sur la note

Bolsa Invest
137
Bolsa Invest 2024.10.04 23:31 
 

L'utilisateur n'a laissé aucun commentaire sur la note

Luiz Felipe De Oliveira Caldas
7173
Réponse du développeur Luiz Felipe De Oliveira Caldas 2024.10.07 13:07
Tank you Brother! Brazilian the best!
Rafal Krzysztof Manuszewski
2327
Rafal Krzysztof Manuszewski 2024.09.10 12:04 
 

L'utilisateur n'a laissé aucun commentaire sur la note

Luiz Felipe De Oliveira Caldas
7173
Réponse du développeur Luiz Felipe De Oliveira Caldas 2024.09.10 12:08
exactly, very useful for the moment of end of price exhaustion, tanks brother
Nivaldo53
14
Nivaldo53 2024.03.16 14:57 
 

L'utilisateur n'a laissé aucun commentaire sur la note

Luiz Felipe De Oliveira Caldas
7173
Réponse du développeur Luiz Felipe De Oliveira Caldas 2024.03.16 15:59
Obrigado pelo reconhecimento, Nivaldo! O sistema de cores baseia-se na agressão do preço em relação à banda de Bollinger, com 3 níveis de cores indicando o quão agressivo é. Nos exemplos que mostrei, quando o mercado está em agressão e o segundo pico está divergindo do preço, significa que há uma grande chance de reversão, pois a força dos vendedores está mais fraca.
Ali  Al-jiboori
30
Ali Al-jiboori 2024.02.19 09:00 
 

L'utilisateur n'a laissé aucun commentaire sur la note

eryuechunshen
579
eryuechunshen 2024.02.01 15:09 
 

L'utilisateur n'a laissé aucun commentaire sur la note

Eva
77
Eva 2023.12.07 08:34 
 

L'utilisateur n'a laissé aucun commentaire sur la note

jeison jei
367
jeison jei 2023.09.04 05:01 
 

L'utilisateur n'a laissé aucun commentaire sur la note

Luiz Felipe De Oliveira Caldas
7173
Réponse du développeur Luiz Felipe De Oliveira Caldas 2023.09.04 05:05
Thanks a lot for the feedback Mr Jeison! Try pairing it with stochastic looks promising too! Any other suggestions for improvement send me in private, always good to hear good ideas
Findolin
1145
Findolin 2023.06.20 11:54 
 

L'utilisateur n'a laissé aucun commentaire sur la note

Luiz Felipe De Oliveira Caldas
7173
Réponse du développeur Luiz Felipe De Oliveira Caldas 2023.06.21 00:07
Very satisfied with the feedback! I appreciate the recognition, success!
Répondre à l'avis