Thunder Scalper
- Indicateurs
- Mr Fares Mohammad Alabdali
- Version: 1.0
- Activations: 5
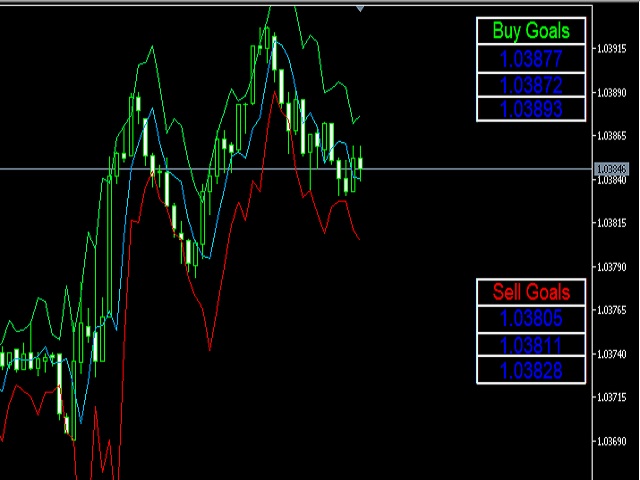
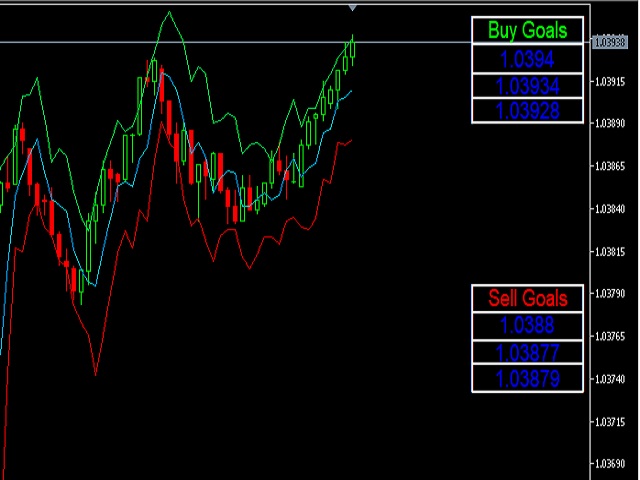
Indicateur d'objectifs d'achat et de vente
Il se compose de trois lignes : la première couleur verte identifie les cibles d'achat, la deuxième couleur rouge identifie les cibles de vente et la troisième couleur bleue est le prix moyen.
Il y a deux façons d'entrer -
Méthode 1 : Point d'entrée lorsque le prix moyen est cassé avec une longue bougie d'en bas et rester au-dessus de la ligne bleue avec une bougie verte est considéré comme un achat
Lorsque le prix moyen franchit le sommet avec une bougie rouge, cela est considéré comme une vente
La deuxième méthode: en atteignant des objectifs, par exemple, lors de la réalisation d'objectifs écrits sur l'écran numérique, s'il s'agit d'une vente
La fin de la vente est considérée comme le début du début de la réalisation des objectifs de l'achat.
———-