BarEndTime by MMD MT5
- Indicateurs
- Mariusz Maciej Drozdowski
- Version: 1.0
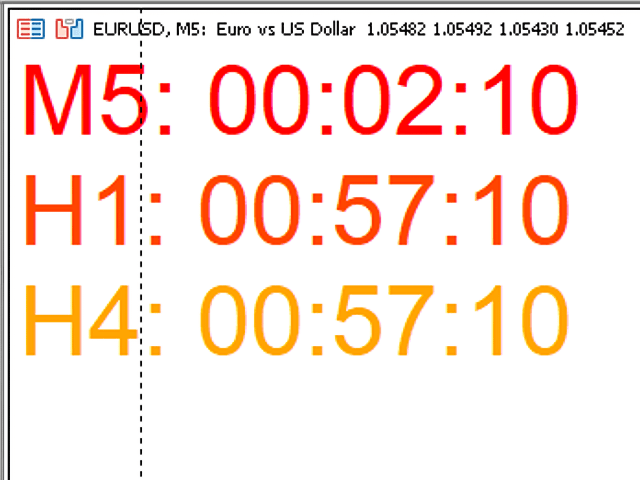
La barre Time End de MMD est un simple indicateur qui indique le nombre de secondes restantes dans les trois intervalles sélectionnés.
Selon la méthodologie MMD, le moment où un mouvement de prix directionnel se produit est important. Cet indicateur vous permet d'utiliser cette relation plus efficacement dans le trading Forex et Futures.
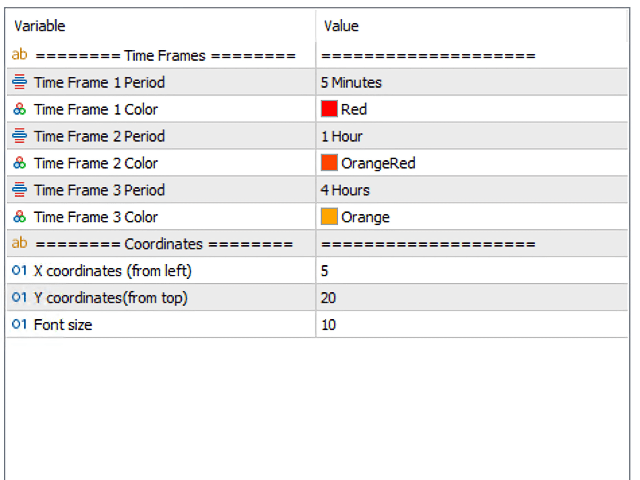
Descriptif des fonctionnalités :
Time Frame 1 Period - définissant le premier intervalle de temps
Time Frame 1 Color - spécifiant la couleur pour le premier intervalle de temps
Time Frame 1 Period - définit le deuxième intervalle de temps
Time Frame 1 Color - spécifiant la couleur pour le deuxième intervalle de temps
Time Frame 1 Period - définit le troisième intervalle de temps
Time Frame 1 Color - spécifiant la couleur pour le troisième intervalle de temps
Emplacement des données affichées sur le graphique :
Coordonnées X - le nombre de points à partir du côté gauche du graphique
Coordonnées Y - le nombre de points à partir du haut du graphique
Taille de la police - taille de la police