PointZero
- Indicateurs
- Juergen Thielen
- Version: 3.7
- Mise à jour: 16 avril 2023
Concept
Market arranges in Time upcoming Phases according to the present Results of its Interest.
Directing Modulations are an Interaction of immanent Periods, which show in Reference
- to Time cyclic Activity and
- to Price leveling Activity.
PointZero is a projecting Price Mask of this Concept of Time and Price and
- categorizing developed Price Movements related to their own Range: how far moved ?
- indicating their Status by marking special Events: when which Action ?
- setting the Situation in a functional Relation to the presented Support/ Resistance - Motive: miss/ hit/ pass ?
synthesize and project
Arrange with its underlying, grounding Components
- Time Price Channel
- Triple Pivot
and its conditional indicating Period Event Notation a situational Coordinate System.
Content
Time Price Channel
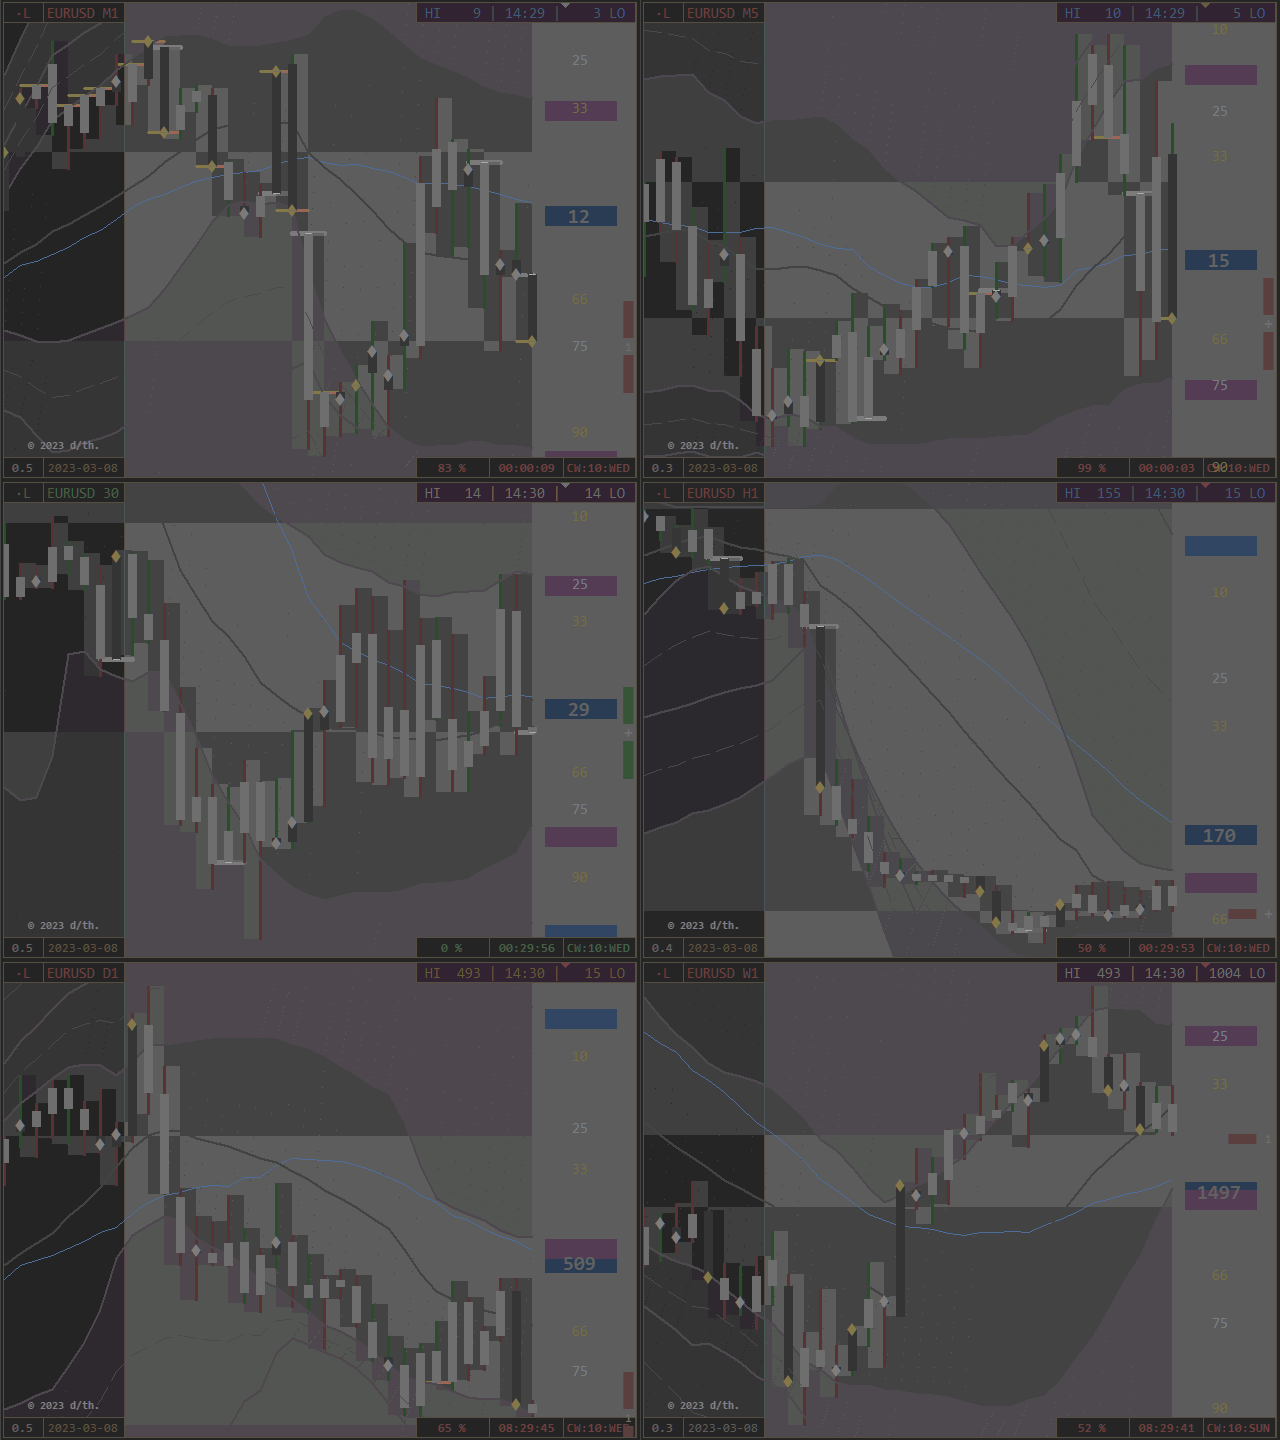
The D1/ W1/ MN - Channel consists of Shells around the ranging Center, which reflect theperiodic Alterations by its Separation in High-/Low-Bands and central Moving Averages.
Period Event Notation
Positions, Expansions and Distances are measured against the own Range,as also against the Channelrange, of which a Period the Body and (Part of) the Move is.
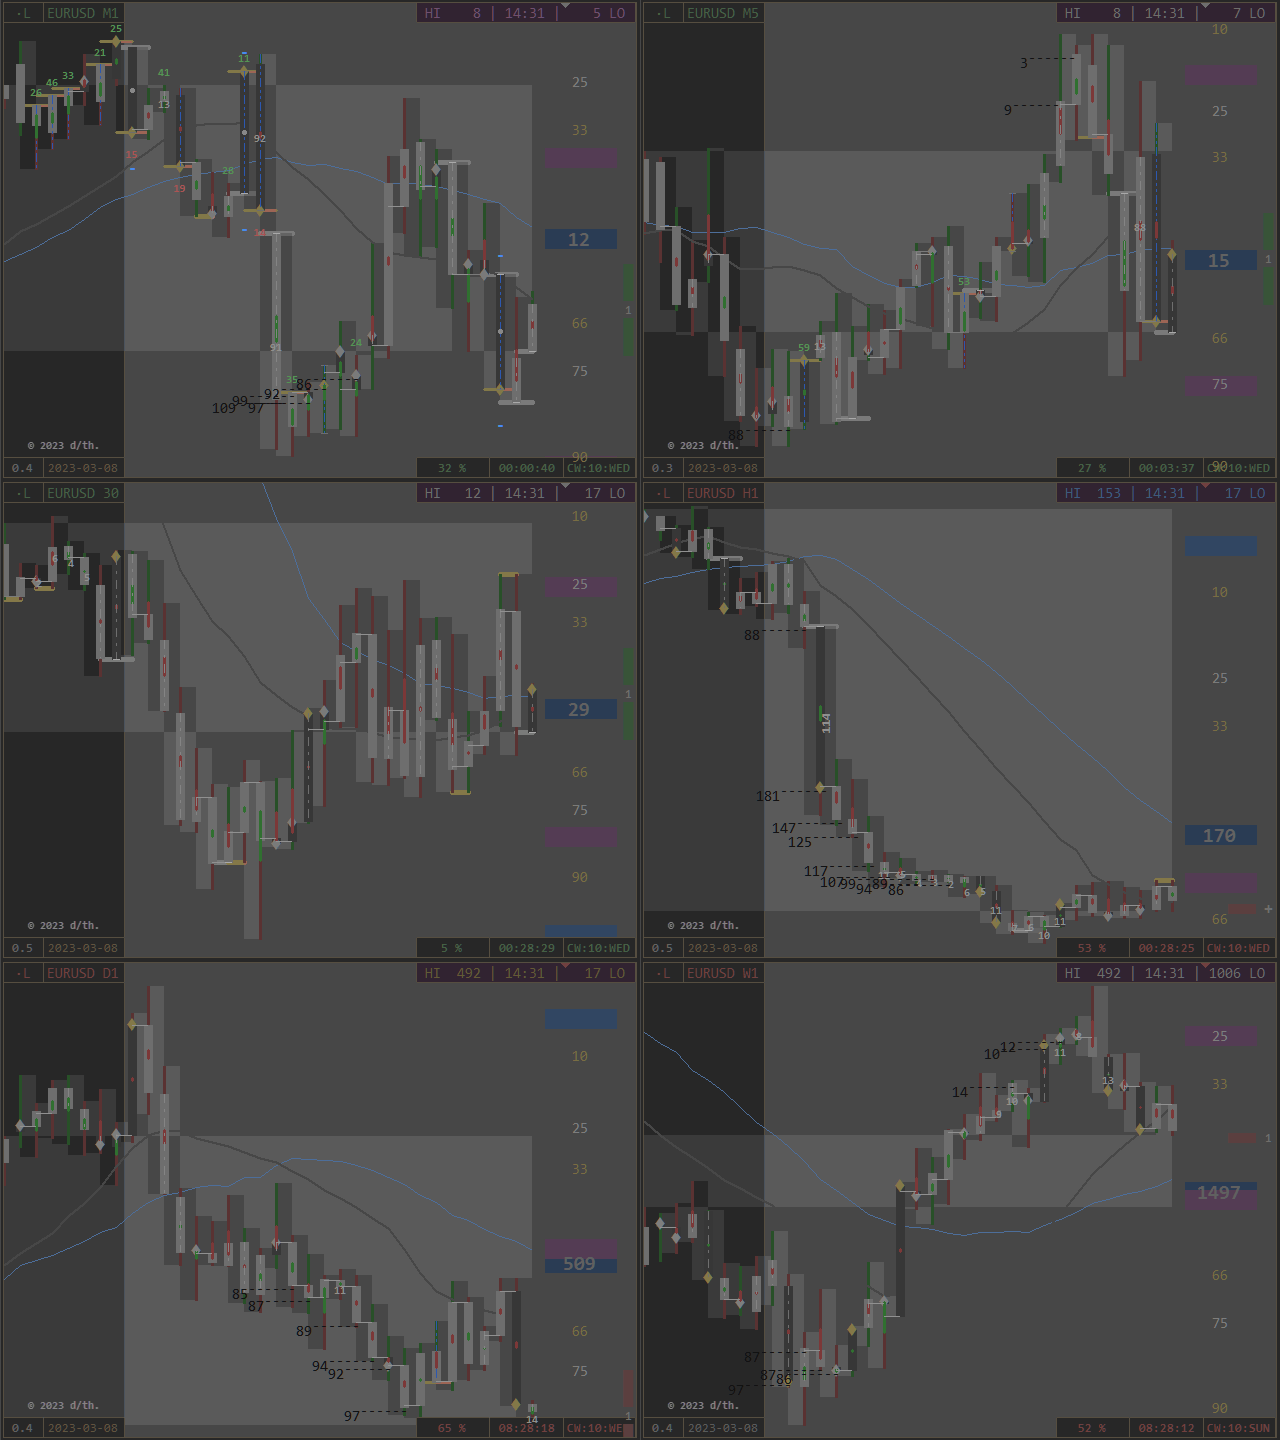
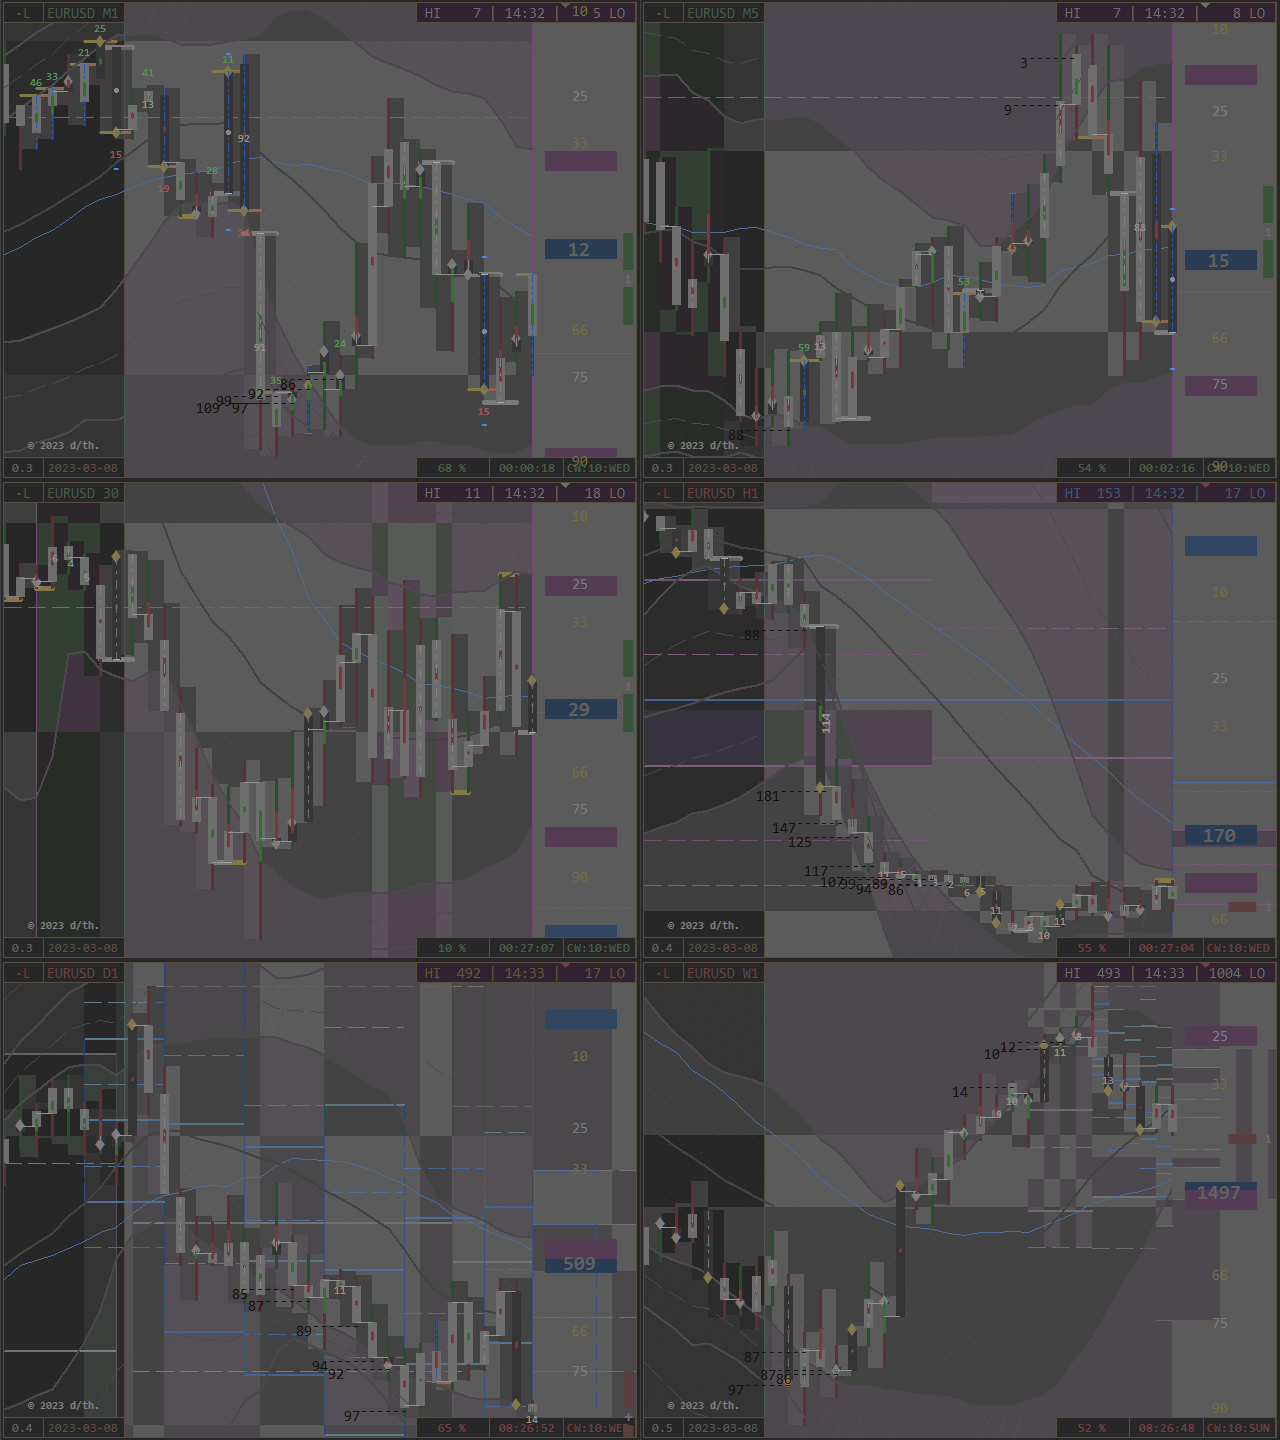
Special Events are displayed:
- Close/ Open at High/ Low/ Center (colored Notes)
- Break of weekly Channelbands (as Range Percentage)
- Move 0 - 100 % of Range: Open to Close = High to Low (blue dotted Trend)
- Move Proportions (white Values)
- Offset of Move - Center against Range - Center (central Colortrend)
- Parity of actual OHLC and previous OHLC (white Trend on Period and Offset Arrows on Scale)
- Parity of up and down - Wick (blue Stars)
- limiting Tick Values (Fraction Hits, green/ red)
Pivot Period Ports
D1/ W1/ MN - Pivots create besides their Portlevels a colored Background, indicating cyclic and leveling Phases.
Layers:
- Projectors, Ranges and Scales (set PointZeros in Relation to their own and to the actual Channelrange)
- Mirroring of Movements as Bars and Trendlines
- Coloring of Bands/ Periods
- Periods on/ off
- geometrical Chartstructure with Universal Mask
Additional Benefits:
- a positioning Autofocus
- a Logbook as directional Protocol
- a systemic Clock informs about periodic Phases (Pivot and Realtime)
- a Screenshot Function (Button on Chart and as automatic Interval)
- a detailed Definition of Objects and Functions by the Descriptive Mode (as Tool Tips)
- an adjustable Price Column and automatic Chartfitting
Contemplate its Concentrate
The Signal Density is related to Markets actual Phase, chosen Timeframe/ Security and Components.
PointZero generates as resulting Composition a defined Setting of Support and Resistance:
No Matter which Hemisphere: [ Open = Support | Resistance = Close ]
The MindMask resolves the active Status.
Indicative : Colorized : Universal
Please find all necessary Informations to this Product in its Compendium.
Below as Orientation the Extract of the individual Indicator-Adjustments.
Indicator PointZero
Think global - Act local
[VALUE] =
- Boolean: Button Position on Chart
- Cn: Corner n = 0 to 3 (left upper to right lower)
- Variable: default Value
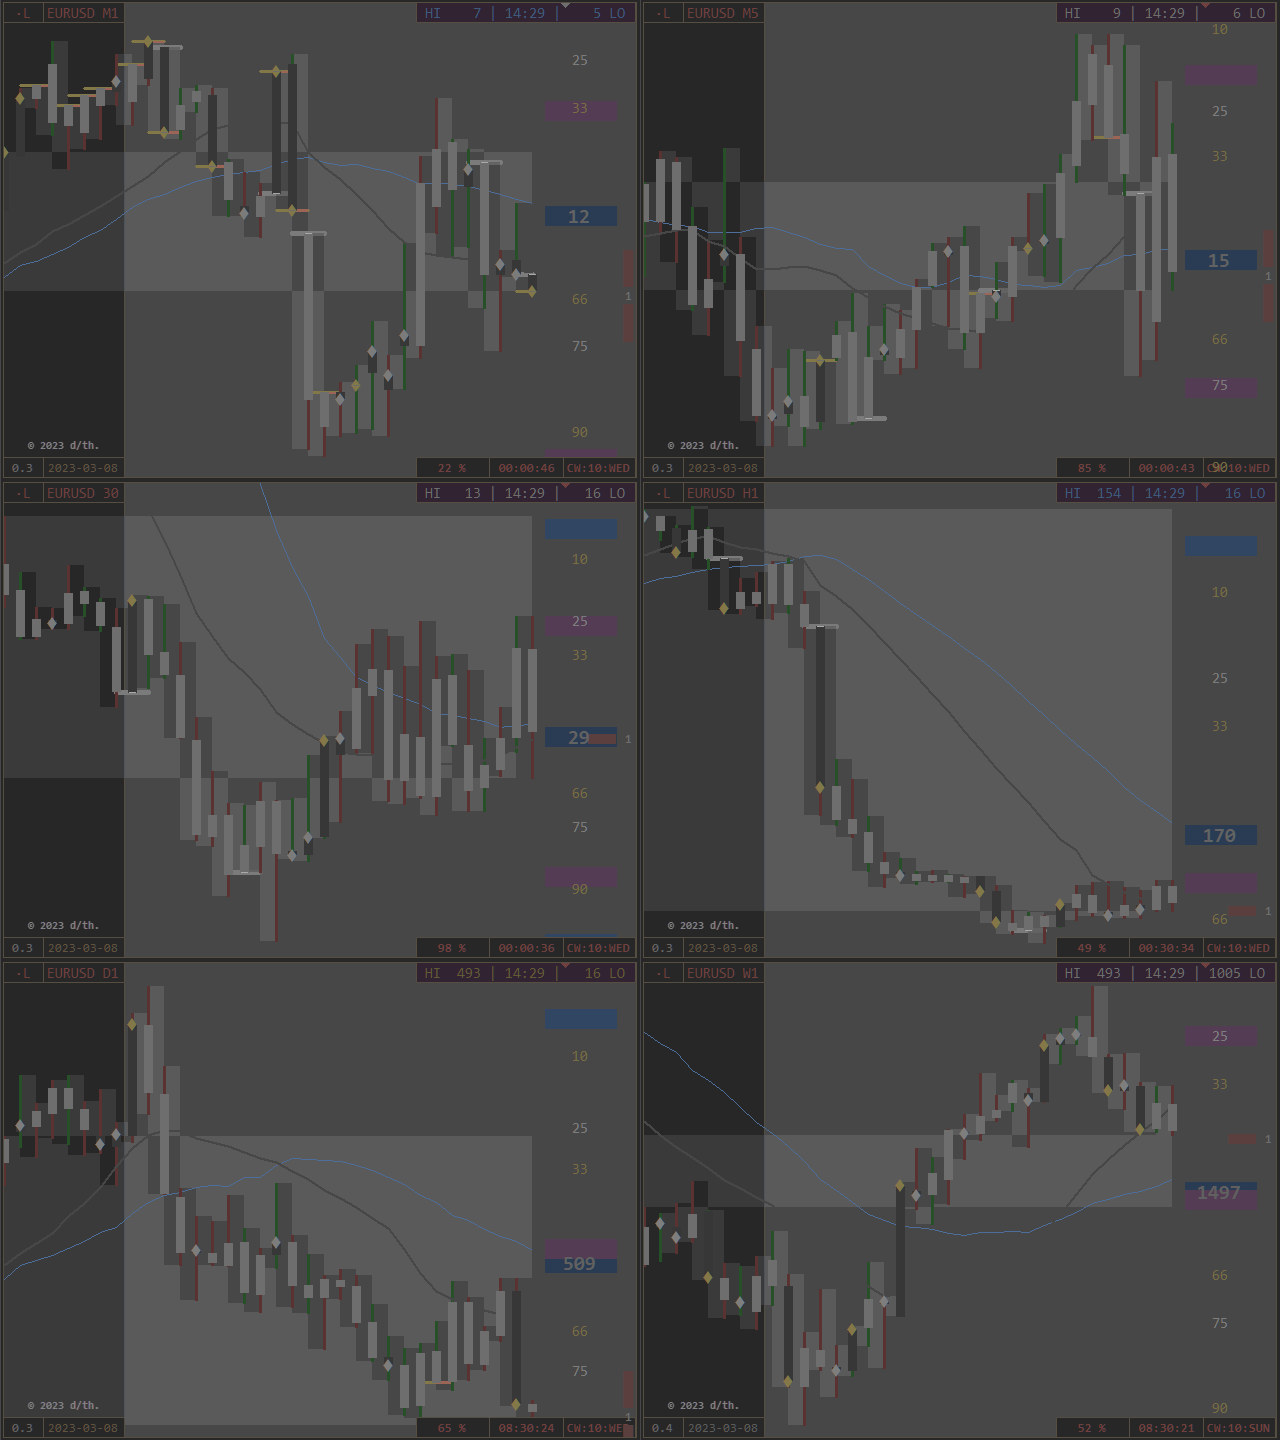
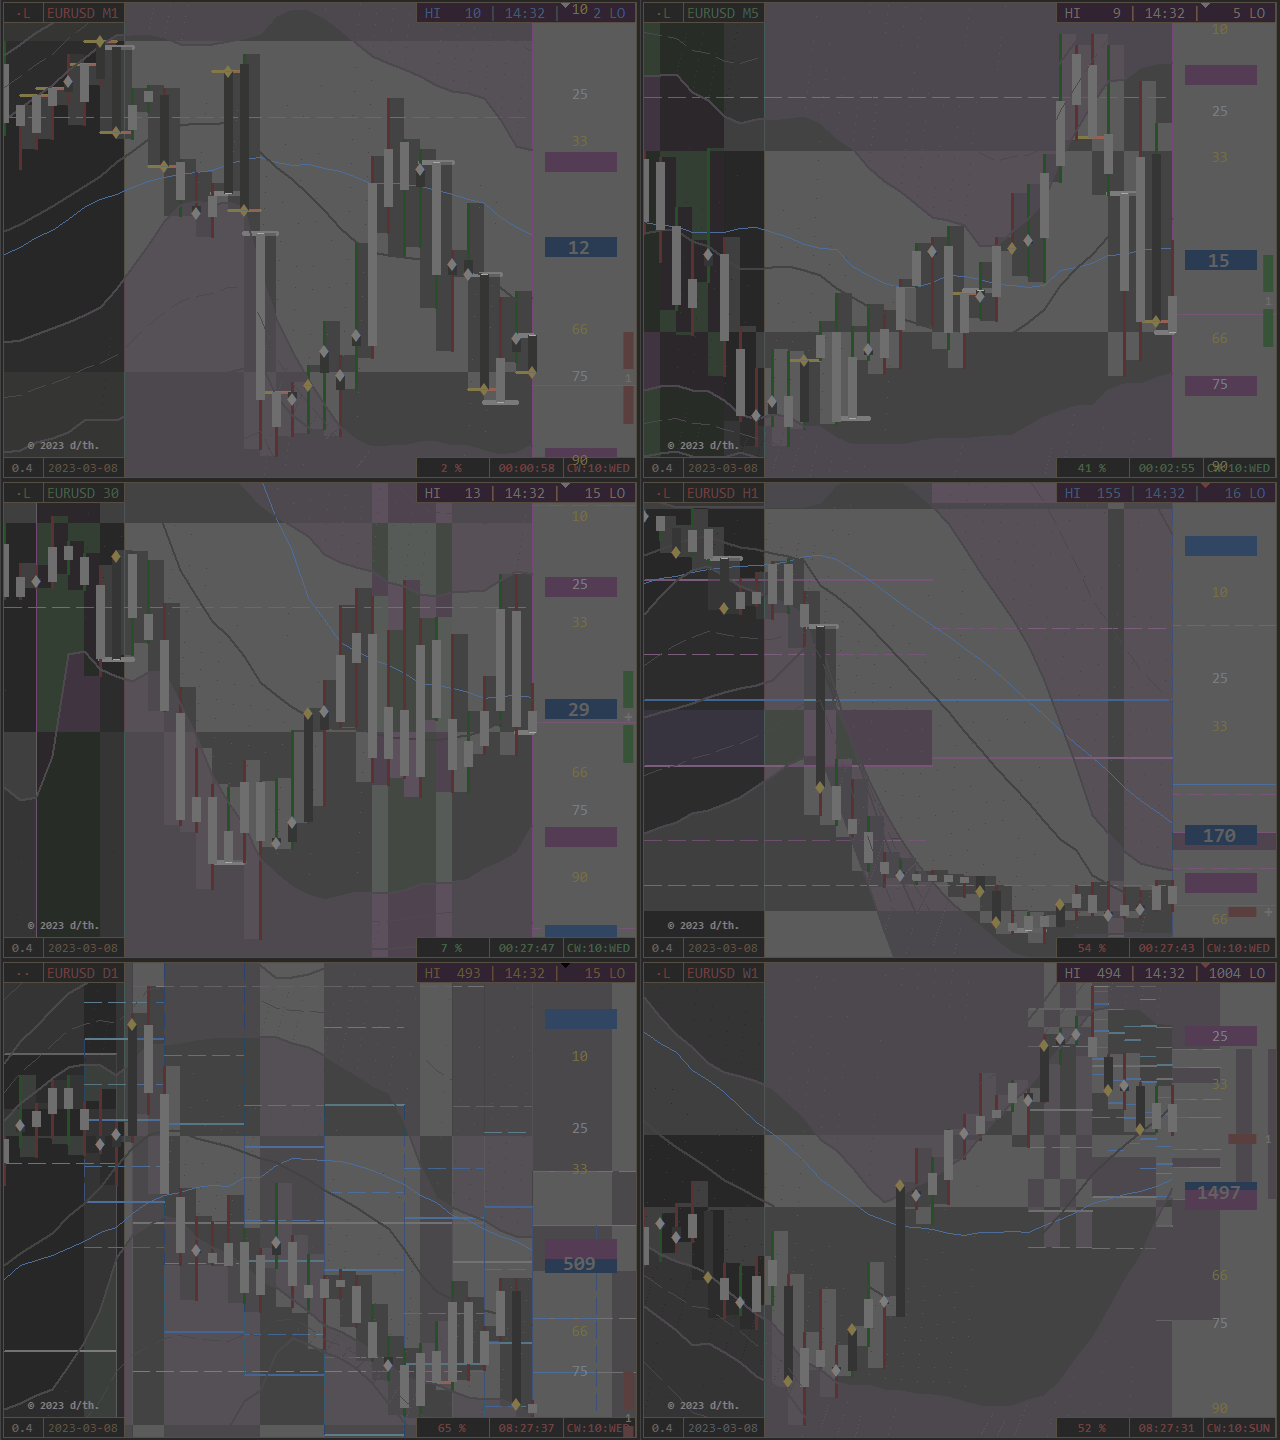
The default View of the Chart consists of following Components and is read like follows:
Move: Trace dark-gray/ Trend bright-grayworks as moving Range and ranging Move.
central MA: daily gray, weekly blue
Note*: no separate Center-Color, the Open is passed by/of both Directions.
Close Color by Move: Offset to prior Open (= actual)
- directional on: Null = white/ Full = orange
- navigational off: up = green/ down = red
- PointZeros off: noted by a white Haircross,
Every Period works by its own Range-Shadow with the variable Chart-Coloring.Toggle Close Signal via Countdown-Button.
Identify their Phase by Coloring the Ranges with Button in Corner 3 most right (CW:WD)
Visual of centered Range-Creation and -Filling:The Chart generates a (mostly central) gray Zone as Spread between
the highest Low and the lowest High of the visible Chart-Periods.
[5.1] Bools (on/ off)
Code = Logic = Notation of Ordination[5.1A] Fundament
Body of Chart
The first Options are the framing calculatoric Fundament of any Indicator Processing.
The visual Conjunction of both Mask-Complements delivers accidentially extra Roomfor additional Buttons in the Sub-Chart, to have direct Access to these three Core-Options.
Bands and Pivots define the periodic Arrangement,on which the Pen notes its designing Movements.
The Colors of Channel and Pivots cooperate = they are softened or amplifiedand process accordingly to the Color Theory an indicating Background Tone.
The overlaying Period Event Notation is called by variable Conditions andvisualizes the Tracing/ Trending of Bull and Bear in their Habitates/ Hemispheres.
Time Price Channel [SUB]
To identify its Construction fully, colorize its dimmed Trendlines by Countdown-Button [C3](or preadjust via Colored Bands in Options).
- hemispheric = 2 x 50% Coloring Ranges, depicted as colored Shells
- gray D1, blue W1 Center = 0
- Shells divided by Center-Trend
- asymmetric Appearance due to separate Calculations
- of High and Low - Bands and central Moving Averages
- Definition of Moving Average:
- variable Price Line
- Price of Time = external Argument
- Definition of Channel-Band:
- constant Time Line
- (ime of Price = internal Argument
3-lettered Abbrevations on Price-Column:
- Timeframe: MN = M, W1 = W, D1 = D
- + Position HI/ LO
- e.g. WLO = Low of W1 - Channel (blue)
Period Event Notation [SUB]
special Contemplation of conditionally called absolute and/or relative Events:
- Gator: 0-100 = Zero + Full Move
- blue dashdot Centertrend on Period
- notes new Phases (Caution)
- Range/Move - High/Low (RH/ RL / MH / ML)
- white move-connecting Trendline on Period
- notes Stator/ Rotor - Function by Open Position of Period
- Offset Move-Center against Range-Center
- colored Centertrend: green = North, red = South (directional)
- notes potential/ tendencial Phase Shifts
- periodic Centers in superordinated Range
- white Value on Period if Close = 50% and < 15% or > 85% in D1-Range
- notes near to Edge - Horizons in D1-Channel
- Values beside Periods (connected with Dashes to Close)
- if Close beyond W1 - Bands
- note relative Barriers for overshooting Level-Phases
- Tick Fraction Hits, as green and red Values
- calculatoric Base is the Relation of Period Expansion and Volume
- note expansional Edges of Time/ Price/ Tick
- bright blue Double Points (Stars)
- equivalent balanced/ central Position of Move in its Range
- note Periods, which have an equal Size of their "Wicks"
Pivot Period Ports [SUB]
Enjoy freestyle Combinatory for 3 main + 1 sub Pivot ((MN/ W1/ D1) + H4).
universal Standard:
Pivots are processed Period-Gates and describe a superordinated Sequence of Market.
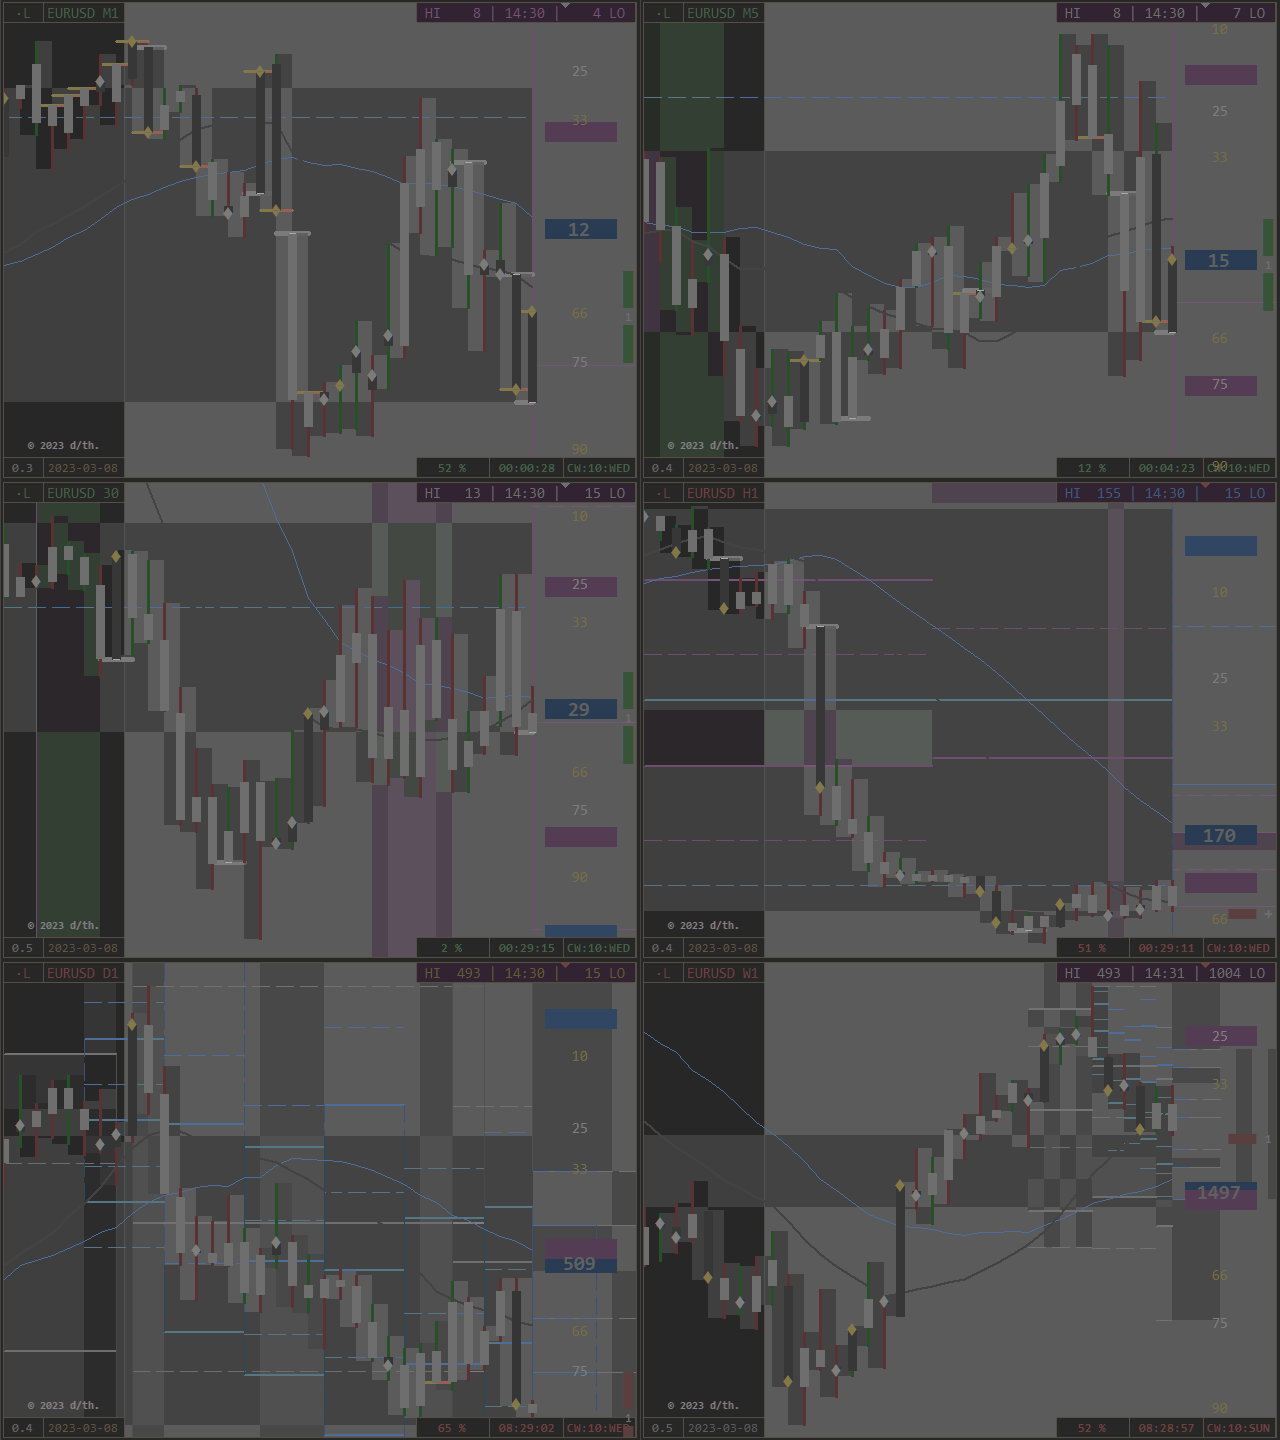
Equipped with cyclic and leveling Zones (colored Background), which note
- by Time the first, central and last 10% of the Cycle Range
- (Visibility timeframe-dependent, adjust accordingly if necessary)
- by Price the 66-75% of North and South Level-Range
- (Visibility chartscale-dependent, use implemented Autofocus if needed)
- Timeframe: MN = M, W1 = W, D1 = D, (H4 = H)
- + Direction (N, S)
- + Level (1, 2, 3)
- or Pivot (PP)
- e.g. MN1 = Monthly Pivot (white) Level 1 in Northern Hemisphere
(last two Hours of Friday are processed on Sunday)
- additional and isolated Sunday-Pivot.
Functions
Being develops from Within.Equal Interest is generic.
The next five Options are Instruments for an extended Chart-Appearance and flexible Functionality:
[PRICE] Auto Focus:
Visual Flexibility, automatic
- toggle by Click on the Price-Column (most right)
- calculates the Chart-Dimensions related to the actual Move-Development
- creates Room on active Hemisphere
- more Range if Trend/ more Move if Trace
- Sensitivity indicates upcoming Activity (Work on Tipping-Points)
- situative fluid Chart Impression (Scalation of developing Range = relative)
[SCALE] 2 x Period (Range + Move):
Visual Flexibility, manual
Isolate Range and Move by Click-through:
- toggle by Click on the Scale-Column (2nd right)
- first Click = minus Move, shows blank Period-Range
- second Click = toggles Range and Move, shows blank Period-Moves
- third Click = all back
switch Periods completely off with both Options false => complete free view.
All Layers stay functional.
[PROJECTOR - TOP] Protocol Role:
Data Divisioning, Sentence
The Protocol of periodical Events can be set to Autostart for sufficient wide charts.Chart-Auto-Scroll has to be active.
According to the Chart-Concept it is divided in componental Columns of TOHLCV,
inclusive full Legend via Tooltip.
From left to right:
- Period Time/special Occurrences
- positioning Range Open Side
- central periodic Function (two Roles)
- navigating Move Close Side
- Period Volume/special Occurrences
- switch on/ off (completely) on Chart via Projector - Button
- leave with staying Panel as Placeholder by direct Click on the List
It is in flat Markets potentially supportive for the Resolution, because MT-Scale-Calculations
are situatively adjusted by Reduction of Periods (optional in Conjunction with Autofocus).
[REFLECTOR - BOT] Universal Mask:
Data Divisioning, Sequence
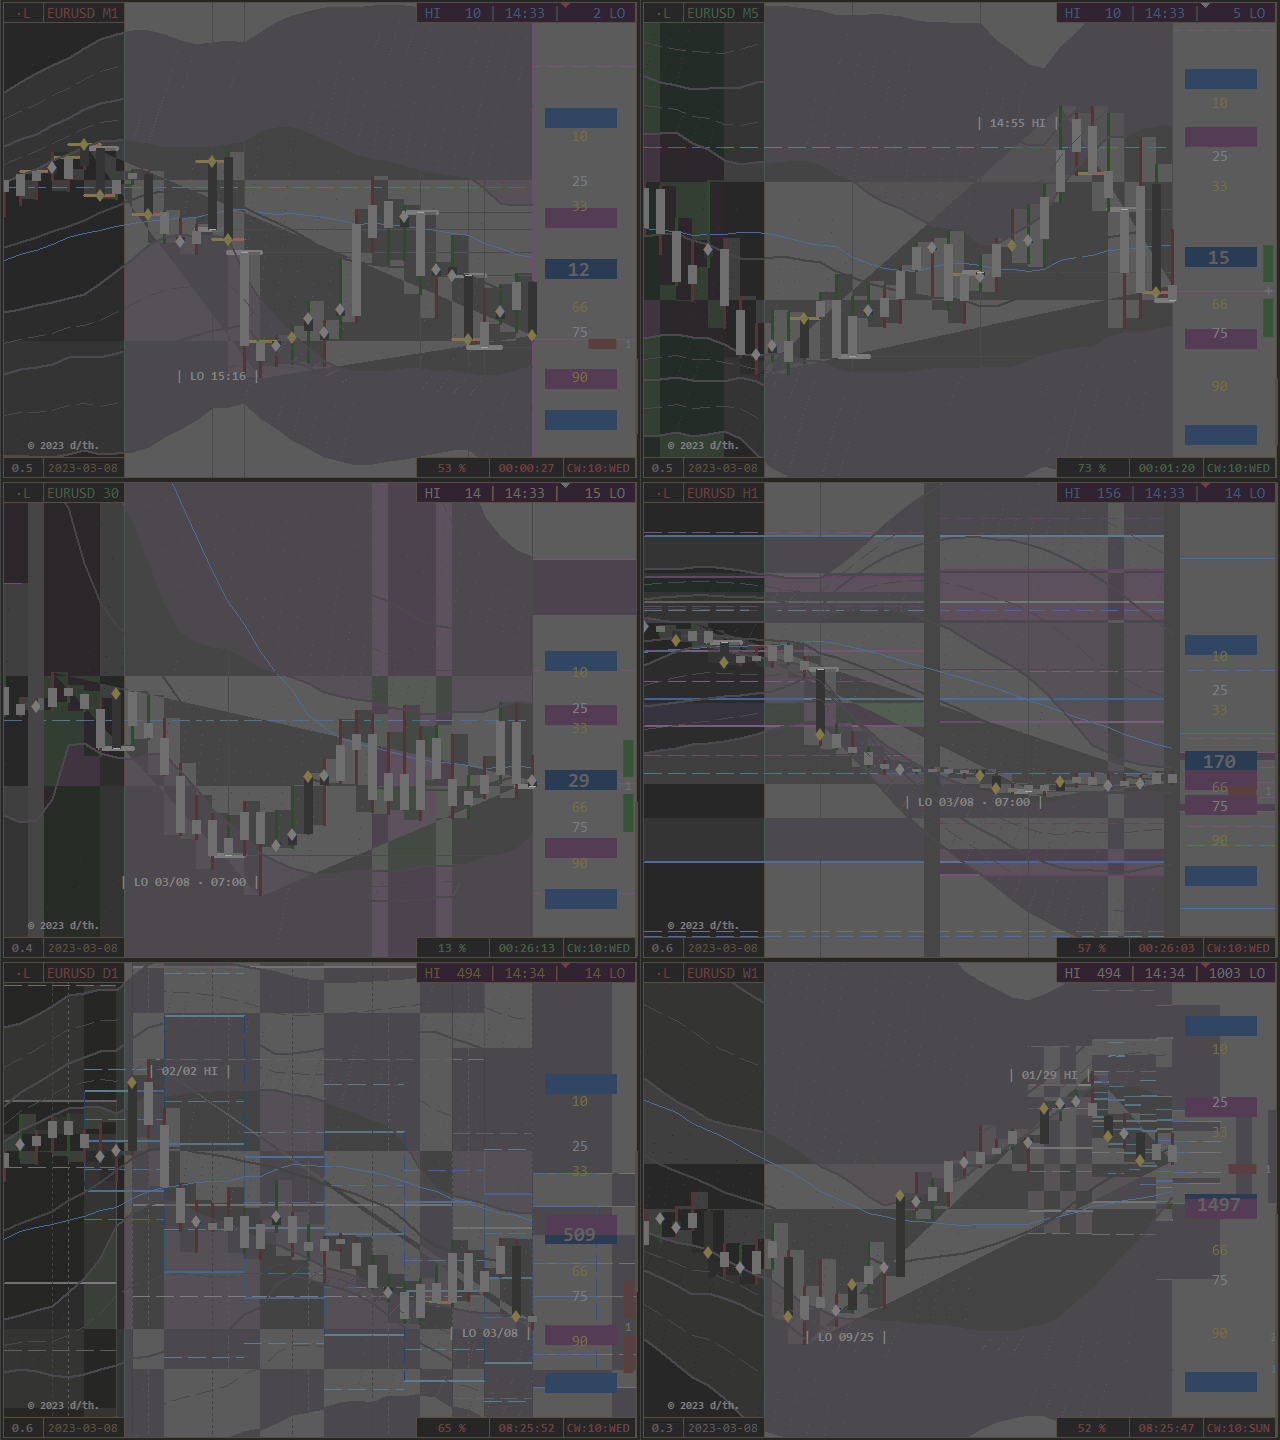
- Open/ Close at High/ Low/ Center (Notes/ Dashes/ Crosshairs)
- Open/ Close - Grid, PointZero Support-Resistance Graduation
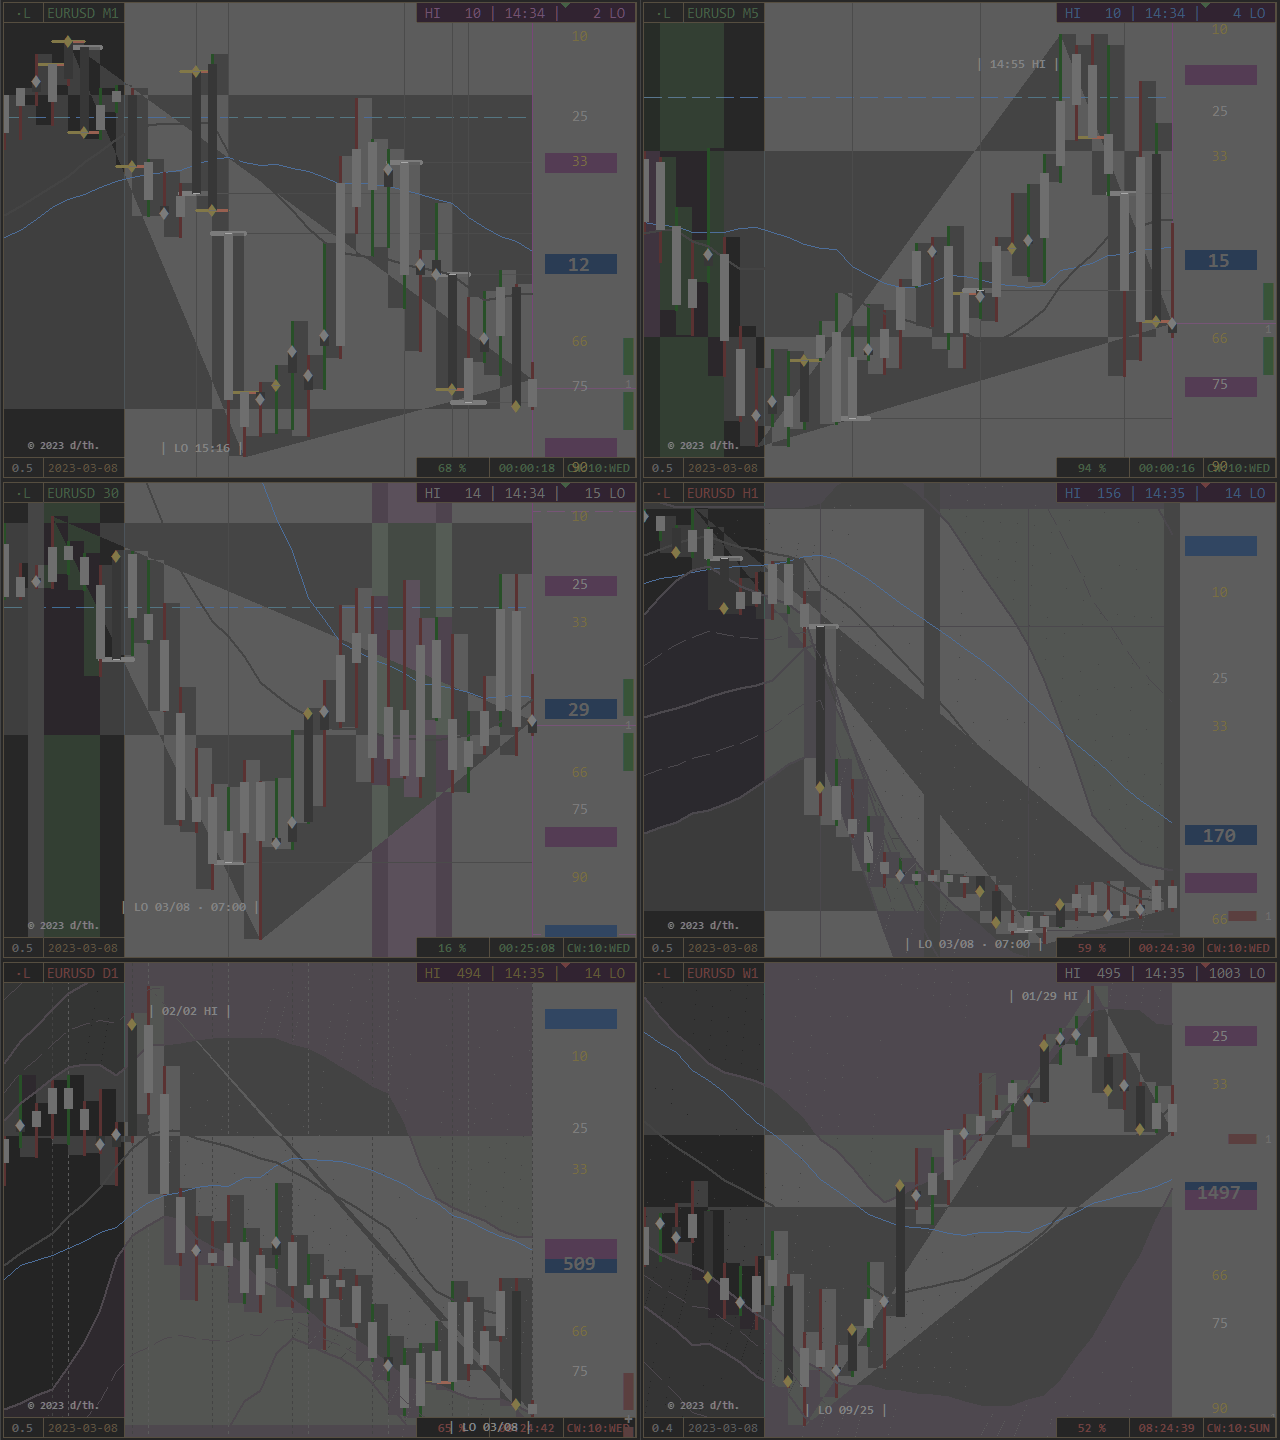
- High/ Low/ Bid - Cone of Light (Chart Phase Scope)
- High/ Low - Chart-Time of visible Periods (white, on Chart: timeframe-sensitive)
- High/ Low - Chart-Price of visible Periods (white, on Price-Column: CHI = Chart High, CLO = Chart Low)
Indication of weekly Realtime-Transition Wednesday and Thursday
- Odin = Ministrant/ Mantle/ collects = Close of Phase
- Thor = Kloeckner/ Hammer/ strikes = Open of Phase
appears on Timeframes > M5 as underlying Histogram-Ray (chart-traversal)
- if Zero = Close at Open/ High/ Low/ Center: white dash, notes Edges and Centers of Phases
of the inner and outer Relations of Open and Close.
Move-Info:
Display: Position + Direction + Function + Phase
[TOP] Echo Bars:
- mirrored Bars, directional colored according to their respective Period-Direction,
- adds an inverted Visual of Movements and forms a functional Helix.
[BOT] Echo Trend:
- mirrored Open- and Close-Trendlines, white = Open and orange = Close,
- notes separately the leading Component of a Period as Heartbeat-Trend.
Layers
projective Reflection = reflective Projection
The Card Deck:
2 Buttons Corner 0 = TL
Order-Tool
- first Letter = Pivot, second Letter = RealTime
- Display: C = Cycle/ L = Level/ Dot if not
Clock
- Market is clocked realtime to the real World by own Interest via cyclic and leveling Events.
- Button Top right Corner 1 (Screenshot-Button) shows VOL (Volume/ Volatility)
- Phases MN = M/ W1 = W/ D1 = D
The actual Time-Phase correlates with actual valid Price- and Volume-Phases
and defines the timely Range of the pricely Movement.
Price confirms this defining Call as designed Reflection.
Equal Colors cooperate through all Dimensions.
1 Button Corner 1 = TR
- Clock Display
- Screenshot, saved as GIF in \\DataFolder\MQL\Files\
2 Buttons Corner 2 = BL
Spread-Button (first, left) extends Button Row:which give access to the separate Chart Projectors.
Note:
The following Layers are Product of the Projection of PointZeros to the actual processed Range and Move.
According to the Separation in Cycles and Levels, the direct
- Projections as Light Cones are separately accessible.
Ranges and Scales are functional combined, and both are
- by time: white/ blue and
- by price: green/ red colored.
All have their conditional Appearance according to
- Timeframe/ Security and Presence of Conditions
Thus, Event-Density and -Impact
- according to relative Distribution and Correlation of present Potentials!
Choose of limitless Adjustability for Templates!
Due to their steady Interaction with the present Period they developand work actively (if enabled), until the PointZero leaves the Chart.
From left to right:
Time-Price-Button:
Display: Server-Time + Bid Function: PointZero - Level Scaling
TPP / PPT - Button:
- TOP Level Ranges:
- absolute and relative Plot of High/ Low - Ranges of respective PointZeros,
- Color navigational/ positional
- BOT Phase Scales:
- absolute Division of respective PointZero - Range,
- overlying Variable notes TOHLCV - Position of next directive Call
Display: Productivity
VPP = Volume per Period:
Protocol List/ Center on TimeBand
absolute (= Frequency)TPP = Ticks per Pip:
Impulse / Period
Sensitivity 15%
- relative (= Alteration)
- Impulse / Pip
- Sensitivity 33%
PPT = Pips per Tick:
- total (= Oscillation)
- Pip / Impulse
- Sensitivity 50%
Please further Informations to external Productivity in Section [7.0].
Function: PointZero - Projector (Beams)
- on Top = Cycle
- on Bottom = Level
Both Projectors are setting their own Range Position in Relation to the actual Range Position,
depending on their individual cyclic/ leveling Function.
They work according to their Function and related to the individual Chart-Situationas
ranging Barriers (Resistance) orTheir Update-Frequency is by Tick, that means: they adjust in Cooperation with the
moving Tractors (Support).
actual Development, as long as their Period is on the Chart visible (if enabled). Date-Button (second, right)
- Toggles the Period-Scale and
- navigating Arrows RH/ MH/ ML/ RL, noting their Offset to their prior Position.
- Periods: Support white - Resistance orange
3 Buttons Corner 3 = BR
Colorize Channel Bands and Period Ranges to identify their Classification/ Function:
- Step = violet = D1
- Lift = blue = W1
- Null = white = MN
- Full = orange = H4
left: [Period-Percentage] = colored Periods
right: [CalendarWeek:WeekDay] = colored Channel-Bandsnote the classified State of Period-Moves
note the classified State of Period-Ranges = Channel-Shells/ Levelscenter: [Countdown] = Close Signal
initially not shown, here on/off
Adjustments of general Nature:
- The Descriptive Mode is useful for Orientation or Confirmation (of not finally settled Experience).
- Extend the Pivot by H4 for smaller Timeframe Analysis.
- The MT4-Scales are a "fundamental Adjustment". I cannot resolve them..
Integer/ Double
constant variable = variable constant
The Icing:
- Protocol Role: 0 = Func (Function) / 1 = Bube (BullBear)
- Offset Price: position Price by whitchever Intent
- Shorten Digits: 6 Digits can be shorten to the preferred Length
- Screenshot
- Interval: 0 = off,
- Integer above 0 = Interval in Minutes
- adjust in Height and Width
- saved as GIF in \\DataFolder\MQL\Files\
logiclaboratory studio
© 2018-2023 /thiejden.




Extremely useful and incredible tool! I don't understand how this doesn't have 5 star reviews yet! It has totally changed the accuracy of my entries! Thanks to the author!