Volatility Meter
- Indicateurs
- Ali Waqas Ahmad
- Version: 1.0
- Activations: 5
A very good indicator for experienced and professional traders . A practical approach to trading. Easy to understand. A helping tool for traders looking for price movements .
Signals:
Signal Number 1:
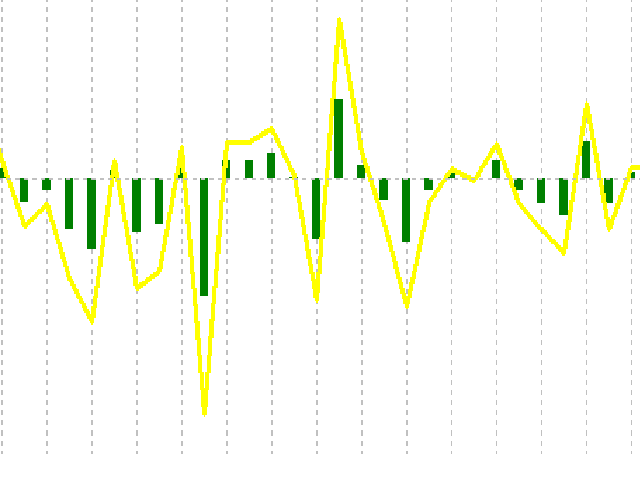
When yellow line which is a signal line crossing the zero line towards downward direction is a selling opportunity.
Signal Number 2:
When yellow line which is a signal line crossing the zero line towards upward direction is a buying opportunity.