• Aperçu
  • Avis (1)
  • Commentaires

Meco Ultimate Channel

5

This indicator belongs to the family of channel indicators. These channel indicator was created based on the principle that the market will always trade in a swinging like pattern. The swinging like pattern is caused by the existence of both the bulls and bears in a market. This causes a market to trade in a dynamic channel. it is designed to help the buyer to identify the levels at which the bulls are buying and the bear are selling. The bulls are buying when the Market is cheap and the bears are selling when the Market is expensive.


It is designed to help the trader practice a principles of "Buy THE LOW, SELL THE HIGH". This indicator can be used to trade Ranging markets and Trending Markets.in Ranging markets, Reversal strategies can be used along with this indicator and in Trending Markets , Trend trading Strategies can be used along side with this indicator.


In Trend Reversing strategies , it can be used with Oscillators like RSI, STOCHASTIC, MACD, ATR, VOLUMES, Divergence indicators , harmonic Patterns, ICT and smart Money strategies. for Trend Followings  strategies the channel can be used with indicators like Pullback indicators , Oscillator Convergences , Continuation Patterns like Triangle , Flags, Market imbalances etc
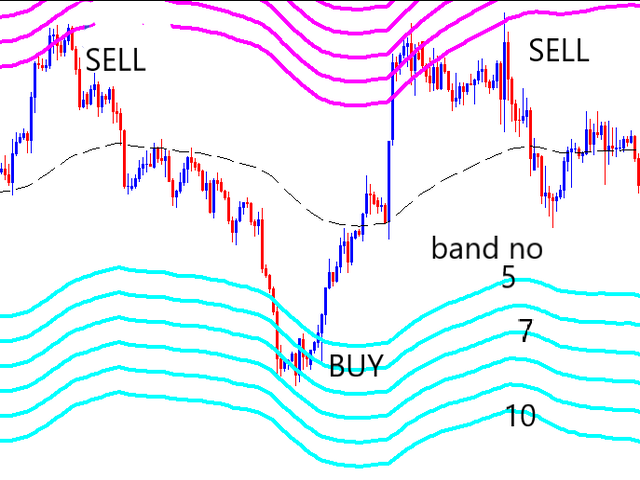
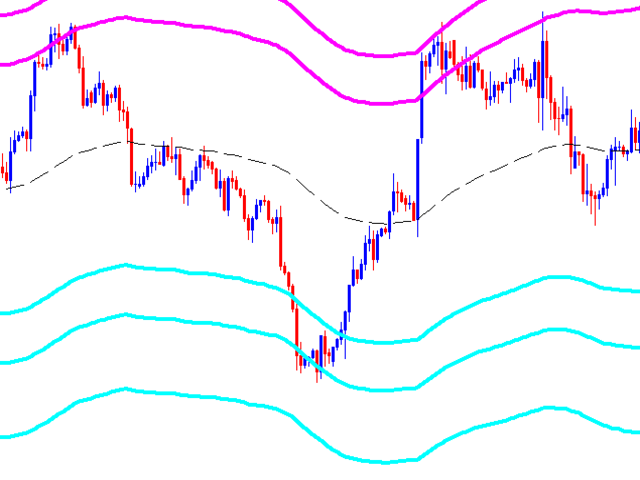
in trend reversing the orders are executed when the prices reaches the upper and lower bands of the channel as shown on the screenshots. In trade following the orders are executed when reaching the mid line of the channel which is dotted line in the default setting as shown on the screenshots. The indicator can be used in any time-frame from scalping , swing trading and investing. it can be used in all market from Forex, stock and Synthetics.  

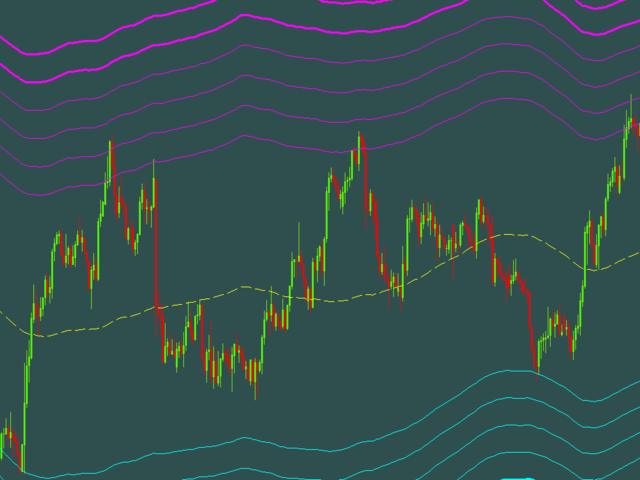
The channel can be modified to suit the market you are trading, by changing the  bands of the channel or the averaging method of the channel.Also the colour of the bands can be changed to suit the background of your choice.  by default the indicator comes with 3  upper bands and 3 lower bands , hence you can add it twice in a chart to have 6 upper bands and 6 lower bands. the bands can be stepped by 5, 6,7,8,9,10. You will also need to zoom in your charts to see all the channel bands.  

Avis 1
zbairen985
440
zbairen985 2023.02.25 12:59 
 

This software product is great. But there is a question to ask the author:in my chart, only three lines are shown above and only three lines are shown below. How can we achieve the six lines above and six lines below? Please give me a solution! Thanks a lot!

Produits recommandés
Binary Options Assistant (BOA) BOIL Signals Indicator provides signals based on Ana Trader Binary Options Strategy. Indicators: Stochastic Stop missing trades, stop jumping from chart to chart looking for trade set-ups and get all the signals on 1 chart! U se any of the BOA Signals Indicator with the  Binary Options Assistant (BOA) Multi Currency Dashboard .  All BOA Signal Indicator settings are adjustable to give you more strategy combinations. The signals can be seen visually and heard au
Liquidity Oscillator
Paolo Scopazzo
5 (1)
A powerful oscillator that provide Buy and Sell signals by calculating the investor liquidity. The more liquidity the more buy possibilities. The less liquidity the more sell possibilities. Please download the demo and run a backtest! HOW IT WORKS: The oscillator will put buy and sell arrow on the chart in runtime only . Top value is 95 to 100 -> Investors are ready to buy and you should follow. Bottom value is 5 to 0 -> Investors are ready to sell and you should follow. Alert + sound will app
Deriv Boom sell
Yaovi Inoussa Atchou
Notre indicateur BOOM SELL ALERT est spécialement conçu pour prendre des bougies sur BOOM 1000, BOOM 500 est un outil optimisé pour la période M1 (1 minute), vous garantissant de recevoir des informations opportunes et exploitables. L'indicateur est une combinaison de plusieurs indicateurs. - Oscillateur AO - Stochastique COMMENT UTILISER CET INDICATEUR Pour bien utiliser cet indicateur, il faut utiliser SCHAFF TREND RSX ( 5 MIN OU M5) SI la tendance SCHAFF RSX est VERTE et que vous avez un sig
Binary Options Assistant (BOA) BURN Signals Indicator provides signals based on Ana Trader Binary Options Strategy. Indicators: MACD & Stochastic Stop missing trades, stop jumping from chart to chart looking for trade set-ups and get all the signals on 1 chart! U se any of the BOA Signals Indicator with the  Binary Options Assistant (BOA) Multi Currency Dashboard .  All BOA Signal Indicator settings are adjustable to give you more strategy combinations. The signals can be seen visually and hea
Scalping Entry Points - est un système de trading manuel qui peut s'adapter aux mouvements de prix et donner des signaux pour ouvrir des trades sans redessiner. L'indicateur détermine la direction de la tendance par le niveau central de support et de résistance. L'indicateur de point fournit des signaux pour les entrées et les sorties. Convient pour le trading intrajournalier manuel, le scalping et les options binaires. Fonctionne sur tous les délais et instruments de trading. L'indicateur donn
Naked Forex Kangaroo Tail Indicator Kangaroo Tail Indicator is a pattern recognition indicator for Forex, Stocks, Indices, Futures, Commodities and Cryptos. The Kangaroo Tail is a multi-bar pattern. The Kangaroo Tail pattern is very effective and is very simple to trade. The strategy that comes with the Kangaroo Tail is based on price action. The indicator does what it was designed for: displaying Kangaroo Tail patterns.   Don't expect to follow the up and down arrows and make money . Tr
What is KTrend indicator ? KTrend is a powerful indicator for trading medium-term binary options that identify the trend of price by candlesticks. Sell signal is formed when the value is below the zero line. Similarly, buy signal is formed when the value is above the zero line. It is separated from KTrend trading system and you can get the backtest result from the pictures below.
WanaScalper
Isaac Wanasolo
1 (1)
A scalping indicator based on mathematical patterns, which on average gives signals with relatively small SL, and also occasionally helps to catch big moves in the markets (more information in the video) This indicator has three main types of notifications: The first type warns of a possible/upcoming signal on the next bar The second type indicates the presence of a ready signal to enter the market/open a position The third type is for SL and TP levels - you will be notified every time price r
Trend indicator, a revolutionary unique solution for trend trading and filtering with all important trend features built into one tool! This is a 100% non-repainting multi-timeframe and multi-currency indicator that can be used on all currency pairs. HandleTrend is an effective trend following indicator that gives trend signals in the form of arrows on the chart.
Smooth price for Monarch
Konstantin Gruzdev
5 (1)
The Smooth Price technical indicator is used for plotting a smoothed line as close to the price of the financial instrument as possible, and serves to eliminate its noise components. The indicator is part of the Monarch trading system, but here it is presented as an independent technical analysis tool. The indicator is based on the cluster digital filter , which, unlike the ClusterSMA , is applied directly to the price time series. Smooth Price does not redraw (except the very last, zero bar) an
Consolidation Zone   Indicator is a powerful tool designed for traders to identify and capitalize on consolidation patterns in the market. This innovative indicator detects consolidation areas and provides timely alerts when the price breaks above or below these zones, enabling traders to make informed trading decisions. MT4 Version :  https://www.mql5.com/en/market/product/118734 Key Features: 1.   Consolidation Detection :    -   Precise Identification : The Consolidation Zone Indicator a
FREE
BinaryPinMt5
Andrey Spiridonov
BinaryPinMt5 is an indicator developed and adapted specifically for trading short-term binary options. The indicator's algorithm, before issuing the signal, analyzes many factors, such as market volatility, searches for the PinBar pattern, calculates the probability of success when making a deal. The indicator is set in the usual way. The indicator itself consists of an information window where the name of the trading instrument is displayed, the probability of making a successful transaction,
Alright. This indicator works on MT5 and mt4 and is very easy to use. When you receive a signal from it, you wait for that candle with the signal to close and you enter your trade at the beginning of the next new candle. A red arrow means sell and a green arrow means buy.  like for easy identification of trade signal. Are you okay with that? candle 1 minute  expire 1 minute if you need any help. please feel free to message me, thank you
Бинарный индикатор находит свечной паттерн "Поглощение" и рисует соответствующий сигнал для входа рынок. Имеет встроенные фильтры и панель для просчета количества успешных сделок. Демо версия является ознакомительной, в ней нет возможности изменять параметры. Полная версия . Особенности Работает для всех валютных пар и любых таймфреймов. Индикатор рассматривает комбинацию из 2-х или 3-х свечей в зависимости от настроек. Имеется возможность фильтровать сигналы путем настройки количества свеч
FREE
The latest most requested Binary Options arrow indicator in the Garuda Signals product line is now on MT5! Binary options signal based on multiple time frame cross over analysis. Gets confirmation from the most consistent signals known to man; Ichimoku, SMA, Bollinger Bands; and also uses the 1 Hour time frame as trend confirmation , so you don't have to open up multiple chart and waste time. - Can be used for all time frames up to 1 hour, but is most POWERFUL for 1 and 5 min options. - Place yo
Naked Forex Kangaroo Tail Pro Indicator Kangaroo Tail Pro Indicator is a pattern recognition indicator for Forex, Stocks, Indices, Futures, Commodities and Cryptos. The Kangaroo Tail is a multi-bar pattern. The Kangaroo Tail pattern is very effective and is very simple to trade. The strategy that comes with the Kangaroo Tail is based on price action. The indicator does what it was designed for: displaying Kangaroo Tail patterns.     Don't expect to follow the up and down arrows and make
True Day
Aurthur Musendame
5 (1)
True Days is a tool designed specifically for the trader who wants to catch intraday volatility in price charts.  True day makes it easier for the trader to avoid trading in the dead zone - a period in time where markets are considered dead or non volatile. The trader can concentrate on finding opportunities only during periods of profound market movements. By default the indicator gives you a true day starting at 02:00 to 19:00 hours GMT+2. You can adjust according to your Time Zone. By deafult
FREE
The Binary Tend Follower indicator has been designed especially for Binary options trading. The best time frame to use the indicator on is a 1M chart with 1Min expiry's as soon as the signal candle closes. There is no need to over complicate your trading as all the thinking has been done for you. The indicator was designed as simple as possible to take out all the subjectivity of trying to follow a complicated strategy, and allowing the trader to focus on extremely simple entry's.  Buy: When the
L'indicateur construit les cotations actuelles, qui peuvent être comparées aux cotations historiques et, sur cette base, faire une prévision de l'évolution des prix. L'indicateur dispose d'un champ de texte pour une navigation rapide jusqu'à la date souhaitée. Option : Symbole - sélection du symbole que l'indicateur affichera ; SymbolPeriod - sélection de la période à partir de laquelle l'indicateur prendra des données ; IndicatorColor - couleur de l'indicateur ; HorisontalShift -
Fibrillar
Vitalii Zakharuk
It is very easy to use the Fibrillar indicator, since the simplest is to look at the chart and act according to the indications of the colored arrows. The algorithm takes into account the measurement of prices, and this method also focuses on measuring each of the price drops (H / C, H / O, LC, LO) - which gives more detailed information, but also more averaged. When calculating this indicator, logarithmic gains are first calculated at the closing price, which allows you to filter out the tre
The SyntheticaFX Boom & Crash Multi Indicator for MetaTrader 5 is an advanced trading tool designed to enhance your trading strategy by detecting potential spikes and analyzing market trends across various timeframes. This indicator is specifically tailored for the Crash and Boom indices, providing timely alerts and essential trend information to help you make informed trading decisions. Key Features: 1. Spike Detection:     - Identifies potential spikes on the following indices and timefra
Le Capteur de Tendance : La Stratégie du Capteur de Tendance avec Indicateur d'Alerte est un outil d'analyse technique polyvalent qui aide les traders à identifier les tendances du marché et les points d'entrée et de sortie potentiels. Elle présente une stratégie dynamique de Capteur de Tendance, s'adaptant aux conditions du marché pour une représentation visuelle claire de la direction de la tendance. Les traders peuvent personnaliser les paramètres selon leurs préférences et leur tolérance
FREE
Scalping and Binary Signal Detector - Indicateur de scalping qui donne des signaux directionnels pour l'ouverture de positions le long de la tendance. L'indicateur est un système de trading complet qui peut être utilisé pour le Forex et les options binaires. Le système d'algorithmes vous permet de reconnaître des mouvements de prix intenses sur plusieurs barres consécutives. L'indicateur fournit plusieurs types d'alertes pour les flèches. Fonctionne sur tous les instruments de trading et dél
Hello There, Today I want to show you my new researchable fore BUY SELL indicator, it work all asset, and also work Derive Volatility asset! it work all time frame, but i recommend start 5 minute to H1 when you receive a signal just take trade and stay wait for your take profit asset All Major Pair And minor IT WORK ALSO XAUUSD Fantastic results,  for more info,,, message us thank you   
Tops and Bottoms Indicator
Josue De Matos Silva
4.67 (6)
Tops & Bottoms Indicator FREE   Tops abd Bottoms:   An effective indicator for your trades The tops and bottoms indicator helps you to find  ascending and descending channel formations with indications of ascending and/or descending tops and bottoms. In addition, it  show possibles  opportunities with a small yellow circle when the indicator encounters an impulse formation. This indicator provide to you  more security and speed in making entry decisions. Also test our FREE advisor indicator:
FREE
Adjustable Consecutive Fractals  looks for 2 or more fractals in one direction and sends out a on screen alert, sound alert and push notification, for strong reversal points . Adjustable Consecutive Fractals, shows the fractals on chart along with a color changing text for buy and sell signals when one or more fractals appear on one side of price. Adjustable Consecutive Fractals is based Bill Williams Fractals . The standard Bill Williams fractals are set at a non adjustable 5 bars, BUT withe
Forex Ballin Remastered
Allistair Kabelo Mandow
We proudly introduce the Forex Ballin Remastered trading system, your key to financial freedom.   Developed by a team of experienced traders with trading experience of over 13 years . IMPORTANT! After the purchase please send me a private message to receive the installation manual and the setup instructions. Buy Forex Ballin Remastered and you could get Market Breaker,  Tinga Tinga EA  for free !*** Ask in private for more details. *Promotional Price:  $ 1199 . The price will increase by $ 5
Limitless MT5
Dmitriy Kashevich
Limitless MT5 is a universal indicator suitable for every beginner and experienced trader. works on all currency pairs, cryptocurrencies, raw stocks Limitless MT5 - already configured and does not require additional configuration And now the main thing Why Limitless MT5? 1 complete lack of redrawing 2 two years of testing by the best specialists in trading 3 the accuracy of correct signals exceeds 80% 4 performed well in trading during news releases Trading rules 1 buy signa
Crypto to MT5
Rajesh Kumar Nait
Crypto.com à MT5 Flux de bougies en direct vers Metatrader 5 à partir du websocket Crypto.com C'est une donnée de taux en direct OHCLV (Open High Low Close Real Volume)  commerçants, si dans un graphique minute, les données OHLC ne sont pas correctes, elles peuvent donner une mauvaise analyse dans l'étude graphique technique, ce produit garantit qu'il fournit des données précises en temps réel qui peuvent aider à l'analyse manuelle vous pouvez vérifier mon autre produit crypto sur mon p
Binary Absorption
Bogdan Kupinsky
5 (1)
Бинарный индикатор находит свечной паттерн "Поглощение" и рисует соответствующий сигнал для входа рынок. Имеет встроенные фильтры и панель для просчета количества успешных сделок. Особенности Работает для всех валютных пар и любых таймфреймов. Индикатор рассматривает комбинацию из 2-х или 3-х свечей в зависимости от настроек. Имеется возможность фильтровать сигналы путем настройки количества свечей одного цвета (тренда) до образования паттерна. Присутствует панель для отображения точности
Les acheteurs de ce produit ont également acheté
TPSpro RFI Levels MT5
Roman Podpora
4.73 (11)
INSTRUCTIONS       RUS   -   ANGLAIS       Il   est recommandé de l'utiliser avec un indicateur       -       TPSpro   TENDANCE PRO -   Version MT4         Un élément clé du trading est constitué par les zones ou les niveaux à partir desquels les décisions d'achat ou de vente d'un instrument de trading sont prises. Malgré les tentatives des principaux acteurs de dissimuler leur présence sur le marché, ils laissent inévitablement des traces. Notre tâche était d'apprendre à identifier ces traces
TrendMaestro5
Stefano Frisetti
note: this indicator is for METATRADER4, if you want the version for METATRADER5 this is the link:  https://www.mql5.com/it/market/product/108106 TRENDMAESTRO ver 2.4 TRENDMAESTRO recognizes a new TREND in the bud, he never makes mistakes. The certainty of identifying a new TREND is priceless. DESCRIPTION TRENDMAESTRO identifies a new TREND in the bud, this indicator examines the volatility, volumes and momentum to identify the moment in which there is an explosion of one or more of these data a
FxaccurateLS
Shiv Raj Kumawat
WHY IS OUR FXACCCURATE LS MT5 THE PROFITABLE ? PROTECT YOUR CAPITAL WITH RISK MANAGEMENT Gives entry, stop and target levels from time to time. It finds Trading opportunities by analyzing what the price is doing during established trends. POWERFUL INDICATOR FOR A RELIABLE STRATEGIES We have made these indicators with a lot of years of hard work. It is made at a very advanced level. Established trends provide dozens of trading opportunities, but most trend indicators completely ignore them!
Boom and Crash Trend Detector is a  Non-Repaint   MT5 trading system usually being sold for 50 0$ . Most people use this for Deriv but can be used to forex too. The boom and crash spike indicator is a spike detecting software, with Multiple features, these features include. Spike Alert ( from 10 to 100-second warning before spike) Continues spike Alert (for double or continuous spikes at a time) supports all Boom/crash Indices M6 time frame works best here . Bigger time frame trend pointer f
Maintenant 147 $ (augmentant à 499 $ après quelques mises à jour) - Comptes illimités (PCS ou Mac) Manuel d'utilisation RelicusRoad + Vidéos de formation + Accès au groupe Discord privé + Statut VIP UNE NOUVELLE FAÇON DE REGARDER LE MARCHÉ RelicusRoad est l'indicateur de trading le plus puissant au monde pour le forex, les contrats à terme, les crypto-monnaies, les actions et les indices, offrant aux traders toutes les informations et tous les outils dont ils ont besoin pour rester renta
CET INDICATEUR, BASÉ SUR L'INTELLIGENCE ARTIFICIELLE, identifie les points de retournement possibles du marché en lisant l'empreinte, et signale À L'AVANCE les petits mouvements du marché avant qu'ils ne se produisent. Contrairement aux indicateurs de prix et de volume, qui génèrent des entrées « tardives », c'est-à-dire lorsqu'une confirmation de prix ou de volume a déjà eu lieu sur un changement de direction, et donc souvent le mouvement est déjà terminé, cet indicateur signale, en fonction d
How to use Pair Trading Station Pair Trading Station is recommended for H1 time frame and you can use it for any currency pairs. To generate buy and sell signal, follow few steps below to apply Pair Trading Station to your MetaTrader terminal. When you load Pair Trading Station on your chart, Pair Trading station will assess available historical data in your MetaTrader platforms for each currency pair. On your chart, the amount of historical data available will be displayed for each currency pai
IVISTscalp5
Vadym Zhukovskyi
5 (5)
Nous vous présentons l'indicateur iVISTscalp5, qui est non seulement unique, mais également efficace dans les opérations de trading. Cet indicateur est basé sur des données temporelles et est le résultat de nombreuses années d'expérience et d'analyse approfondie des marchés financiers. L'indicateur iVISTscalp5 est un excellent outil pour le trading manuel. La commodité, la simplicité et la visualisation - toute la complexité est cachée à l'intérieur. Nous avons simplifié au maximum les paramètre
Bill Williams Advanced
Siarhei Vashchylka
5 (8)
Bill Williams Advanced is designed for automatic chart analysis using Bill Williams' "Profitunity" system. The indicator analyzes four timeframes at once. Manual (Be sure to read before purchasing) Advantages 1. Automatically analyzes the chart using the "Profitunity" system of Bill Williams. The found signals are placed in a table in the corner of the screen. 2. Equipped with a trend filter based on the Alligator indicator. Most of the system signals are recommended to be used only accordi
Elliot Waves Analyzer Pro
Viktor Weidenthal
2.67 (3)
Elliot Waves Analyzer Pro calculates Elliot Waves to Help Identify Trend direction and Entry Levels. Mainly for Swing Trading Strategies. Usually one would open a Position in trend direction for Wave 3 or a Correction for Wave C . This Indicator draws Target Levels for the current and next wave. Most important Rules for Elliot Wave Analysis are verified by the Indicator.  The Pro version analyzes Multiple Timeframes and shows the Subwaves and Target-Levels.   For an Overview  " Elliot Waves Anal
Go Way TREND
Ywsf Hsyn Hmad Alrsh
Suivez la tendance. Oui, attendez le signal d'entrée, qu'il soit d'achat ou de vente, sur une image de 15 minutes, et vérifiez le signal s'il apparaît sur une image de 30 minutes (il faut parfois une heure ou plus pour que le signal apparaisse. Vous pouvez revenir au cadre de 15 minutes et revenez au cadre de 30 minutes, et répétez cette opération jusqu'à ce que le signal principal apparaisse pour vous. Si le signal apparaît sur le cadre de 30 minutes, entrez avec le prix et le profit est pris
Currently, the product's selling price is over $480; however, we are offering a monthly rental system for only $30. This allows many people to enjoy and experience our products during this launch stage, which will likely lead to positive reviews from users, making it more enjoyable | We hope that if there are more than 10 positive reviews, the GOOD NEWS is that the next use will last for 3 months at a fixed price of only $30 | Take advantage of our promo opportunity, before it goes back to sell
Introduction to X3 Chart Pattern Scanner X3 Cherart Pattern Scanner is the non-repainting and non-lagging indicator detecting X3 chart patterns including Harmonic pattern, Elliott Wave pattern, X3 patterns, and Japanese Candlestick patterns. Historical patterns match with signal patterns. Hence, you can readily develop the solid trading strategy in your chart. More importantly, this superb pattern scanner can detect the optimal pattern of its kind. In addition, you can switch on and off individu
Piranha version 2
Maria Strudov
5 (1)
"Piranha" - an autonomous trading system that determines overbought and oversold levels on the chart. Red and blue zones represent overbought and oversold levels respectively. Entry points are marked with arrows: a downward arrow in the red zone for "sell" and an upward arrow in the blue zone for "buy". The Take profit level is indicated by the green moving average. Key features: Adjusting the Take profit level as the green moving average changes position. Averaging ability when a new market e
The iChannels
BeeXXI Corporation
5 (2)
Ultra-fast recognition of parabolic channels (as well as linear, horizontal and wavy channels) throughout the depth of history, creating a hierarchy of channels. Required setting: Max bars in chart: Unlimited This indicator is designed primarily for algorithmic trading, but can also be used for manual trading.  This indicator will have a very active evolution in the near future and detailed descriptions on how to apply to create robots
Introducing the Power Trade Plus indicator designed by a small group of traders with a few years of experience trading the market profitably.  The Power Trade Plus is derived from the Power Trade indicator,  the indicator strive in powerful sniper entries and take profit levels,  with an algorithm that's can determine the markets volatility and Provides entries based on the current market volatility. This indicator is much more effective in stock ,currencies and indices.
SMCpro
Arief
5 (1)
Currently Price  20% OFF  ( for unlimited use ) Indicator   USER MANUAL , trade setups, solving issues, etc :  Direct Download Here     (  for users only  ) Hello World! Introducing.. SMCpro tool and Indicator for  MetaTrader 5 , a cutting-edge feature designed to revolutionize your trading experience. With innovative ICT Smart Money Concept, you gain unparalleled insight into market dynamics, empowering you to make informed trading decisions like never before. SMC Indicator built on th
Elliott Wave Trend was designed for the scientific wave counting. This tool focuses to get rid of the vagueness of the classic Elliott Wave Counting using the guideline from the template and pattern approach. In doing so, firstly Elliott Wave Trend offers the template for your wave counting. Secondly, it offers Wave Structural Score to assist to identify accurate wave formation. It offers both impulse wave Structural Score and corrective wave Structure Score. Structural Score is the rating to sh
L'oscillateur de l'indice de précision (Pi-Osc) de Roger Medcalf de Precision Trading Systems La version 2 a été soigneusement recodée pour être ultra-rapide à charger sur votre graphique, et quelques autres améliorations techniques ont été incorporées pour améliorer l'expérience. Le Pi-Osc a été créé pour fournir des signaux de synchronisation de trading précis conçus pour trouver des points d'épuisement extrêmes, les points auxquels les marchés sont contraints d'aller simplement pour élim
Matreshka
Dimitr Trifonov
5 (1)
Matreshka self-testing and self-optimizing indicator: 1. Is an interpretation of the Elliott Wave Analysis Theory. 2. Based on the principle of the indicator type ZigZag, and the waves are based on the principle of interpretation of the theory of DeMark. 3. Filters waves in length and height. 4. Draws up to six levels of ZigZag at the same time, tracking waves of different orders. 5. Marks Pulsed and Recoil Waves. 6. Draws arrows to open positions 7. Draws three channels. 8. Notes support and re
Introduction Excessive Momentum Indicator is the momentum indicator to measure the excessive momentum directly from raw price series. Hence, this is an extended price action and pattern trading. Excessive Momentum Indicator was originally developed by Young Ho Seo. This indicator demonstrates the concept of Equilibrium Fractal Wave and Practical Application at the same time. Excessive Momentum detects the market anomaly. Excessive momentum will give us a lot of clue about potential reversal and
Dragon Multi Indicator MT5
Mansour Babasafary
5 (5)
3 Indicators in 1 indicator Strategy based on price action Made specifically for the best forex currency pairs Can be used in the best time frame of the market at a very reasonable price This indicator is basically 3 different indicatos . But we have combined these 3 indicators in 1 indicator so that you can use 3 indicators at the lowest price. All three strategies are based on price action. But based on different trends. Long term, medium term and short term Attributes : No repaintin
VTrende Pro
Andrii Diachenko
5 (1)
VTrende Pro - MTF indicator for trend trading with a display panel for MT5 *** Videos can be translated into any language using subtitles (video language - Russian) Although the signals of the VTrende Pro indicator can be used as signals of a full-fledged trading system, it is recommended to use them in conjunction with the Bill Williams TS. VTrende Pro is an extended version of the VTrende indicator. Difference between Pro version and VTrende: - Time zones - Signal V - signal 1-2 waves
All in One package includes the  Oscillator Predictor ,  MACD Predictor ,  Thrust Scanner  and  Advanced Fibonacci  indicators which are mandatory for applying  Dinapoli  trade plans.  Please visit below links for detailed explanations of indicators. Advanced Fibonacci Indicator =>  https://www.mql5.com/en/market/product/107933 Thrust Scanner Indicator =>  https://www.mql5.com/en/market/product/52829 Overbought /Oversold Predictor indicator => https://www.mql5.com/en/market/product/52628 Macd
Limited Offer:    Take advantage of our limited-time offer on the FxBears Powers Indicator! When you purchase this powerful tool, you'll also receive the renowned FxBears EA, an expert advisor that automatically executes the indicator's signals. Don't miss out on this unbeatable combination to enhance your trading strategy! No more losses with this indicator, test it for years ago and see if there is losses in one day results. but before testing it please see the explaining video down here. 
Contact us to receive a comprehensive user guide after purchasing. William Delbert Gann, commonly known as W.D. Gann, was an exceptional market analyst renowned for his unique trading style in the early 20th century.  His trading techniques were based on a blend of mathematics, geometry, astrology, and ancient mathematics. Gann believed that stock market movements followed specific patterns and cycles, rather than being random. His methodologies, celebrated for their accuracy and relevance, con
The indicator is designed to close positions on the market in time. For example: to take profits ahead of schedule if the price has not reached TakeProfit, and the market is turning around. The indicator analyzes the momentum, not the trend. He does not give any information about the trend. The indicator is well suited for finding divergence. The Ershov 38 Parrots indicator dynamically adjusts to the market and detects price movement impulses of medium and high amplitude. It almost does not rea
VIP Buy Sell Signals
Hapu Arachchilage Tharindu Lakmal
Here is a Live DEMO testing account for the indicator. ( Profit proofs ) Login (MT5) - 100246 Server - FusionMarkets-Demo Investor PW - VIPindicator@2024 Contact me through this email aaddress to download the FREE strategy PDF for this indicator tharindu999lakmal@gmail.com Introduction   The   "Buy Sell Signals"   is designed to provide BUY and SELL trade signals based on the current market conditions.   A   Profitable   Trading Strategy   (Chee sheet)   is provided for this trading indicato
L'indicateur génère des signaux d'entrée pour les OPTIONS BINAIRES, en dessinant une flèche sur le graphique et en émettant une alerte sonore. HEURES D'OUVERTURE : 6h00 GMT/ 17h00 GMT (déconseillé après 17h00 GMT et pendant la nuit en raison d'une volatilité trop faible et d'un manque de volumes) PAIRES : EUR/USD (@EU6), GBP/USD (BP6). Durées : 1,2,3,5,10,15 minutes Meilleur temps : 3 minutes EXPIRATION : 1 bougie L'indicateur a besoin de volumes réels (pas de volumes de ticks) pour f
EQ Cutrim Theory
Marco Aurelio Santos Costa
Ronal Cutrim has been a dedicated mathematician for 14 years and has more than 10 years of experience in the financial market. The concept of the theory is simple, find imbalance between buyers and sellers. Which makes a lot of sense, because nothing goes up forever, nothing falls forever.   When you find an asset with a mathematical probability of unbalanced equilibrium, it is a great way to get into trading:  TUTORIAL: Turn on the subtitles, the video is subtitled
Filtrer:
zbairen985
440
zbairen985 2023.02.25 12:59 
 

This software product is great. But there is a question to ask the author:in my chart, only three lines are shown above and only three lines are shown below. How can we achieve the six lines above and six lines below? Please give me a solution! Thanks a lot!

Thapelo Kapwe
276
Réponse du développeur Thapelo Kapwe 2023.03.06 19:46
Thank you for your review . For you to have 6 lines you need to add the indicator twice in a chart. with the following setting for the lines steps 1) when you add it for the first time leave the default line steps as 5,7,10
2) when you add it for the second time go to the inputs and change the line steps to 6,8,9 3) you can be flexible and change the line steps to any number which is not listed on the defaults for your own experiments and best setup let me know if you have managed
Répondre à l'avis