• Aperçu
  • Avis
  • Commentaires
  • Nouveautés

UR FrontEndBackEnd

UR FrontEndBackEnd
 

UR FrontEndBackEnd est ma formule préférée pour trouver les niveaux de support et de résistance les plus précis. Je les ai également divisés en différentes catégories (lignes pointillées, lignes pleines et zones) pour marquer leur force. Tout est stocké dans des tampons afin qu'ils soient faciles d'accès et implémentés dans d'autres outils.

Ajout : L'outil peut devoir être ajusté à l'actif sur lequel il est appliqué - les actifs diffèrent en termes de nombre de chiffres dans le prix qui affecte l'outil. Les paramètres nécessaires pour cela sont fournis dans les paramètres.


Avantages d'utiliser UR FrontEndBackEnd :

Juste 2 paramètres pour définir la densité et la distance des calculs
Les supports et les résistances sont stockés dans des tampons, croissant/décroissant à partir du prix auquel nous sommes sur l'actif donné
3 types de lignes pour un retour visuel rapide sur la force des lignes de support/résistance -> DASHED, SOLID et AREA
Il y a un chat spécial par télégramme sur lequel vous pouvez rester au courant des mises à jour des outils et également envoyer une demande si vous pensez qu'il manque quelque chose !


Pourquoi UR FrondEndBackEnd ?

C'est l'indicateur de support/résistance le plus facile à utiliser et à configurer - et aussi à implémenter dans d'autres outils - toutes les données sont facilement lisibles et stockées dans 4 tampons.

Comment utiliser UR FrondEndBackEnd ?

Voir la description ci-dessous pour en savoir plus :
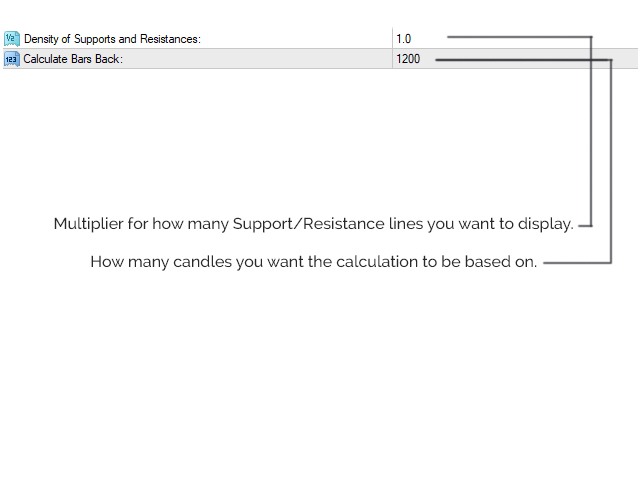

PARAMÈTRES
Densité : décide du nombre de lignes à calculer
Barres en arrière : Jusqu'où l'indicateur doit-il aller sur le graphique et prendre les données des bougies pour effectuer les calculs correspondants
AFFICHER

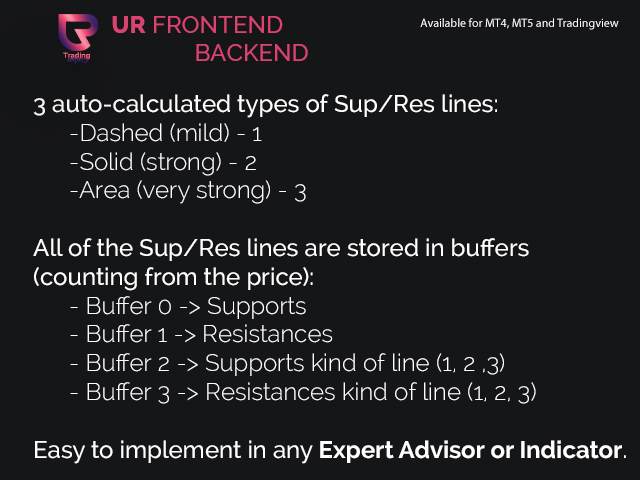
Ligne pointillée : Support/résistance légers (1)
Ligne continue : Fort support/résistance (2)
Ligne de zone : Très fort support/résistance (3)
Toutes les lignes au-dessus du prix sont colorées en rouge et toutes les lignes en dessous du prix sont colorées en bleu


AJOUT

Toutes les données sont stockées dans 4 tampons :
- Buffer 0 -> Lignes de support commençant le prix vers le bas
- Buffer 1 -> Lignes de résistance faisant monter le prix
- Tampon 2 -> Force de la ligne de support (1, 2, 3)
- Tampon 3 -> Force de la ligne de résistance (1, 2, 3)
Produits recommandés
This   Rattling Signal Point   indicator is designed for signal trading. This indicator generates trend signals. It uses many algorithms and indicators to generate this signal. It tries to generate signals from the points with the highest trend potential. This indicator is a complete trading product. This indicator does not need any additional indicators. The indicator is never repainted. The point at which the signal is given does not change. When the signal comes the arrows are put back
Real Magic Trend
Muhammed Emin Ugur
This   Real Magic Trend   indicator is designed for signal trading. This indicator generates trend signals. It uses many algorithms and indicators to generate this signal. It tries to generate signals from the points with the highest trend potential. This indicator is a complete trading product. This indicator does not need any additional indicators. The indicator is never repainted. The point at which the signal is given does not change.      Features and Recommendations Time Frame
The new update makes this indicator a complete tool for studying, analyzing and operating probabilistic patterns. It includes: On-chart Multi-asset percentage monitor. Configurable martingales. Twenty-one pre-configured patterns , including Mhi patterns and C3. An advanced pattern editor to store up to 5 custom patterns. Backtest mode to test results with loss reports. Trend filter. Hit operational filter. Martingale Cycles option. Various types of strategies and alerts. Confluence between patte
The indicator shows you buy/sell signals and does not repaint. It works well with almost all pairs, while the best ones are GBPUSD, XAUUSD and EURUSD. The product works better on H1 and H4. You can change the parameters in the inputs tab to get the best signals and the best trade results on each pair. You can enable/disable alerts when signal appears. The indicator is easy to use. Parameters barstrip & Sensitive: amount of bars to process the highest and lowest prices (relates to the internal
The   True Magic Oscillator   indicator is designed for signal trading. This indicator generates trend signals. It uses many algorithms and indicators to generate this signal. It tries to generate signals from the points with the highest trend potential. This indicator is a complete trading product. This indicator does not need any additional indicators. The indicator is never repainted. The point at which the signal is given does not change.         Features and Recommendations Wor
Signal Tower   indicator is designed for signal trading. This indicator generates trend signals. It uses many algorithms and indicators to generate this signal. It tries to generate a signal from the points with the highest trend potential. This indicator is a complete trading product. This indicator does not need any additional indicators. The indicator certainly does not repaint. The point at which the signal is given does not change. The indicator has a pips counter. You can see how
Real Pro Signal
Muhammed Emin Ugur
Real Pro Signal   indicator is designed for signal trading. This indicator generates trend signals. It uses many algorithms and indicators to generate this signal. It tries to generate a signal from the points with the highest trend potential. This indicator is a complete trading product. This indicator does not need any additional indicators. The indicator certainly does not repaint. The point at which the signal is given does not change.     Features and Suggestions Time Frame: H1 W
VR Cub
Vladimir Pastushak
VR Cub est un indicateur permettant d'obtenir des points d'entrée de haute qualité. L'indicateur a été développé pour faciliter les calculs mathématiques et simplifier la recherche de points d'entrée dans un poste. La stratégie de trading pour laquelle l'indicateur a été rédigé prouve son efficacité depuis de nombreuses années. La simplicité de la stratégie de trading est son grand avantage, qui permet même aux traders débutants de négocier avec succès avec elle. VR Cub calcule les points d'ouve
Owl smart levels
Sergey Ermolov
4.63 (54)
Version MT5  |  FAQ L' indicateur Owl Smart Levels   est un système de trading complet au sein d'un seul indicateur qui comprend des outils d'analyse de marché populaires tels que   les fractales avancées de Bill Williams , Valable ZigZag qui construit   la structure d'onde correcte   du marché et   les niveaux de Fibonacci   qui marquent les niveaux exacts d'entrée. sur le marché et les endroits où prendre des bénéfices. Description détaillée de la stratégie Mode d'emploi de l'indicateur Conse
Happy Trend Arrow
Muhammed Emin Ugur
This   Happy Trend Arrow   indicator is designed for signal trading. This indicator generates trend signals. It uses many algorithms and indicators to generate this signal. It tries to generate signals from the points with the highest trend potential. This indicator is a complete trading product. This indicator does not need any additional indicators. The indicator is never repainted. The point at which the signal is given does not change.       Features and Recommendations Time Fra
BinaryFiesta
Andrey Spiridonov
The BinaryFiesta indicator has been developed and adapted specifically for trading short-term binary options. The algorithm of the indicator analyzes numerous factors before generating a signal. The indicator is installed in the conventional way. The indicator consists of an information window, which displays the name of the trading instrument, support and resistance levels, and the signal itself ( BUY , SELL or WAIT ). A signal is accompanied by a sound and a pop-up Alert. Advantages of the i
The Th3Eng PipFinite indicator is based on a very excellent analysis of the right trend direction with perfect custom algorithms. It show the true direction and the best point to start trading. With StopLoss point and Three Take Profit points. Also it show the right pivot of the price and small points to order to replace the dynamic support and resistance channel, Which surrounds the price. And Finally it draws a very helpful Box on the left side on the chart includes (take profits and Stop loss
This indicator monitors the market for a flat state and possible breakout. The flat state is detected as a predefined number of consecutive bars during which price fluctuates inside a small range. If one of the next bars closes outside the range, breakout is signaled. The indicator shows 3 lines: blue - upper bound of flat ranges AND consecutive breakout areas; red - lower bound of flat ranges AND consecutive breakout areas; yellow - center of flat ranges (NOT including breakout areas). When a b
Nice Stable Arrow
Muhammed Emin Ugur
Nice Stable Arrow   indicator is designed for signal trading. This indicator generates trend signals. It uses many algorithms and indicators to generate this signal. It tries to generate a signal from the points with the highest trend potential. This indicator is a complete trading product. This indicator does not need any additional indicators. The indicator certainly does not repaint. The point at which the signal is given does not change. Signals are sent at the beginning of new candle
Credible Cross System   indicator is designed for signal trading. This indicator generates trend signals. It uses many algorithms and indicators to generate this signal. It tries to generate a signal from the points with the highest trend potential. The indicator works based on instant price movements. This indicator is a complete trading product. This indicator does not need any additional indicators. The indicator certainly does not repaint. The point at which the signal is given does not
The main idea of this indicator is rates analysis and prediction by Fourier transform. Indicator decomposes exchange rates into main harmonics and calculates their product in future. You may use the indicator as a standalone product, but for better prediction accuracy there is another related indicator - FreqoMaster - which uses FreqoMeterForecast as a backend engine and combines several instances of FreqoMeterForecast for different frequency bands. Parameters: iPeriod - number of bars in the ma
Chart Patterns Detect 15 patterns (Ascending Triangle, Descending Triangle, Rising Wedge, Falling Wedge, Bullish Flag, Bearish Flag, Bullish Rectangle, Bearish Rectangle Symmetrical triangle, Head and Shoulders, Inverted Head and Shoulders, Triple top, Triple Bottom, Double Top, Double Bottom) Use historical data to calculate the probability of each pattern to succeed (possibility to filter notification according to the chance of success) gives graphic indication about the invalidation level and
Next Trend Pro
Eduard Bartashevich
Next Trend Pro INDICATOR - the best trend indicator on the market, the indicator works on all timeframes and assets, the indicator is built on the basis of 12 years of experience in forex and many other markets. You know that many trend indicators on the internet are not perfect, late and difficult to trade with, but the Next Trend Pro indicator is different, the Next Trend Pro indicator shows a buy or sell signal, colored candles confirm the signal, and support levels and resistance levels give
This indicator is customized for binary option trading like M1 timeframe or turbo option trading. The way a binary option works is from the traders perspective is that you choose whether or not a certain underlying asset (a stock, commodity, currency etc.) is going to go up or down in a certain amount of time. You essentially bet money on this prediction. You are shown how much money up front you will earn if your prediction is correct. If your prediction is wrong, you lose your bet and the mone
Trend PA
Mikhail Nazarenko
5 (3)
The Trend PA indicator uses   Price Action   and its own filtering algorithm to determine the trend. This approach helps to accurately determine entry points and the current trend on any timeframe. The indicator uses its own algorithm for analyzing price changes and Price Action. Which gives you the advantage of recognizing, without delay, a new nascent trend with fewer false positives. Trend filtering conditions can be selected in the settings individually for your trading style. The indicator
Master Scalping M1 est un indicateur innovant qui utilise un algorithme pour déterminer rapidement et avec précision la tendance. L'indicateur calcule le temps d'ouverture et de fermeture des positions, les algorithmes de l'indicateur vous permettent de trouver les moments idéaux pour entrer dans une transaction (acheter ou vendre un actif), ce qui augmente le succès des transactions pour la plupart des commerçants. Avantages de l'indicateur : Facile à utiliser, ne surcharge pas le graphique ave
Pro Magic Signal   indicator is designed for signal trading. This indicator generates trend signals.  It uses many algorithms and indicators to generate this signal. It tries to generate a signal from the points with the highest trend potential. This indicator is a complete trading product. This indicator does not need any additional indicators.  The indicator certainly does not repaint. The point at which the signal is given does not change.  Thanks to the alert features you can get the signals
Trend Monitor
Pavel Zamoshnikov
4.2 (5)
The indicator generates early signals basing on ADX reading data combined with elements of price patterns. Works on all symbols and timeframes. The indicator does not redraw its signals. You see the same things on history and in real time. For better visual perception signals are displayed as arrows (in order not to overload the chart). Features Easy to use. Filter configuration only requires selection of sensitivity in the " Sensitivity of the indicator " input. Signals can be filtered usin
ZhiBiCCI MT4
Qiuyang Zheng
5 (1)
[ZhiBiCCI] indicators are suitable for all cycle use, and are also suitable for all market varieties. [ZhiBiCCI] Green solid line is a reversal of bullish divergence. The green dotted line is a classic bullish divergence. [ZhiBiCCI] The solid line to the red is a reverse bearish divergence. The red dotted line is a classical bearish divergence. [ZhiBiCCI] can be set in the parameters (Alert, Send mail, Send notification), set to (true) to send instant signals to the alarm window, email, in
Aspara111
Gesang Pangestu
This indicator allows you to trade binary options and specially programmed to get the momentum to follow the trend that is happening in the live market. This indicator is based on trend strength, price correction and advanced technical analysis,this is 100% NO REPAINT. This indicators specifically for manual trading, I suggest using a platform that uses an expiration time    Timeframe : M1 or M5 Expired Time : 1 Candle Pair   : Any ( even better in the CAD market ) Time Session : Europe and NewY
WanaScalper MT4
Isaac Wanasolo
1 (1)
A scalping indicator based on mathematical patterns, which on average gives signals with relatively small SL, and also occasionally helps to catch big moves in the markets (more information in the video) This indicator has three main types of notifications: The first type warns of a possible/upcoming signal on the next bar The second type indicates the presence of a ready signal to enter the market/open a position The third type is for SL and TP levels - you will be notified every time price r
Infinity Trend Pro
Yaroslav Varankin
1 (1)
This is a trend indicator without redrawing Developed instead of the binary options strategy (by the color of the Martingale candlestick) Also works well in forex trading When to open trades (binary options) A signal will appear in the place with a candle signaling the current candle It is recommended to open a deal for one candle of the current timeframe M1 and M5 When a blue dot appears, open a deal up When a red dot appears, open a trade down. How to open trades on Forex. When a signal is rec
The indicator detects and displays 3 Drives harmonic pattern (see the screenshot). The pattern is plotted by the extreme values of the ZigZag indicator (included in the resources, no need to install). After detecting the pattern, the indicator notifies of that by a pop-up window, a mobile notification and an email. The indicator highlights the process of the pattern formation and not just the complete pattern. In the former case, it is displayed in the contour triangles. After the pattern is com
Future Candle One Candle is an arrow indicator of candlestick patterns, based on the calculation of historical statistics. It identifies and calculates patterns consisting of one candle. Advantages of the indicator Gives information about the next candle right now; The indicator values are based on statistical data on the history of the current instrument; Forecasts and displays the result of trading based on its signals; The colors of the indicator have been selected for a comfortable operati
Fibonacci retracement and extension line drawing tool Fibonacci retracement and extended line drawing tool for MT4 platform is suitable for traders who use  golden section trading Advantages: There is no extra line, no too long line, and it is easy to observe and find trading opportunities Trial version: https://www.mql5.com/zh/market/product/35884 Main functions: 1. Multiple groups of Fibonacci turns can be drawn directly, and the relationship between important turning points
Les acheteurs de ce produit ont également acheté
Gold Stuff
Vasiliy Strukov
4.89 (265)
Gold Stuff est un indicateur de tendance conçu spécifiquement pour l'or et peut également être utilisé sur n'importe quel instrument financier. L'indicateur ne se redessine pas et ne traîne pas. Délai recommandé H1. Au niveau de l'indicateur de travail, l'Expert Advisor EA Gold Stuff est entièrement automatique. Vous pouvez le trouver sur mon profil. Vous pouvez obtenir une copie gratuite de notre indicateur Strong Support et Trend Scanner, veuillez envoyer un message privé. moi! Contactez
Scalper Inside PRO
Alexey Minkov
4.75 (59)
An exclusive indicator that utilizes an innovative algorithm to swiftly and accurately determine the market trend. The indicator automatically calculates opening, closing, and profit levels, providing detailed trading statistics. With these features, you can choose the most appropriate trading instrument for the current market conditions. Additionally, you can easily integrate your own arrow indicators into Scalper Inside Pro to quickly evaluate their statistics and profitability. Scalper Inside
TPSpro RFI Levels
Roman Podpora
4.86 (21)
Reversal First Impulse levels (RFI)    INSTRUCTIONS        RUS       -       ENG              R ecommended to use with an indicator   -   TPSpro  TREND PRO -  Version MT5 A key element in trading is zones or levels from which decisions to buy or sell a trading instrument are made. Despite attempts by major players to conceal their presence in the market, they inevitably leave traces. Our task was to learn how to identify these traces and interpret them correctly. Main functions: Displaying activ
ACTUELLEMENT 26% DE RÉDUCTION La meilleure solution pour tout débutant ou trader expert ! Cet indicateur est un outil de trading unique, de haute qualité et abordable car nous avons incorporé un certain nombre de caractéristiques exclusives et une nouvelle formule. Avec seulement UN graphique, vous pouvez lire la force de la devise pour 28 paires Forex ! Imaginez comment votre trading va s'améliorer parce que vous êtes capable de repérer le point de déclenchement exact d'une nouvelle tendan
GOLD Impulse with Alert
Bernhard Schweigert
4.56 (9)
Cet indicateur est une super combinaison de nos 2 produits Advanced Currency IMPULSE with ALERT  +   Currency Strength Exotics . Il fonctionne pour tous les cadres temporels et montre graphiquement l'impulsion de force ou de faiblesse pour les 8 principales devises plus un symbole ! Cet indicateur est spécialisé pour montrer l'accélération de la force des devises pour tout symbole comme l'or, les paires exotiques, les matières premières, les indices ou les contrats à terme. C'est le premi
FX Power MT4 NG
Daniel Stein
5 (12)
Obtenez votre mise à jour quotidienne du marché avec des détails et des captures d'écran via notre Morning Briefing ici sur mql5 et sur Telegram ! FX Power MT4 NG est la nouvelle génération de notre très populaire indicateur de force des devises, FX Power. Et qu'est-ce que ce compteur de force de nouvelle génération offre ? Tout ce que vous avez aimé de l'original FX Power PLUS Analyse de la force de l'OR/XAU Des résultats de calcul encore plus précis Périodes d'analyse configurables individuel
Actuellement 20% de réduction ! La meilleure solution pour tout débutant ou trader expert ! Ce logiciel de tableau de bord fonctionne sur 28 paires de devises. Il est basé sur 2 de nos principaux indicateurs (Advanced Currency Strength 28 et Advanced Currency Impulse). Il donne un excellent aperçu de l'ensemble du marché Forex. Il montre les valeurs de l'Advanced Currency Strength, la vitesse de mouvement des devises et les signaux pour 28 paires de devises dans tous les (9) délais. Imagine
Atomic Analyst
Issam Kassas
5 (3)
Tout d'abord, il convient de souligner que cet indicateur de trading n'est ni repainting, ni redrawing et ne présente aucun délai, ce qui le rend idéal à la fois pour le trading manuel et automatisé. Manuel de l'utilisateur : réglages, entrées et stratégie. L'Analyste Atomique est un indicateur d'action sur les prix PA qui utilise la force et le momentum du prix pour trouver un meilleur avantage sur le marché. Équipé de filtres avancés qui aident à éliminer les bruits et les faux signaux, et à
TPSproTREND PrO
Roman Podpora
4.78 (18)
TPSpro TRENDPRO  - is a trend indicator that automatically analyzes the market and provides information about the trend and each of its changes, as well as giving signals for entering trades without redrawing! The indicator uses each candle, analyzing them separately. referring to different impulses - up or down impulse. Exact entry points into transactions for currencies, crypto, metals, stocks, indices!  -  Version MT5               DETAILED DESCRIPTION                R ecommended to use with
Indicator : RealValueIndicator Description : RealValueIndicator is a powerful tool designed specifically for trading on the EURUSD pair. This indicator analyzes all EUR and USD pairs, calculates their real currency strength values, and displays them as a single realistic value to give you a head start on price. This indicator will tell you moves before they happen if you use it right. RealValueIndicator allows you to get a quick and accurate overview of the EURUSD currency pair tops and bottoms,
Présentation       Quantum Trend Sniper Indicator   , l'indicateur révolutionnaire MQL5 qui transforme la façon dont vous identifiez et négociez les inversions de tendance ! Développé par une équipe de traders expérimentés avec une expérience commerciale de plus de 13 ans,       Indicateur Quantum Trend Sniper       est conçu pour propulser votre parcours de trading vers de nouveaux sommets grâce à sa manière innovante d'identifier les inversions de tendance avec une précision extrêmement élevée
ACTUELLEMENT 31% DE RÉDUCTION ! ! La meilleure solution pour tout débutant ou Expert Trader ! Cet indicateur est un outil de trading unique, de haute qualité et abordable car nous avons incorporé un certain nombre de caractéristiques exclusives et une formule secrète. Avec seulement UN graphique, il donne des alertes pour les 28 paires de devises. Imaginez comment votre trading s'améliorera parce que vous serez capable de repérer le point de déclenchement exact d'une nouvelle tendance ou d'
TrendMaestro
Stefano Frisetti
5 (3)
note: this indicator is for METATRADER4, if you want the version for METATRADER5 this is the link:  https://www.mql5.com/it/market/product/108106 TRENDMAESTRO ver 2.4 TRENDMAESTRO recognizes a new TREND in the bud, he never makes mistakes. The certainty of identifying a new TREND is priceless. DESCRIPTION TRENDMAESTRO identifies a new TREND in the bud, this indicator examines the volatility, volumes and momentum to identify the moment in which there is an explosion of one or more of these data a
Advanced Supply Demand
Bernhard Schweigert
4.92 (313)
CURRENTLY 26% OFF !! Best Solution for any Newbie or Expert Trader! This indicator is a unique, high quality and affordable trading tool because we have incorporated a number of proprietary features and a new formula. With this update, you will be able to show double timeframe zones. You will not only be able to show a higher TF but to show both, the chart TF, PLUS the higher TF: SHOWING NESTED ZONES. All Supply Demand traders will love it. :) Important Information Revealed Maximize the potenti
JULY OFFER 80% OFF next price for unlimited version will be 17000$. This is the only time you can get this institutional and professional indicator at this price for unlimited version. Don't dare to miss this. The tool I am about to introduce to you you can't compare it with other tools due to its strategy and accuracy level in predicting the next price directional movement . This tool is designed for serious traders who have decided to make a difference through trading. Be the next person to wi
Quantum Breakout Indicator PRO
Bogdan Ion Puscasu
4.96 (26)
Présentation       Quantum Breakout PRO   , l'indicateur révolutionnaire MQL5 qui transforme la façon dont vous négociez les zones d'évasion ! Développé par une équipe de traders expérimentés avec une expérience de trading de plus de 13 ans,   Quantum Breakout PRO   est conçu pour propulser votre parcours de trading vers de nouveaux sommets grâce à sa stratégie de zone de discussion innovante et dynamique. Quantum Breakout Indicator vous donnera des flèches de signalisation sur les zones d
FX Volume
Daniel Stein
4.61 (36)
Obtenez votre mise à jour quotidienne du marché avec des détails et des captures d'écran via notre Morning Briefing ici sur mql5 et sur Telegram ! FX Volume est le PREMIER et SEUL indicateur de volume qui fournit un VRAI aperçu du sentiment du marché du point de vue d'un courtier. Il fournit des informations impressionnantes sur la façon dont les acteurs institutionnels du marché, comme les courtiers, sont positionnés sur le marché des changes, bien plus rapidement que les rapports COT. Voir c
Cycle Sniper
Elmira Memish
4.41 (37)
NEW YEAR SALE PRICE FOR LIMITED TIME!!! Please contact us after your purchase and we will send you the complimentary indicators to complete the system Cycle Sniper is not a holy grail but when you use it in a system which is explained in the videos, you will feel the difference. If you are not willing to focus on the charts designed with Cycle Sniper and other free tools we provide, we recommend not buying this indicator. We recommend watching the videos about the indiactor and system before pu
Entry Points Pro
Yury Orlov
4.7 (226)
Indicateur supérieur pour MT4 fournissant des signaux précis pour entrer dans un trade sans repeindre ! Il peut être appliqué à tous les actifs financiers : forex, cryptocurrencies, métaux, actions, indices.  La version MT5 est ici Il fournira des signaux de trading assez précis et vous dira quand il est préférable d'ouvrir un trade et de le fermer. Regardez la vidéo (6:22) avec un exemple de traitement d'un seul signal qui a rapporté à l'indicateur ! La plupart des traders améliorent l
Volume by Price MT4
Brian Collard
4.71 (14)
The Volumebyprice.com Indicator for MetaTrader 4 features Volume Profile and Market Profile TPO (Time Price Opportunity). Volume and TPO histogram bar and line charts. Volume Footprint charts. TPO letter and block marker collapsed and split structure charts. Session filtering and grouping. Static, dynamic and flexible range segmentation and compositing methods with relative and absolute visualizations. Graphical layering, positioning and styling options to suit the user's analytic and aesthetic
AT Forex Indicator MT4
Marzena Maria Szmit
5 (2)
The AT Forex Indicator MT4 is a sophisticated trading tool designed to provide traders with a comprehensive analysis of multiple currency pairs. This   powerful indicator   simplifies the complex nature of the forex market, making it accessible for both novice and experienced traders. AT Forex Indicator uses   advanced algorithms   to detect trends, patterns and is an essential tool for traders aiming to enhance their forex trading performance. With its robust features, ease of use, and reliabl
NAM Order Blocks
NAM TECH GROUP, CORP.
5 (1)
MT4 Multi-timeframe Order Blocks detection indicator. Features - Fully customizable on chart control panel, provides complete interaction. - Hide and show control panel wherever you want. - Detect OBs on multiple timeframes. - Select OBs quantity to display. - Different OBs user interface. - Different filters on OBs. - OB proximity alert. - ADR High and Low lines. - Notification service (Screen alerts | Push notifications). Summary Order block is a market behavior that indicates order collection
PTS Precision Index Oscillator V2
PrecisionTradingSystems
5 (2)
L'oscillateur de l'indice de précision (Pi-Osc) de Roger Medcalf de Precision Trading Systems La version 2 a été soigneusement recodée pour être ultra-rapide à charger sur votre graphique, et quelques autres améliorations techniques ont été incorporées pour améliorer l'expérience. Le Pi-Osc a été créé pour fournir des signaux de synchronisation de trading précis conçus pour trouver des points d'épuisement extrêmes, les points auxquels les marchés sont contraints d'aller simplement pour élim
MTF Supply Demand Zones
Georgios Kalomoiropoulos
4.83 (23)
Nouvelle génération de zones d'approvisionnement et de demande automatisées. Algorithme nouveau et innovant qui fonctionne sur n'importe quel graphique. Toutes les zones sont créées dynamiquement en fonction de l'action des prix du marché. DEUX TYPES D'ALERTES --> 1) QUAND LE PRIX ATTEINT UNE ZONE 2) QUAND UNE NOUVELLE ZONE SE FORME Vous n'obtenez pas un indicateur inutile de plus. Vous obtenez une stratégie de trading complète avec des résultats prouvés.     Nouvelles fonctionnali
Enigmera
Ivan Stefanov
5 (4)
ENIGMERA : Le cœur du marché https://www.enigmera.com Introduction Cet indicateur et ce système de trading constituent une approche remarquable des marchés financiers. ENIGMERA utilise les cycles fractals pour calculer avec précision les niveaux de support et de résistance. Il indique la phase d'accumulation authentique et donne une direction et des objectifs.  Un système qui fonctionne que nous soyons dans une tendance ou une correction.  Comment fonctionne-t-il ? ENIGMERA comprend trois l
ZeusArrow Smart Liquidity Finder  Smart Liquidity Finder is Ai controlled indicator based on the Idea of Your SL is My Entry. It scan and draws the major Liquidity areas on chart partitioning them with Premium and Discount Zone and allows you find the best possible trading setups and help you decide the perfect entry price to avoid getting your Stop Loss hunted . Now no more confusion about when to enter and where to enter. Benefit from this one of it's kind trading tool powered by Ai an trade
Welcome to the world of SMC (Smart Money Concepts) Trading, where we empower traders with the tools and knowledge to make smarter trading decisions. Our latest addition to our suite of trading tools is the SMC Trading Pro indicator, version 1.0. Key Features: Major Market Structure Identification with BODY break. Order Block must be in Major Swing ( not Small Swing ). Order Block with Fair Value Gap Detection. Order Block in Discount | Premium zone. Filter for only Bullish, Bearish or All Order
Reversal Master
Alexey Minkov
4.92 (12)
The Reversal Master is an indicator for determining the current direction of price movement and reversal points. The indicator will be useful for those who want to see the current market situation better. The indicator can be used as an add-on for ready-made trading systems, or as an independent tool, or to develop your own trading systems. The Reversal Master indicator, to determine the reversal points,  analyzes a lot of conditions since the combined analysis gives a more accurate picture of t
A. Qu'est-ce que l'A2SR ?   * C'est un indicateur technique avancé (pas de peinture, pas de retard). -- Conseils : -- sur https://www.mql5.com/en/blogs/post/734748/page4#comment_16532516 -- et https://www.mql5.com/en/users/yohana/blog A2SR a une technique spéciale pour déterminer les niveaux de Support (demande) et de Résistance (offre). Contrairement à la manière ordinaire que nous avons vue sur le net, A2SR a un concept original pour déterminer les niveaux réels de SR. La technique origin
This indicator uses support and resistance, volume and some special formula to calculate the volume to filter the candles. If the volume reaches a specific value, And at the same time, Candle breaks the support/resistance line, There would be a signal and we can enter the market. Signals appear when the current candle closes. then you can enter the trade when a new candle appears. Please don't forget to follow your money management plan. MT5 Version Support/Resistance Breakout MT5 :   https:
Plus de l'auteur
UR Basket MT5
Krzysztof Jan Debski
Panier UR   Le mieux que vous puissiez faire est de protéger vos commandes contre les pertes. Vous pouvez maintenant vous détendre et laisser UR Basket s'en occuper. Avantages d'utiliser UR Basket : Tous les paramètres sont dynamiquement modifiables dans le panneau graphique de votre graphique - Vous n'avez PAS besoin de redémarrer l'EA pour modifier les paramètres ou rappeler les paramètres que vous avez utilisés ! Vous pouvez suivre vos commandes via :   - Nombre magique   - Commentaire
UR TradeManager MT5
Krzysztof Jan Debski
UR_TradeManager pour MetaTrader 5 Maximisez votre potentiel de trading avec UR_TradeManager, l'outil ultime d'amélioration du trading conçu spécifiquement pour la plateforme MetaTrader 4. Conçu avec précision et fonctionnalité à l'esprit, cet outil complet est essentiel pour les traders qui cherchent à élever leurs compétences d'analyse de marché, d'exécution et de gestion. Caractéristiques Clés : Tableau de Bord de Trading Visuel   : Gérez vos trades directement depuis un tableau de bord sophis
UR Control Panel
Krzysztof Jan Debski
5 (2)
Panneau de configuration UR   UR Control Panel est un outil que je veux partager avec vous GRATUITEMENT. C'est un panel interactif qui m'a aidé dans mon trading et a boosté mon analyse du marché chaque jour. J'espère que cela répondra également à vos besoins ! Comment utiliser le panneau de contrôle UR ? Il s'agit d'un double panneau mobile et redimensionnable dont : - L'un d'eux montre la force de la devise sur la période donnée - L'autre permet aux options de se déplacer entre les symbo
FREE
UR Basket
Krzysztof Jan Debski
Panier UR   Le mieux que vous puissiez faire est de protéger vos commandes contre les pertes. Vous pouvez maintenant vous détendre et laisser UR Basket s'en occuper. Avantages d'utiliser UR Basket : Tous les paramètres sont dynamiquement modifiables dans le panneau graphique de votre graphique - Vous n'avez PAS besoin de redémarrer l'EA pour modifier les paramètres ou rappeler les paramètres que vous avez utilisés ! Vous pouvez suivre vos commandes via :   - Nombre magique   - Commentaire
UR DivergenceSpotter
Krzysztof Jan Debski
UR DivergenceSpotter   UR DivergenceSpotter est le résultat de nombreuses années d'expérience et parfois les moyens les plus simples sont les meilleurs. Il y a une bonne corrélation entre quelques indicateurs, mais quand ils ne correspondent pas - le prix essaie de "se réajuster" - et c'est à ce moment-là que nous recevons un signal avec UR DivergenceSpotter. Avantages d'utiliser UR Divergence Spotter : Aucun paramètre Ne se repeint pas après la création de la bougie Signale lorsque le si
UR VolumeTrend
Krzysztof Jan Debski
Tendance volume UR   UR VolumeTrend est l'indicateur de volume le plus clair montrant la tendance en cours en termes de volume. Fonctionne parfaitement avec d'autres indicateurs, tout comme UR TrendExhaustion pour signaler les hauts et les bas locaux. Limité à seulement 2 paramètres - plus les valeurs sont élevées, plus les tendances seront longues. Les extrêmes de gradient montrent des épuisements possibles du volume pour attraper un renversement potentiel. Deux lignes - La tendance du vol
UR TrendExhaustion
Krzysztof Jan Debski
UR TrendÉpuisement   UR TrendExhaustion est la meilleure solution pour les traders qui ne veulent pas gérer les valeurs des paramètres ni d'autres configurations - c'est à la fois facile et visuellement compréhensible pour tout le monde. Avantages d'utiliser UR TrendExhaustion : Aucun paramètre Vous avez 3 lignes qui décrivent le mieux ce qui se passe sur le graphique : la ligne d'épuisement de la tendance, la ligne de l'argent de la baleine et la ligne de l'argent au détail. L'interface
UR HighsAndLows
Krzysztof Jan Debski
Hauts et bas de l'UR   UR Highs&Lows effectue une analyse approfondie du mouvement des prix et de sa volatilité, et crée un canal dans lequel le prix évolue. Ce canal se déplace maintenant comme un oscillateur et est superposé à la déviation du prix pour signaler les épuisements potentiels et les inversions possibles. Avantages d'utiliser UR Highs&Lows : Aucun paramètre Vous avez 3 lignes qui décrivent le mouvement des prix - White Line qui est une moyenne du prix et Blue Lines qui sont s
UR Momenter
Krzysztof Jan Debski
UR Momentateur   UR Momenter calcule parfaitement la dynamique du prix en corrélation avec l'épuisement du mouvement de prix représenté sous forme d'oscillateur. Par conséquent, cela nous donne des signaux très précoces d'inversions ou de retracements potentiels. Cette formule a été découverte en 2018 après l'éclatement de la bulle du marché. Avantages d'utiliser UR Momenter : Aucun paramètre Vous avez 2 lignes qui décrivent le mouvement des prix - White Line qui est l'élan du prix en cor
UR Gamma
Krzysztof Jan Debski
UR Gamma (alimenté par des calculs similaires trouvés dans les systèmes d'apprentissage automatique) UR Gamma est un outil d'analyse financière de pointe qui offre une version nouvelle et améliorée de l'indicateur classique WaveTrend. En incorporant des techniques avancées de traitement du signal numérique, UR Gamma répond à certaines des limites des algorithmes WaveTrend traditionnels et fournit une approche plus précise, robuste et dynamique pour identifier et mesurer les tendances de l'act
UR Bands
Krzysztof Jan Debski
Bandes UR (avec une formule utilisée dans les systèmes d'apprentissage automatique) UR Bands est un indicateur dérivé d'une formule qui intègre la volatilité du marché est similaire en principe à ceux utilisés dans les systèmes d'apprentissage automatique. Cette représentation mathématique des conditions de marché offre une analyse précise des tendances et de la dynamique des prix, en tenant compte de la volatilité inhérente aux marchés financiers. En incorporant la volatilité comme variable,
UR Vortex
Krzysztof Jan Debski
UR Vortex The Probabilistic UR Vortex Formula: An Accurate System for Predictive Market Analysis using Volatility and Standard Deviation Calculations. The   UR Vortex   indicator is a technical analysis tool that uses volatility and standard deviation calculations to predict potential tops and bottoms in a market. It measures the strength of a trend by calculating the distance between the current price and a moving average, and then standardizing this distance by dividing it by the average true
UR PulseScalp
Krzysztof Jan Debski
UR PulseScalp  Un indicateur de trading calibré pour les scalpers à la recherche de l'avantage ultime sur des marchés en évolution rapide UR PulseScalp est une solution de trading de pointe pour les scalpers à la recherche de l'avantage ultime sur des marchés en évolution rapide. Cet indicateur innovant est construit sur une formule scientifiquement calibrée qui combine la puissance de la volatilité, du MoneyFlow et de la force relative pour créer un signal très précis et fiable. Avantages
UR TradeManager
Krzysztof Jan Debski
UR_TradeManager pour MetaTrader 4 Maximisez votre potentiel de trading avec UR_TradeManager, l'outil ultime d'amélioration du trading conçu spécifiquement pour la plateforme MetaTrader 4. Conçu avec précision et fonctionnalité à l'esprit, cet outil complet est essentiel pour les traders qui cherchent à élever leurs compétences d'analyse de marché, d'exécution et de gestion. Caractéristiques Clés : Tableau de Bord de Trading Visuel : Gérez vos trades directement depuis un tableau de bord sophisti
UR DivergenceSpotter   UR DivergenceSpotter est le résultat de nombreuses années d'expérience et parfois les moyens les plus simples sont les meilleurs. Il y a une bonne corrélation entre quelques indicateurs, mais quand ils ne correspondent pas - le prix essaie de "se réajuster" - et c'est à ce moment-là que nous recevons un signal avec UR DivergenceSpotter. Avantages d'utiliser UR Divergence Spotter : Aucun paramètre Ne se repeint pas après la création de la bougie Signale lorsque le si
UR VolumeTrend MT5
Krzysztof Jan Debski
Tendance volume UR   UR VolumeTrend est l'indicateur de volume le plus clair montrant la tendance en cours en termes de volume. Fonctionne parfaitement avec d'autres indicateurs, tout comme UR TrendExhaustion pour signaler les hauts et les bas locaux. Limité à seulement 2 paramètres - plus les valeurs sont élevées, plus les tendances seront longues. Les extrêmes de gradient montrent des épuisements possibles du volume pour attraper un renversement potentiel. Deux lignes - La tendance du vol
UR TrendÉpuisement   UR TrendExhaustion est la meilleure solution pour les traders qui ne veulent pas gérer les valeurs des paramètres ni d'autres configurations - c'est à la fois facile et visuellement compréhensible pour tout le monde. Avantages d'utiliser UR TrendExhaustion : Aucun paramètre Vous avez 3 lignes qui décrivent le mieux ce qui se passe sur le graphique : la ligne d'épuisement de la tendance, la ligne de l'argent de la baleine et la ligne de l'argent au détail. L'interface
UR HighsAndLows MT5
Krzysztof Jan Debski
Hauts et bas de l'UR   UR Highs&Lows effectue une analyse approfondie du mouvement des prix et de sa volatilité, et crée un canal dans lequel le prix évolue. Ce canal se déplace maintenant comme un oscillateur et est superposé à la déviation du prix pour signaler les épuisements potentiels et les inversions possibles. Avantages d'utiliser UR Highs&Lows : Aucun paramètre Vous avez 3 lignes qui décrivent le mouvement des prix - White Line qui est une moyenne du prix et Blue Lines qui sont s
UR Momenter MT5
Krzysztof Jan Debski
UR Momentateur   UR Momenter calcule parfaitement la dynamique du prix en corrélation avec l'épuisement du mouvement de prix représenté sous forme d'oscillateur. Par conséquent, cela nous donne des signaux très précoces d'inversions ou de retracements potentiels. Cette formule a été découverte en 2018 après l'éclatement de la bulle du marché. Avantages d'utiliser UR Momenter : Aucun paramètre Vous avez 2 lignes qui décrivent le mouvement des prix - White Line qui est l'élan du prix en cor
UR FrontEndBackEnd   UR FrontEndBackEnd est ma formule préférée pour trouver les niveaux de support et de résistance les plus précis. Je les ai également divisés en différentes catégories (lignes pointillées, lignes pleines et zones) pour marquer leur force. Tout est stocké dans des tampons afin qu'ils soient faciles d'accès et implémentés dans d'autres outils. Ajout : L'outil peut devoir être ajusté à l'actif sur lequel il est appliqué - les actifs diffèrent en termes de nombre de chiffres
UR Gamma MT5
Krzysztof Jan Debski
UR Gamma (alimenté par des calculs similaires trouvés dans les systèmes d'apprentissage automatique) UR Gamma est un outil d'analyse financière de pointe qui offre une version nouvelle et améliorée de l'indicateur classique WaveTrend. En incorporant des techniques avancées de traitement du signal numérique, UR Gamma répond à certaines des limites des algorithmes WaveTrend traditionnels et fournit une approche plus précise, robuste et dynamique pour identifier et mesurer les tendances de l'act
UR Bands MT5
Krzysztof Jan Debski
Bandes UR (avec une formule utilisée dans les systèmes d'apprentissage automatique) UR Bands est un indicateur dérivé d'une formule qui intègre la volatilité du marché est similaire en principe à ceux utilisés dans les systèmes d'apprentissage automatique. Cette représentation mathématique des conditions de marché offre une analyse précise des tendances et de la dynamique des prix, en tenant compte de la volatilité inhérente aux marchés financiers. En incorporant la volatilité comme variable,
UR Vortex MT5
Krzysztof Jan Debski
UR Vortex MT5 The Probabilistic UR Vortex Formula: An Accurate System for Predictive Market Analysis using Volatility and Standard Deviation Calculations. The UR Vortex MT5 indicator is a technical analysis tool that uses volatility and standard deviation calculations to predict potential tops and bottoms in a market. It measures the strength of a trend by calculating the distance between the current price and a moving average, and then standardizing this distance by dividing it by the average
UR PulseScalp MT5
Krzysztof Jan Debski
UR PulseScalp MT5 Un indicateur de trading calibré pour les scalpers à la recherche de l'avantage ultime sur des marchés en évolution rapide UR PulseScalp MT5 est une solution de trading de pointe pour les scalpers à la recherche de l'avantage ultime sur des marchés en évolution rapide. Cet indicateur innovant est construit sur une formule scientifiquement calibrée qui combine la puissance de la volatilité, du MoneyFlow et de la force relative pour créer un signal très précis et fiable. Ava
Filtrer:
Aucun avis
Répondre à l'avis
Version 1.15 2024.05.16
Updated Rectangle's filling
Version 1.10 2024.05.16
Readjusted Performance and improved the Testing version