Super Bollinger Bands
- Indicateurs
- Mihail Matkovskij
- Version: 1.5
- Mise à jour: 25 janvier 2021
- Activations: 5
This is a forward-looking indicator for trading on all instruments. An advanced version of Bollinger Bands indicator created by outstanding analyst John Bollinger. One of the main differences of Super Bollinger Bands indicator from its predecessor consists in displaying upper and lower bands behavior on the middle line with some specific colors. Thus, the indicator gives a trader some visual information about trend development at the moment, and not in the past, as majority of other indicators do. It supports sending notifications by email and also as alerts.
The indicator shows the direction the price will move, and is a forward-looking to a certain extent. It also informs about moments of movement damping allowing the trader to timely orientate himself or herself and exit the market before the movement changes. When you use the Super Bollinger Bands indicator, you don't have to look at bands all the time, as their behavior is sufficiently described by the middle line.
Indicator parameters
Bands Settings
- bb_period - bands period (20)
- bb_dev - bands deviation (2)
- bb_shift - shift (0)
- bb_price - apply calculation to (Close Price)
Super Bollinger Bands Settings
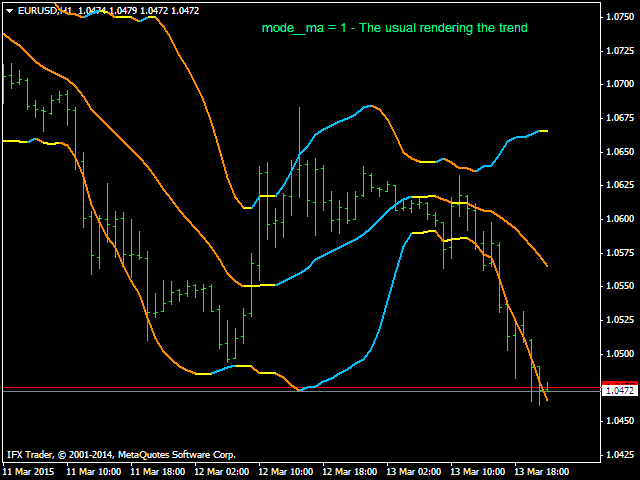
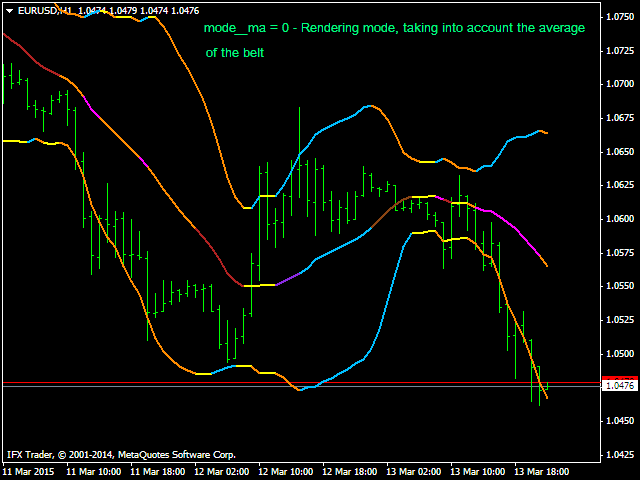
- mode_ma - moving average drawing mode. Full drawing - full drawing regarding a trend direction and a direction of bands movement. Simple drawing - regular drawing regarding a trend direction. (Full drawing)
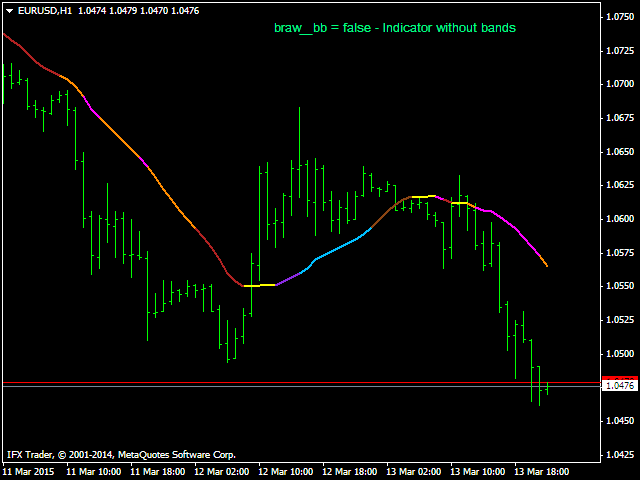
- draw_bb - show/hide bands. true - show bands. false - hide bands. (true)
- cmp_dev - acceptable error to compare characteristics in the process of drawing (0.0001)
If you increase the cmp_dev parameter, the drawing will be less sensitive; if you decrease this parameter, the indicator will draw a lot of false signals. It is recommended to set the parameter depending on the band settings and price movement.
Configuring Notifications
- signal_bar - bar to receive the signal for sending notifications (Zero bar)
- send_mail - true means receiving signal alerts by email
- send_mail_test - sending a test email notification upon indicator launch (false)
- alerts - sending alerts to notify of a signal (true)
- uptrend_accel - enable-disable the "Acceleration uptrend" signal (true)
- uptrend_fad - enable-disable the "Fading uptrend" signal (true)
- downtrend_accel - enable-disable the "Acceleration downtrend" signal (true)
- downtrend_fad - enable-disable the "Fading downtrend" signal (true)
Attention! Email notifications and alerts do not work during testing, messages to the tester Journal are written instead. The function works if alerts=true.
Settings of Lines Colors and Width
- flat_cl - color to display flat (Yellow)
- trend_up_cl - color to display downward direction (DeepSkyBlue)
- trend_down_cl - color to display upward direction (DarkOrange)
- accel_up_cl - color to display accelerating ascending trend (BlueViolet)
- fad_up_cl - color to display fading ascending trend (SaddleBrown)
- accel_down_cl - color to display accelerating descending trend (Magenta)
- fad_down_cl - color to display fading descending trend (FireBrick)
- width_lines - lines width (2)
Operation Modes
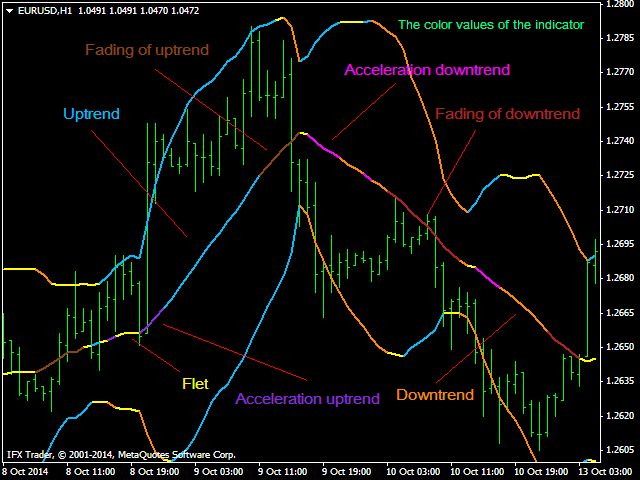
The first operation mode of the indicator: mode_ma = Full drawing - full drawing of the middle line regarding the bands movement direction. Characteristic features.
- Ascending movement accelerating: the line is painted violet (BlueViolet).
- Ascending movement fading: the middle line is painted brown (SaddleBrown) цвет.
- Descending movement accelerating: the line is painted pink (Magenta).
- Descending movement fading: the middle line is painted "fire brick" color (FireBrick).
Other lines colors show the movement direction.
- Upward movement: blue (DeepSkyBlue) color.
- Downward movement: orange (DarkOrange) color.
- Side movement: yellow color.
The second operation mode of the indicator: mode_ma = Simple drawing - drawing of the middle line movement direction without regard to bands movement and drawing of bands regarding their direction.
How to Trade
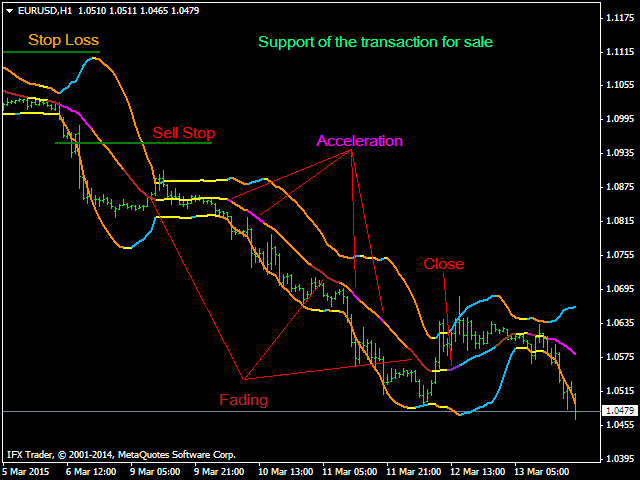
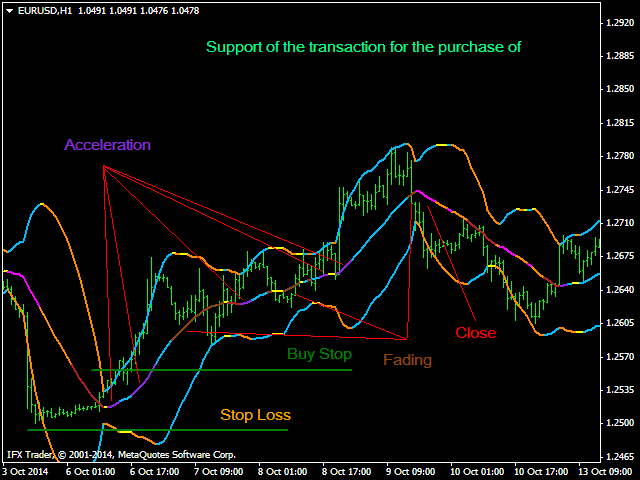
The Bollinger Bands indicator settings are performed in such a way that the main part of the price is always inside the envelope formed by bands. When the price moves closer to one of the bands or cross it, bands start expanding which allows a trader to estimate the beginning of the price movement. When the price starts moving and the bands start expanding, the indicator paints the middle line in violet for the ascending movement (accelerating ascending movement) and in pink for the descending movement (accelerating descending movement) which can be a signal to enter the market.
Following signals on the middle line can serve as exit signals: fading movement (SaddleBrown color for ascending movement or FireBrick color for descending movement), flat (yellow color of the line) and change of movement. The largest movement can be captured when the movement changes. Thereat, there might be several accelerations and fading before such change.







Пользуюсь данным индикатором пару дней, ещё толком не успел оценить весь потенциал. Однако могу сказать, что если использовать его и постоянно сидеть за компьютером, то можно добиться вполне хороших результатов, явно 5/5. Буду дальше пользоваться)