UR HighsAndLows
- Indicateurs
- Krzysztof Jan Debski
- Version: 1.15
- Mise à jour: 16 mai 2024
- Activations: 5
Hauts et bas de l'UR
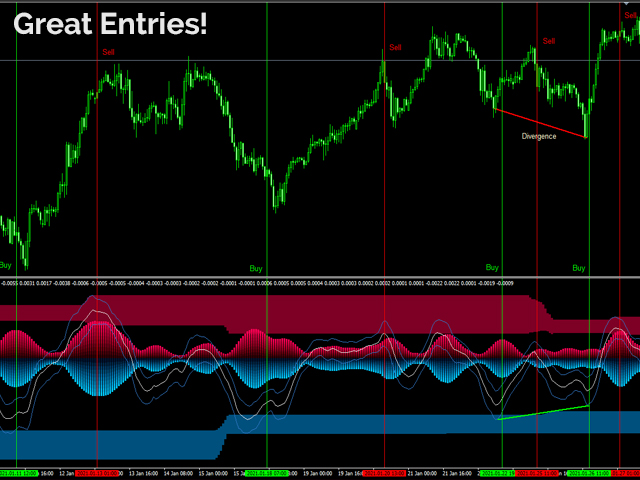
UR Highs&Lows effectue une analyse approfondie du mouvement des prix et de sa volatilité, et crée un canal dans lequel le prix évolue. Ce canal se déplace maintenant comme un oscillateur et est superposé à la déviation du prix pour signaler les épuisements potentiels et les inversions possibles.
Avantages d'utiliser UR Highs&Lows :
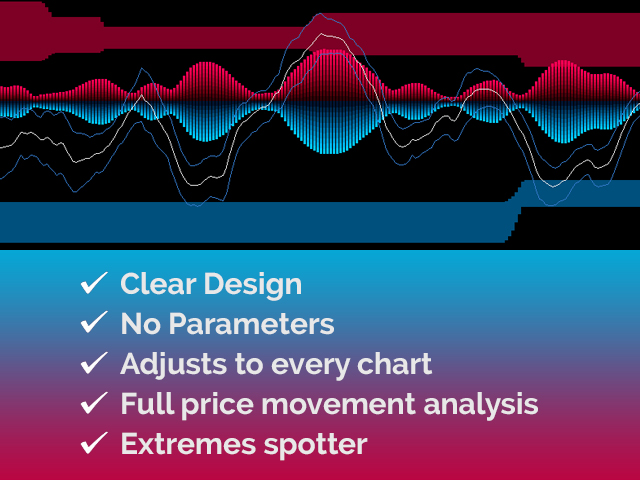
Aucun paramètre
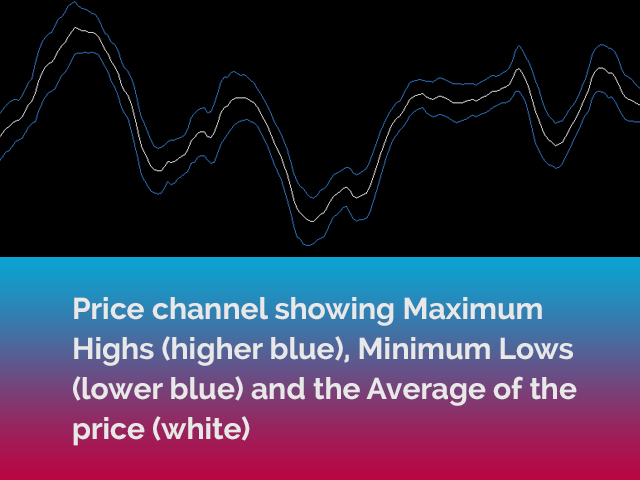
Vous avez 3 lignes qui décrivent le mouvement des prix - White Line qui est une moyenne du prix et Blue Lines qui sont ses extrêmes
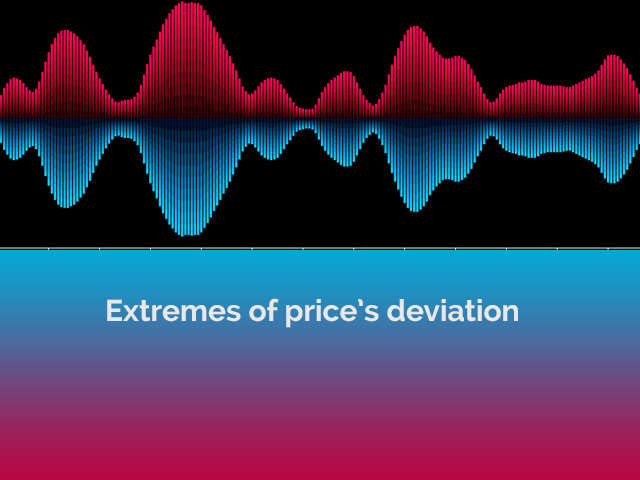
L'histogramme est une visualisation des écarts maximum dans le contexte du prix
L'interface présente l'épuisement de l'une ou l'autre des lignes aux deux extrêmes (zones supérieure rouge et inférieure bleue)
Le meilleur avantage : Facile et adapté à tous les atouts.
Il y a un chat spécial par télégramme sur lequel vous pouvez rester au courant des mises à jour des outils et également envoyer une demande si vous pensez qu'il manque quelque chose !
Pourquoi UR Highs&Lows ?
Cet indicateur peut être utilisé comme indicateur autonome, d'entrée ou de sortie. En raison de sa dépendance au prix - il peut être appliqué à tous les graphiques et son algorithme de calcul des écarts est basé sur plusieurs années d'expérience et d'observation.
Comment utiliser UR Highs&Lows ?
Voir la description ci-dessous pour en savoir plus :
PARAMÈTRES
Aucun
AFFICHER
Price Average Main Line (blanc): La moyenne du prix.
Extrêmes de prix (bleu) : canal calculé des extrêmes de prix.
Histogramme : affiche l'écart de la volatilité.
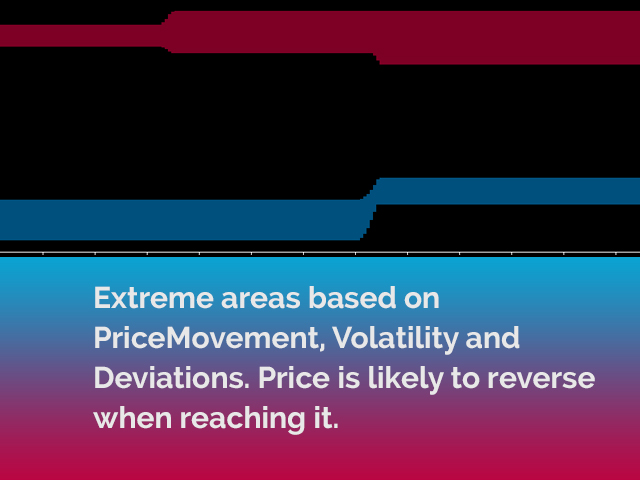
Zones extrêmes : zones où le prix s'épuise et peut s'inverser.
AJOUT
Tous mes outils fonctionnent mieux lorsqu'ils sont assemblés. Cela signifie que la précision des points d'entrée est bien meilleure si elle est utilisée avec UR DivergenceSpotter, UR VolumeTrend ou/et UR TrendExhaustion.