Sonar Mechanic
- Indicateurs
- Mykola Masalov
- Version: 2.2
- Mise à jour: 27 juillet 2023
- Activations: 5
Sonar Mechanic indicator.
| Contact me after purchase to receive my template and SonarHistogram balance of power indicator for free! |
|---|
The Sonar Mechanic indicator is a really working indicator, because it works simultaneously on three author's algorithms that correctly determine the trend and counter-trend signals for market entry.
The indicator works on all assets and timeframes.
Indicator guide here: https://www.mql5.com/en/blogs/post/750128
On gold and currency pairs, it gives good signals on the timeframe M1, M5 and M15, which allows scalping and making dozens of deals a day. This, in turn, provides valuable trading experience, because you will not get such experience performing only a few deals a week.
This indicator is ideal for beginners because they often do not have much initial capital, and scalping can provide a good dynamics of deposit increase like no other strategy.
You probably know many indicators on the market, giving weak and unclear signals that are difficult to trade with and impossible to provide any positive results.
But Sonar Mechanic indicator is devoid of these disadvantages. With its help, you will have an advantage over the market, because the quality of the signals of the indicator will make it possible. Your trading will become confident, calm and pleasant.
| Important! In the MT4 tester, it is impossible to call the multifunctional panel on the chart, this can only be done on a real chart. |
|---|
Advantages of the Sonar Mechanic indicator:
- does not redraw graphic elements, does not remove or move signals. If a signal appears on the chart, then it will remain there in the same place forever.
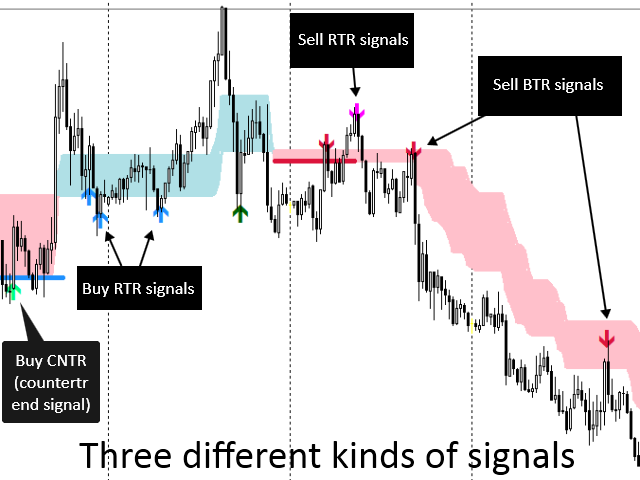
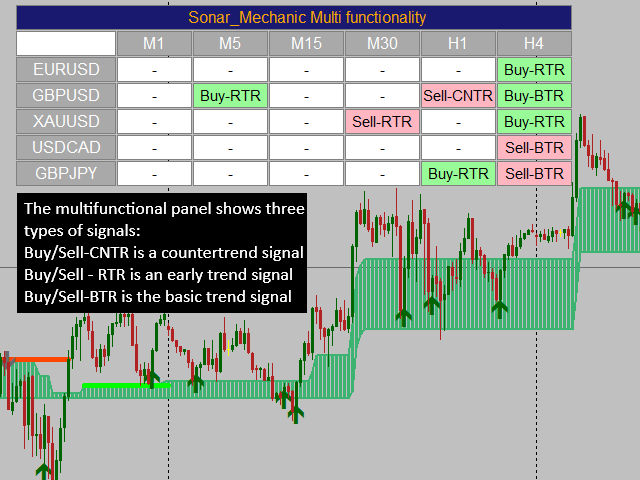
- the indicator shows three types of signals:
- countertrend - CNTR, this is the earliest signal for a possible market reversal.
- early trend - RTR, the indicator shows this signal when the market expresses a desire to turn in the opposite direction.
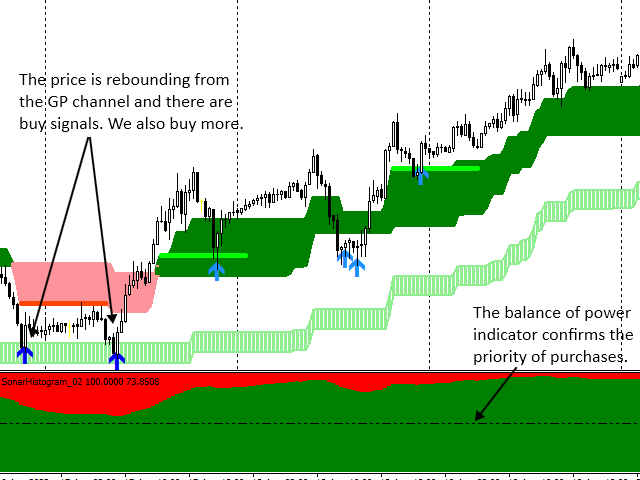
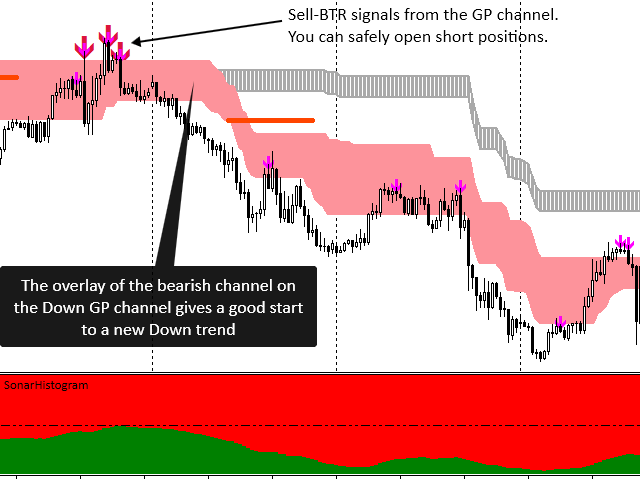
- the basic trend line is BTR, this signal is shown by the indicator on pullbacks with a clear price movement in one direction.
- each of the three indicated signals can be disabled in the indicator settings. If desired, you can choose one type of signals for trading.
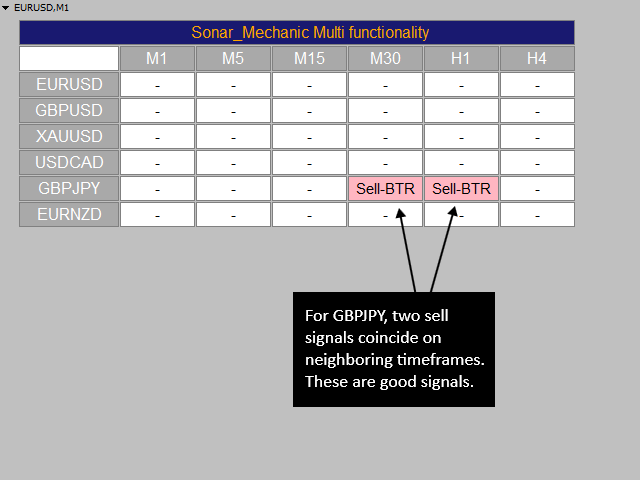
- Sonar Mechanic can work as a multi-currency indicator, simultaneously showing signals on all selected timeframes. This feature is optionally enabled in the Show Panel variable settings.
- Using this indicator, you can trade all available assets with any broker in the MT4 terminal.
- You can look at the indicator signals on history and evaluate how the signals worked out in the past in order to understand what profit could be. They are exactly the same as they were in real time.
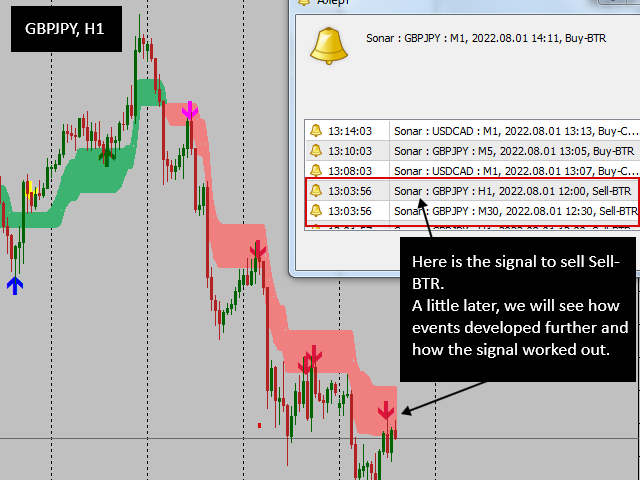
- Automatic Alerts: shows a signal as an arrow, has an alert, sends a push notification to a mobile device or an email alert.
| Indicator settings | What the variable is responsible for |
|---|---|
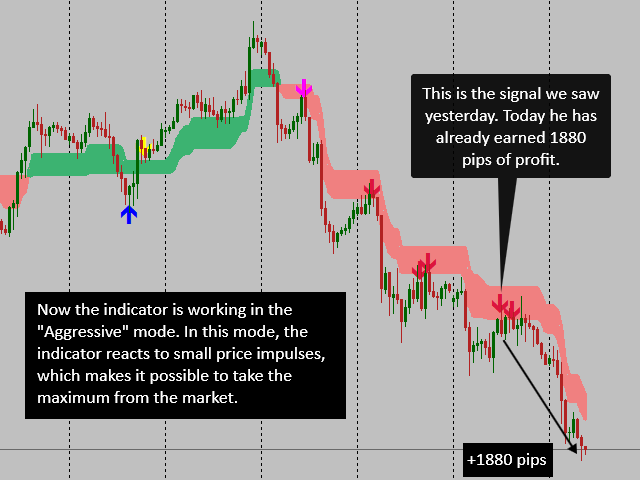
| Risk Mode | Select the indicator operation mode |
| CNTR | on/off countertrend signals |
| RTR | enable/disable early trend signals |
| BTR | on/off trend signals |
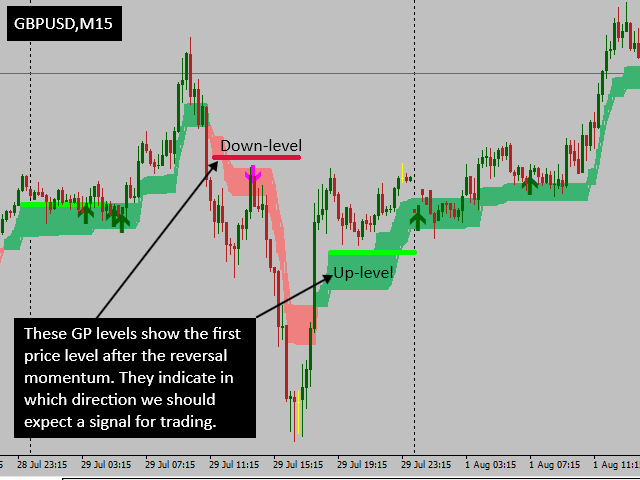
| LenghtGU | Draw length for a new bullish or inter-bracket level |
| GU Diff | Level line thickness |
| GU Filter | on/off filter to define a new bullish or bearish level |
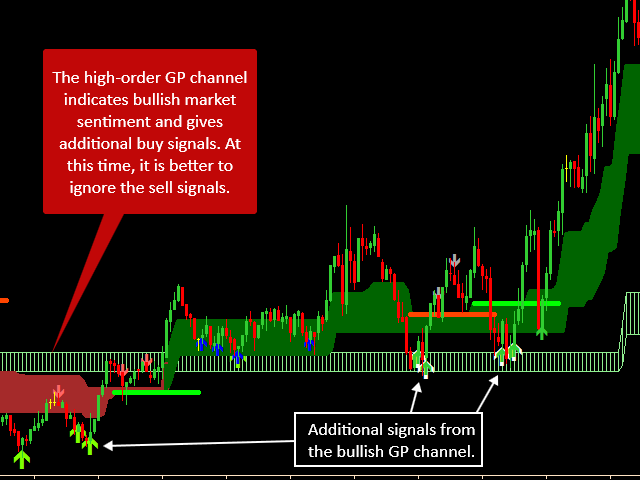
| Max Count | History depth in bars for displaying signals and drawing price channels |
| Multi signals | enable/disable display of a series of countertrend signals (CNTR signals) |
| Show Panel | Call to the chart of the multifunctional panel |
| Timeframes | What timeframes the multifunctional panel will monitor for signals |
| Simbols | A set of assets for monitoring by a multifunctional panel |
| Font Correction | Font size in the cells of the multifunction panel |
| Show Alert | Show alerts in a pop-up window |
| Send Mail | Send new signal messages to mailbox |
| Send Push | Sending push notifications about a new signal to the MT4 mobile application |
| Panel X | Panel indent horizontally from the left border of the chart window |
| Panel Y | Vertical offset of the panel from the top border of the chart |
My step-by-step guide with concrete examples of all signal options will show you how to work with the indicator in the best way, even if you are doing it for the first time.


Отличный индикатор для скальпинга в умелых руках. +410$ за три дня.