
Malheureusement, "Pair Power Index Helper MT4" n'est pas disponible
Vous pouvez consulter d'autres produits de Ziheng Zhuang :
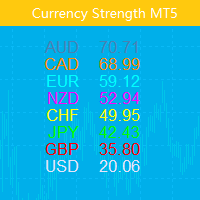
Cet indicateur montre la force relative de huit principales devises (USD, EUR, GBP, AUD, NZD, CAD, CHF, JPY). Les valeurs de force sont normalisées dans la plage de 0 à 100. Une valeur supérieure à 60 signifie fort. Un nombre inférieur à 40 indique une faiblesse.
billet Only Show Current Pair - Si vrai, seule la paire de graphiques actuelle est affichée. Sinon, les huit courbes seront affichées. Bars To Show – Nombre de barres pour afficher la courbe de force. Ma Periods To Smoot

L'indicateur comprend deux parties. Partie I : Les bougies colorées montrent la grande tendance Les bougies de couleur consistent à identifier l'état du marché à l'aide de chandeliers de couleur. Comme le montrent les captures d'écran, si la couleur est Aqua, le marché est dans un état dans lequel vous devez passer des ordres longs ou quitter des ordres courts. Si la couleur est Tomate, c'est le moment de passer des commandes courtes ou de sortir des commandes longues. Si la couleur change, il v

This Expert Advisor is designed to manage orders. It offers the following functions: Set a stop loss for an order having none. Set a take profit for an order having none. Close the last order if the total orders of a symbol are over the setting. Close the order if its lots are over the setting. Close the order if its profit in pips is over the setting. Close the order if its loss in pips is over the setting. Close the order if its profit in amount is over the setting. Close the order if its loss
FREE

This indcator shows the trend with the color histogram. It is simple and easy to use. Usage: If the histogram changes from the aqua to the fuchsia, which means the trend is up. If the histogram changes from the fuchsia to the aqua,which means the trend is down. Inputs: MaPeriods: the periods of moving average. f1: the multiplier of inner bands f2: the multiplier of outer bands Popup Window Alert Email Alert Mobile Push Alert Alerts When the trend changes from the long trend to the short trend or
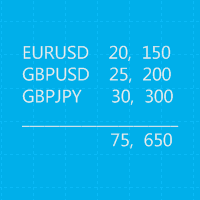
This is a MetaTrader 5 script. It helps to summarize all trades into every symbol.
Input Select Period: This is 7-option input. It includes Last Month, This Month, Last Week, This Week, Today, All History, and Date Specified. Specify Starting Date: Enter a date if you selected Date Specified in "Select Period" input. Specify Ending Date: Enter a date if you selected Date Specified in "Select Period" input. The summary is saved into a file in MQL5\Files folder. MT4 Version: https://www.mql5.c
FREE

This EA is designed to monitor the slippage of opening and closing orders, and save the records in files. It is useful to record the slippage and evaluate brokers. The record files are saved in the folder MT4_Data_Folder\MQL4\Files. Go to "File " --> "Open Data Folder" . Warning : Do NOT open the files directly, otherwise it will affect the exectution of EA, just copy them to another folder and open them.
Usage: Open a chart and load the EA on it, just need only one EA to run, it monitors a
FREE

This EA is designed to monitor the slippage of opening and closing orders, and save the records in csv file. It is useful to record the slippage and evaluate brokers. The record files are saved in the folder MT5_Data_Folder\MQL5\Files. Go to "File " --> "Open Data Folder" . Warning : Do NOT open the files directly, otherwise it will affect the exectution of EA, just copy them to another folder and open them.
Usage: Open a chart and load the EA on it, just need only one EA to run, it m
FREE
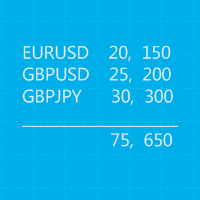
This is a MetaTrader 4 script. It helps to summarize all trades into every symbol.
Input Select Period: This is 7-option input. It includes Last Month, This Month, Last Week, This Week, Today, All History, and Date Specified. Specify Starting Date: Enter a date if you selected Date Specified in "Select Period" input. Specify Ending Date: Enter a date if you selected Date Specified in "Select Period" input. The summary is saved into a file in MQL4\Files folder. Also, there is pop-up window for
FREE
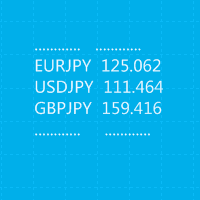
This is a MetaTrader 4 script. It helps to export all trades into a CSV file as per Symbol and selected periods.
Input Select Symbol: This is 2-option input. Select current symbol or all symbols to export its orders. Select Period: This is 7-option input. It includes Last Month, This Month, Last Week, This Week, Today, All History, and Date Specified. Specify Starting Date: Enter a date if you selected Date Specified in "Select Period" input. Specify Ending Date: Enter a date if you selected D
FREE

Ce conseiller offre les fonctionnalités suivantes : Position ouverte : ouvrez un ordre long ou court lorsque le prix franchit la ligne de tendance. Liquidation : Liquidez les positions longues ou courtes lorsque le prix franchit la ligne de tendance. Trailing Stop Loss – L'EA suit la ligne de tendance et continue d'augmenter le stop loss pour les ordres à long terme ou de réduire le stop loss pour les ordres à court terme. La ligne peut être une ligne de tendance ou une ligne horizontale.

The indicator includes two parts. Part I: Color Candles Show the Major Trend Color candles is to identify the market state by color candlesticks. As shown in the screenshots, if the color is Aqua, the market is in a state when you should place long orders or exit short orders. If the color is Tomato, it is the time to place short orders or exit long orders. If the color is changing, it is better to wait for its completion (until the current bar is closed). Part II: Draw bands The inner bands is
Ce panel est composé de conseillers experts et propose six groupes de panels de trading. Version MT5 : cache panneau rapide
caractéristiques La plupart des opérations de trading peuvent être effectuées rapidement en cliquant sur les boutons de ce panneau. Changer de panneau est aussi simple que de cliquer sur le bouton vert. EA peut être exécuté sur les graphiques visuels de Strategy Tester et fournit un moyen simple de s'entraîner au trading sur la base de données historiques. Modifiez le s
Cet EA est un outil de trading professionnel qui intègre une gestion flexible des risques et 6 ensembles de panneaux de trading. Version MT5 : Quick Panel Pro Hedging caractéristiques Les calculs par lots sont rapides et faciles. Lorsque vous déplacez la ligne d'arrêt, les calculs s'effectuent immédiatement. La plupart des transactions commerciales peuvent être effectuées rapidement en cliquant simplement sur ce panneau. Vous pouvez rapidement basculer entre les panneaux en cliquant simplement
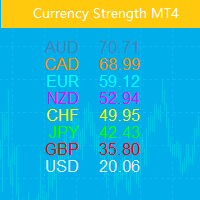
Cet indicateur montre la force relative de huit principales devises (USD, EUR, GBP, AUD, NZD, CAD, CHF, JPY). Les valeurs de force sont normalisées dans la plage de 0 à 100. Une valeur supérieure à 60 signifie fort. Un nombre inférieur à 40 indique une faiblesse. Le principe de base Étant donné huit devises, USD, EUR, GBP, AUD, NZD, CAD, CHF, JPY, où chaque paire de deux peut être combinée, ce qui donne un total de 28 paires, un algorithme inverse est utilisé pour extraire la force des huit devi

This indicator shows the main trend on the current chart.
Features This indicator includes two bands, one is the inner white bands, another is the outer blue bands. If the white dotted line crosses down the white solid line, this means that the trend has changed to be bearish. If the white dotted line crosses up the white solid line, this means that the trend has changed to be bullish. Once the crossing happened, it will not repaint.
Settings ShowColorCandle: if 'true', it will show the colo

This indicator shows main trend, entry zone and exit zone. This is a muti-timeframe indicator, so it is always repainting in the current period of the higher timeframe.
Features Colorful Histogram: it indicates the main trend, the tomato means the market is bearish,and the sky blue means the market is bullish. Inner Blue Bands: it is entry zone for entry market, the market is relatively safe for entry. Outer Yellow Bands: it is exit zone for exit market, the market is oversold or overbought.
Ce conseiller est un tableau de bord qui vous permet de trader plusieurs paires en un seul clic. Cliquez sur ouvrir Ce bouton ouvre une commande pour la paire sélectionnée. Cliquez sur fermer Ce bouton ferme la commande pour la paire sélectionnée. Le lot de commande est le numéro saisi par l'utilisateur. Les nombres positifs correspondent aux ordres d’achat, tandis que les nombres négatifs correspondent aux ordres de vente. Cliquez sur le bouton Fermer pour fermer la

This indicator is designed to show the pair power of the major 28 paris with RSI,Stochostic,and CCI. The power value is sorted from the weak to the strong. The weaker pairs: the pairs occurs at least 2 times in the top 3 rows The stronger pairs: the pairs occurs at least 2 times in the bottom 3 rows Users can add another symbol, so it can calculate 28+1 symbols. My advice: https://www.mql5.com/en/blogs/post/729880
A free EA with Pair Power Matrix --- https://www.mql5.com/en/blogs/post/732

The purpose of the inidcator is to identify the reversal point.
The blue arrow is buy signal and the yellow star is its stop loss. The red arrow is sell signal and the yellow star is its stop loss. Alert feature: if there is a signal, the indicator will send alerts of popup window,email or mobile push. Inputs: Popup Window Alert: it is false in default Email Alert : it is false in default Mobile Push Alert: it is false in default. MetaTrader 5 Version: Reversal Point Please note that the singa
montre. Ce conseil concerne uniquement la couverture de compte. Version MetaTrader 4 Quick Panel Pro
caractéristiques Les calculs par lots sont rapides et faciles. Lorsque vous déplacez la ligne d'arrêt, les calculs s'effectuent immédiatement. La plupart des transactions commerciales peuvent être effectuées rapidement en cliquant simplement sur ce panneau. Vous pouvez rapidement basculer entre les panneaux en cliquant simplement sur les boutons verts. Modifiez le stop loss et prenez d
Remarque : Cette EA ne fonctionne que sur les comptes sans risque. Version Métatrader 4 panneau rapide Ce panel est un groupe de six conseillers experts qui constituent un panel de négociation.
caractéristiques La plupart des tâches de trading peuvent être effectuées rapidement en cliquant sur les boutons de ces panneaux. Basculer entre les panneaux est aussi simple que de cliquer sur le bouton vert. EA peut être exécuté sur les graphiques visuels de Strategy Tester et fournit un moyen

Gamma Bands This indcator shows the trend with the color histogram. It is simple and easy to use. Usage: If the histogram changes from the aqua to the fuchsia, which means the trend is up. If the histogram changes from the fuchsia to the aqua,which means the trend is down. Inputs: MaPeriods: the periods of moving average. f1: the multiplier of inner bands f2: the multiplier of outer bands Popup Window Alert Email Alert Mobile Push Alert Alerts When the trend changes for the long trend to the

The purpose of the inidcator is to identify the reversal point.
The blue arrow is buy signal and the yellow star is its stop loss. The red arrow is sell signal and the yellow star is its stop loss. Please note that the singal is against trend,it could be continual fail. Alert feature: if there is a signal, the indicator will send alerts of popup window,email or mobile push. Inputs: Popup Window Alert: it is false in default Email Alert : it is false in default Mobile Push Alert: it is false in

Ce conseiller offre les fonctionnalités suivantes : Position ouverte : ouvrez un ordre long ou court lorsque le prix franchit la ligne de tendance. Liquidation : Liquidez les positions longues ou courtes lorsque le prix franchit la ligne de tendance. Trailing Stop Loss – L'EA suit la ligne de tendance et continue d'augmenter le stop loss pour les ordres à long terme ou de réduire le stop loss pour les ordres à court terme. La ligne peut être une ligne de tendance ou une ligne horizontale.
Ce conseiller est un tableau de bord qui vous permet de trader plusieurs paires en un seul clic. Cliquez sur ouvrir Ce bouton ouvre une commande pour la paire sélectionnée. Cliquez sur fermer Ce bouton ferme la commande pour la paire sélectionnée. Le lot de commande est le numéro saisi par l'utilisateur. Les nombres positifs correspondent aux ordres d’achat, tandis que les nombres négatifs correspondent aux ordres de vente. Cliquez sur le bouton Fermer pour fermer la