Magic Regression
- Indicateurs
- Wartono
- Version: 2.3
- Mise à jour: 23 juillet 2022
- Activations: 10
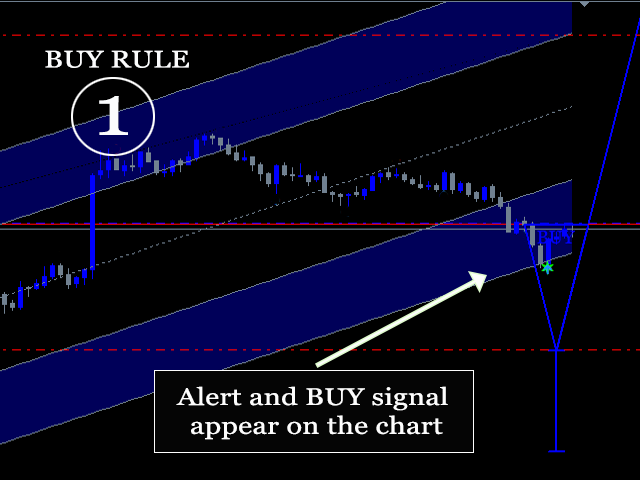
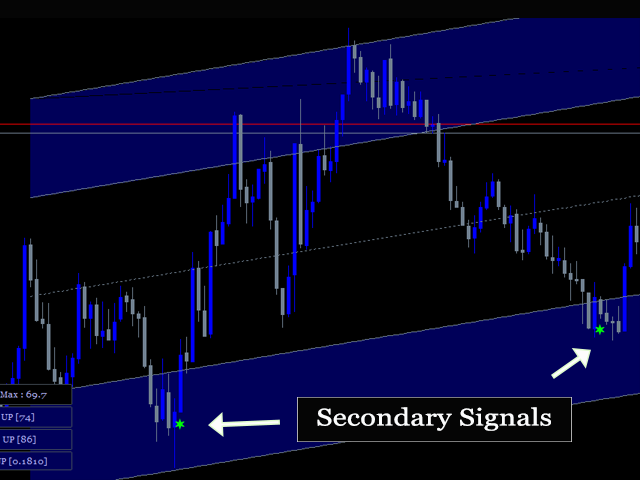
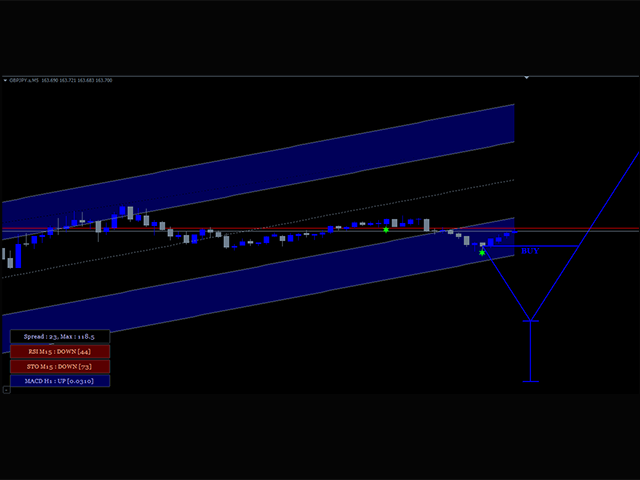
Provides Regression Channel on the current chart. Combined by Trend of Moving Averages and Multi timeframes Oscillator Indicators: CCI, RSI, Stochastic, and MACD with specific working logic. It could make us easier to identify swing high-low as an entry point, the retracement area while following the current trend. Consists of 2 types of signal, main and secondary. The main signal will draw very clearly triangle and lines on the chart with the word " BUY" or 'SELL'. and the secondary is the star buffers and these are trend follower signals and non-repaint.
Recommended TF: M5 (For default parameters)
Symbols: Any Symbol (Forex Recommended)
Parameters
Below are the default settings (recommended) for timeframe M5
Fast Period: 89, Fast Period of MA
Slow Period: 144, Slow Period of MA and also Period of Regression and CCI indicator
Method: SMMA (smoothed), this is MA Method
Applied Price: Close Price, Applied Price of MA
Regression Deviation : 0.5, Deviation of Regression Channel, min: 0.1, max 0.9
MACD Timeframe : H1, Timeframe of MACD (displayed at the bottom left of chart)
MACD Fast Period: 12
MACD Slow Period: 26
MACD Signal: 9
MACD Applied Price: Price Close
MACD Shift: 1, This is MACD bar shift , counted from right to left.
STO Timeframe : M15, Time frame of Stochastic (displayed at the bottom left of chart)
STO KPeriod: 5
STO DPeriod: 3
STO Slowing: 3
STO_Method : Low/High
STO Applied Price: Price Close
STO Overbought : 80
STO OverSold: 20
STO Shift: 1 , Bar shift of stochastic, counted from right to left
RSI Timeframe : M15, Time frame of RSI (displayed at the bottom left of chart)
RSI Period: 5
RSI Applied Price: Price Close
RSI Overbought: 80
RSI OverSold: 20
RSI Shift: 1, Bar shift of RSI , counted from right to left
And standard alerts setting : PopUp Alert, Mobile Notification Alert,Email Alert.
Color theme:
Uptrend = Blue
Downtrend = Red
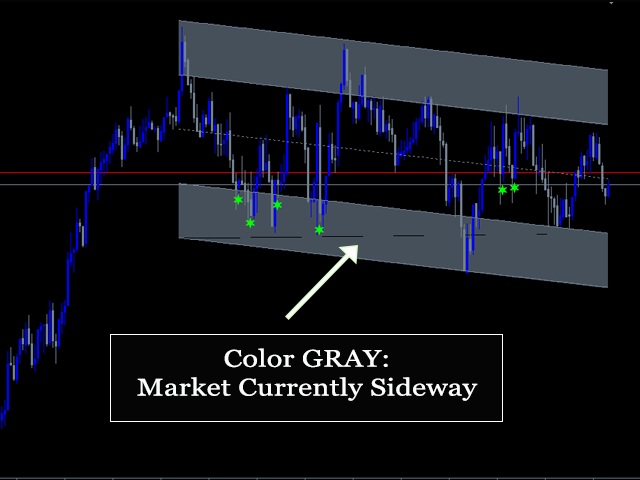
Sideway/Consolidation = Gray
Installation:
Install it on multiple symbols in order to get more signals. I personally installed it on up to 15 symbols and I got 10-15 signals/day.
How to trade:
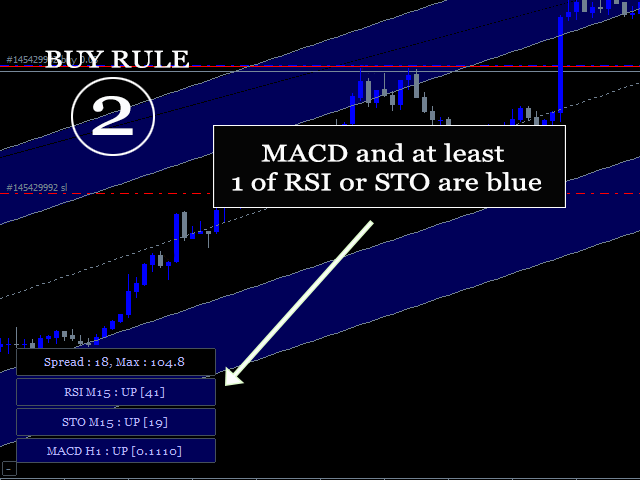
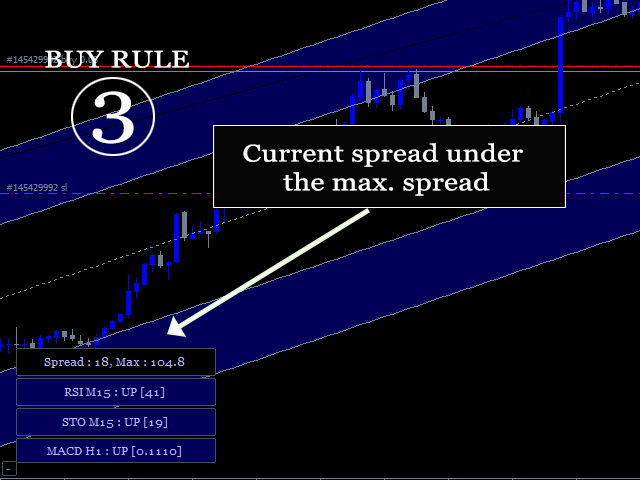
BUY signal: It will draw very clearly objects on the chart when the main signal occurs. Including alert if set to be true. The Channel color Blue means that MA, regression and CCI currently are uptrend. Then waiting for RSI, Stochastic and MACD colors become blue [UP] to confirm the signal. At this moment, It is the time to place buy position. Avoid to place BUY when you see very strong Bearish candle in the last 1 to 5 bars.
And Close position if price crosses over the upper regression channel. Or you can draw SL and TP. See images to define the SL or TP prices.
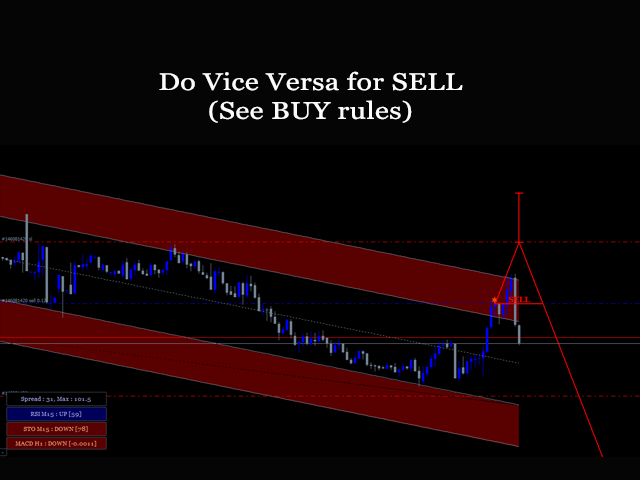
SELL signal: Vice versa
Please refer to the images for more details.
Strategy Tester:
It may not provide proper MTF values on the chart when you run the indicator on the strategy tester. In this case please ensure that you have sufficient historical data from M1 to at least H1 depending on the indicator timeframe inputs.
Don't hesitate to contact us if you have any questions

