KT Hull MA MT5
- Indicateurs
- KEENBASE SOFTWARE SOLUTIONS
- Version: 1.0
- Activations: 5
Il s'agit d'une version modifiée et améliorée du HMA classique, développé à l'origine par Alan Hull en 2005. Elle utilise une combinaison de trois moyennes mobiles pondérées pour réduire le retard.
- Entrée Longue : Lorsque le HMA passe du rouge au bleu avec une pente ascendante.
- Entrée Courte : Lorsque le HMA passe du bleu au rouge avec une pente descendante.
Fonctionnalités
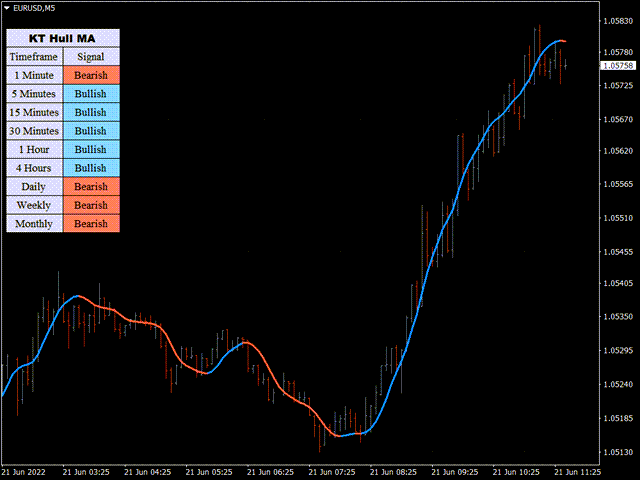
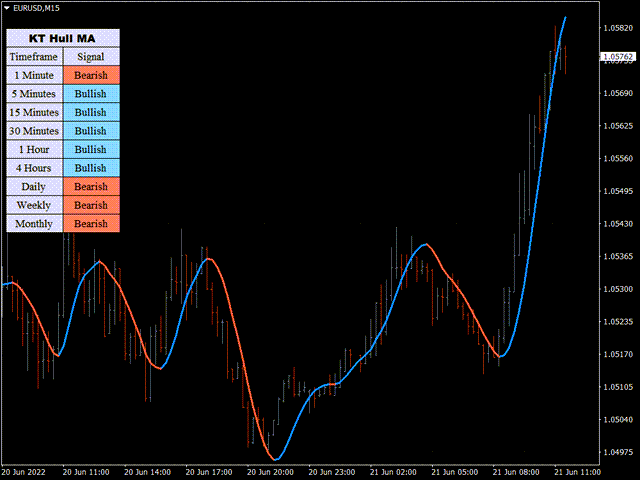
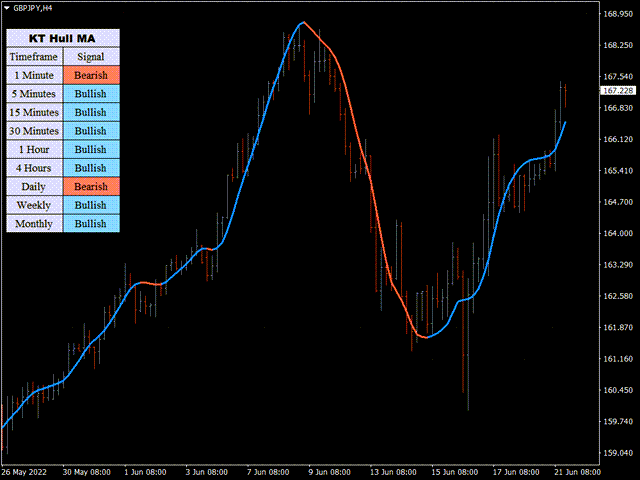
- Scanner multi-timeframe inclus, détecte les nouveaux signaux sur toutes les unités de temps.
- Le HMA réduit les retards typiques des moyennes mobiles classiques.
- Identifie efficacement le début et la fin des nouvelles tendances émergentes.
- Compatible avec tous les types d'alertes MetaTrader.
Formule du HMA
La moyenne mobile de Hull est calculée à partir de trois WMA :
- WMA1 = P × WMA
- WMA2 = P/2 × WMA
- HMA Brut = (2 × WMA1) - WMA2
- HMA Final = WMA(√P) du HMA Brut
P = Période
WMA = Moyenne Mobile Pondérée
Astuce Pro
Vous pouvez utiliser le HMA seul, mais il est recommandé de le combiner avec d'autres indicateurs pour améliorer la précision. Le scanner multi-timeframe est également utile pour confirmer les signaux.
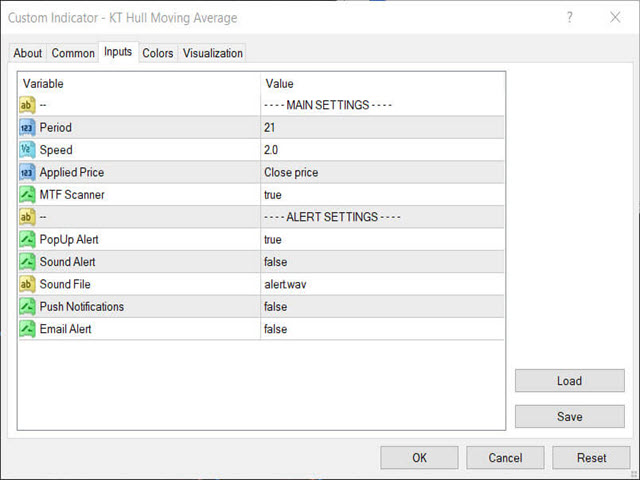

Hi, the indicator is good and beautiful! But in the settings can it be implemented the exclusion of alert for EVERY timeframe? For ex.: I want only 15m, h1 and daily. Can you do it? Thank you! Silvio