Moving Average Trend Scanner MT4
- Indicateurs
- Amir Atif
- Version: 5.0
- Mise à jour: 21 septembre 2023
- Activations: 15
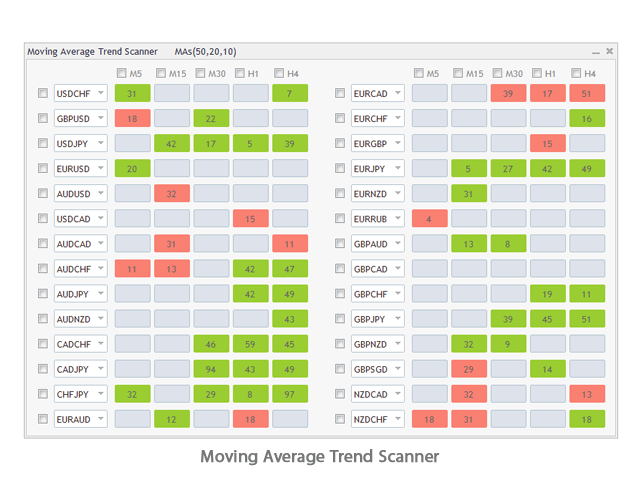
Moving Average Trend Scanner is a multi symbol multi timeframe triple MA crossover dashboard that helps traders to monitor, and identify potential market trends from one chart.
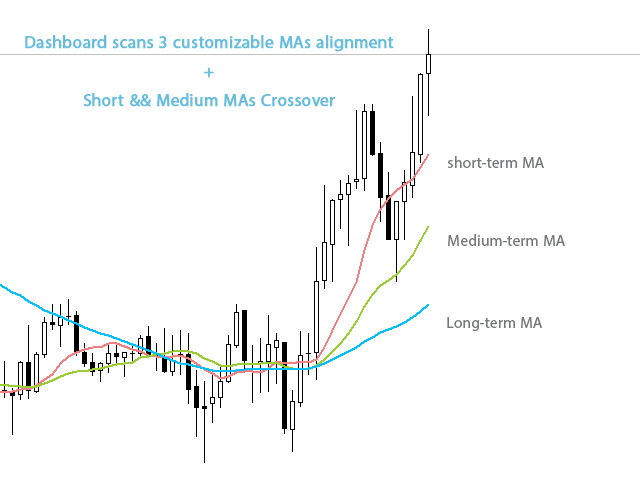
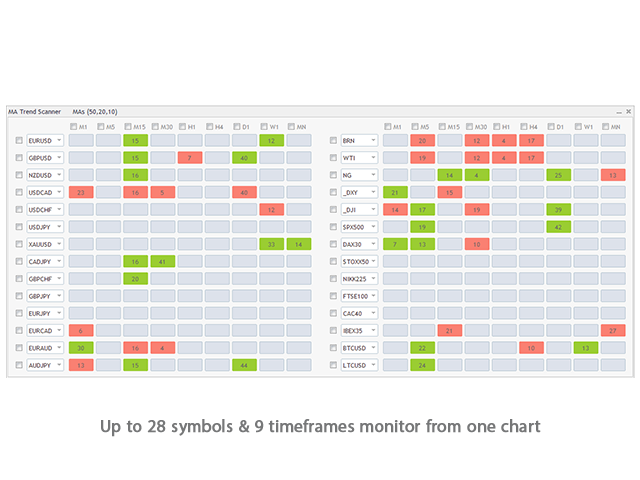
This panel scans 3 moving averages in up to 28 configurable instruments and 9 timeframes for triple moving average alignment and moving average crossover with a deep scan feature to scan all market watch symbols (up to 1000 instruments!).
After the purchase, don't forget to message me to receive a copy of the MT5 full version for 1 trading account as a bonus.
Moving Average Trend Scanner features:
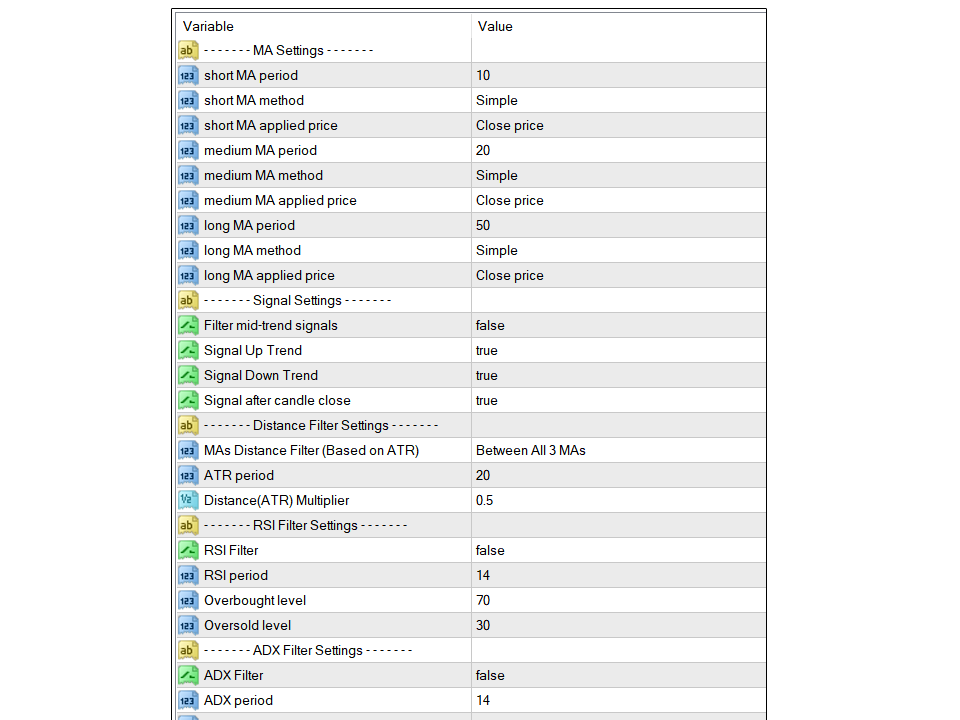
- Customizable short-term, medium-term, and long-term MAs.
- Works on all instruments such as currency pairs, CFD, metals, cryptocurrencies, etc.
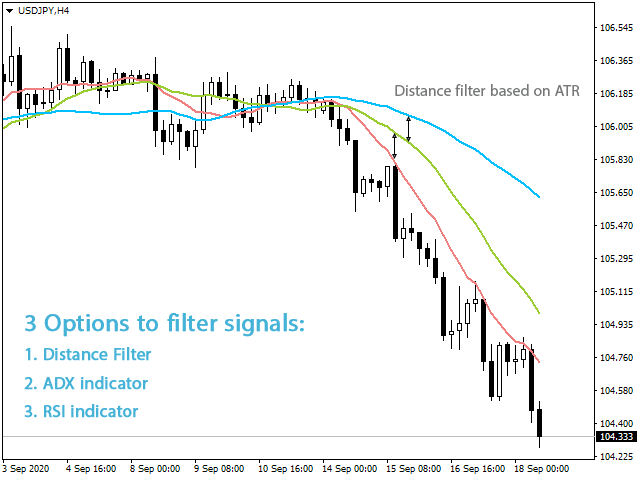
- Option to filter signals based on a minimum distance between moving averages to avoid premature MAs alignment.
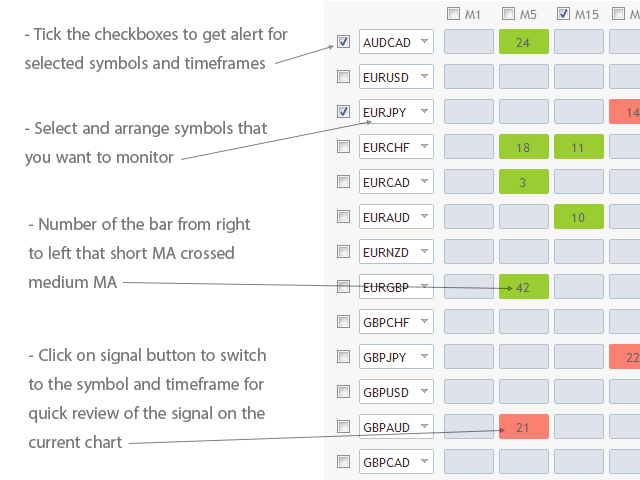
- Option to show the number of the bar that short MA crossed medium MA on dashboard buttons.
- Optional Filter of signals with RSI indicator overbought/oversold levels.
- Optional Filter of signals with ADX indicator.
- You can set different MA periods for different timeframes.
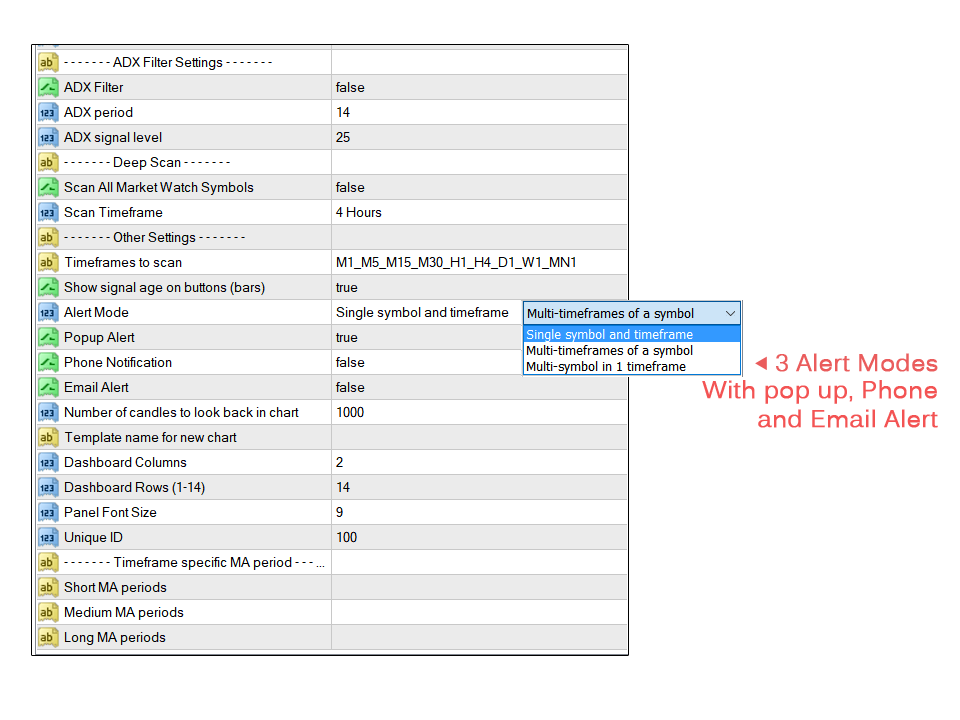
- Deep Scan mode to scan all market watch symbols for MAs alignment in a chosen timeframe.
- You can choose between 3 alert modes:
- Single symbol and timeframe
- Multiple timeframes of a symbol
- Multiple symbols for a timeframe
- Quick review of signals on the same chart by clicking on signal buttons.
- Easy setup and arrange of symbols in any order with any instrument that your broker provides.
- Popup, email, and phone notification alerts for selected symbols and timeframes.
Some Notes:
- The moving average dashboard signals are based on 3 MAs alignment. Green color is for uptrend where short MA is above medium MA and medium MA is above long MA and red color for the downward alignment . Note that if you enable the distance or ADX filter, the dashboard might not give an immediate MA cross signal.
- The signals of this moving average scanner (Green/Red colors) are not Buy/Sell signals. They indicate a potential market trend that should be checked. The classic trend following approach is to find a strong trend then look at lower timeframes for a pullback or breakout trade setup in the direction of the main trend. If you have a particular MA trading system you can set up the MA scanner accordingly to get buy/sell signals.
- If you want 2 MAs setup, set the long MA period to zero.
- By default, the MA dashboard scans moving averages and doesn't consider the current price position relative to MAs. If you want that set the short MA period to '1' then it resembles the price.
- If you want to monitor more than 28 instruments you can load the indicator on another chart with different "Unique ID" in the settings and set different symbols for it.
- The symbols that you want to add to the dashboard must be visible in the MetaTrader market watch window. The first time you run the indicator or load a new symbol in the dashboard it might take a few seconds to update its data and show signals.


Quality indicator, Very responsive and helpful seller!