Multi Timeframe Support and Resistance Zones MT5
- Indicateurs
- Amir Atif
- Version: 4.1
- Mise à jour: 5 décembre 2022
- Activations: 15
50% off. Original price: $60
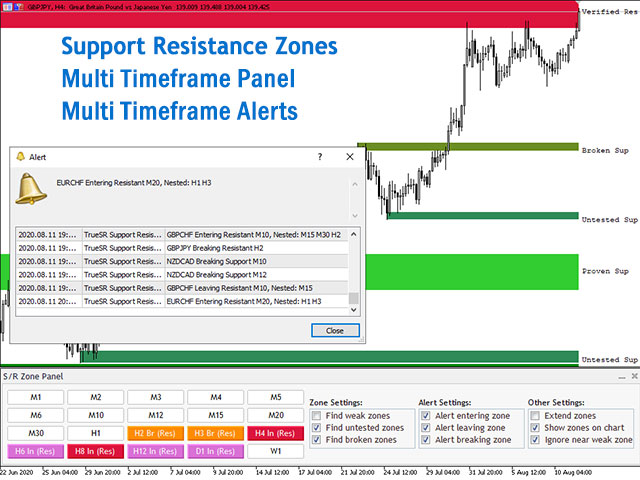
Support and Resistance zones indicator for MT5 is a multi-timeframe panel and alert that finds support and resistance zones and pivot points for all timeframes of MetaTrader 5 and gives alert when price has interaction with them.
Download demo version (works on GBPUSD, EURJPY and NZDUSD symbols)
Read the full description of scanner parameters in the blog page.
Many unique features in one indicator:
- Integrating support and resistance zones and pivot points in one indicator with powerful filtering rules and alert system.
- Alerts when price returns from S/R zones and pivot levels for swing trading and range trading strategies.
- Alerts when price breaks S/R zones and pivot levels for breakout trading.
- Finds high probability trend reversals with a full set of alert filters.
- You can avoid getting caught in SR zones by checking them before opening a position.
- This indicator gives you the best levels for stoploss and take profit.
- You will receive alerts for all timeframes without the need to switching between them.
- You can view S/R zones of multiple higher timeframes on the chart.
Powerful alert filters for S/R zones:
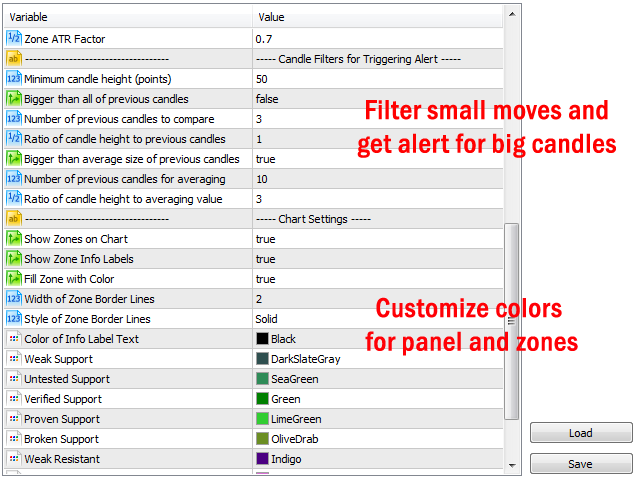
Indicator has 5 filters to ignoring low quality alerts and finding best levels for order setups. - minimum candle height
- minimum candle body to height ratio
- minimum candle height to zone height ratio
- comparison between candle height and the height of previous candles
- comparison between candle body and average body length of previous candles
Informative panel:
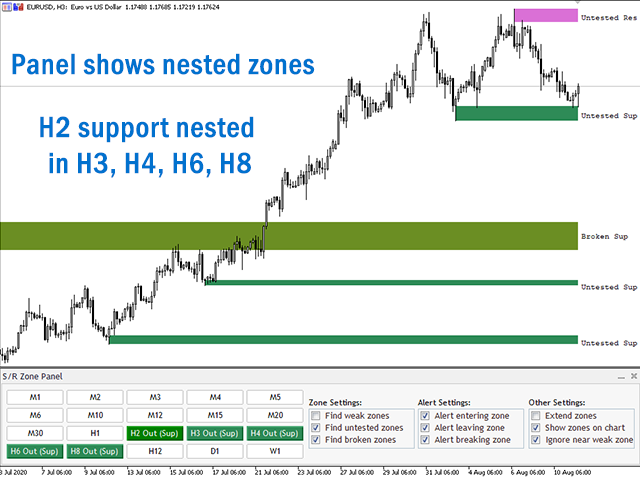
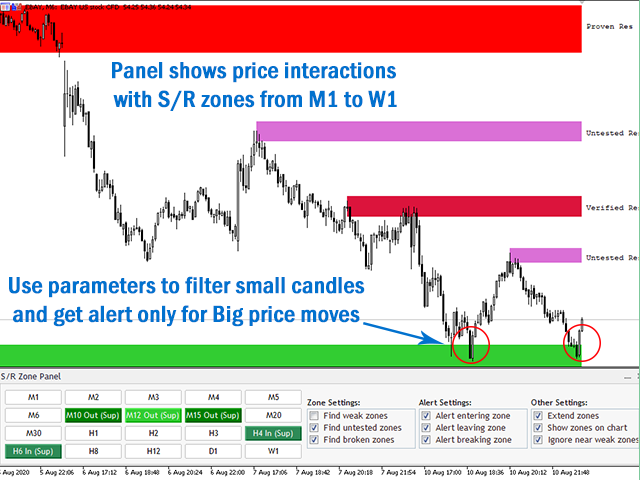
Panel shows if price has interaction with support and resistance zones from M1 to W1 timeframes. Also with panel you can find nested zones at a glance.
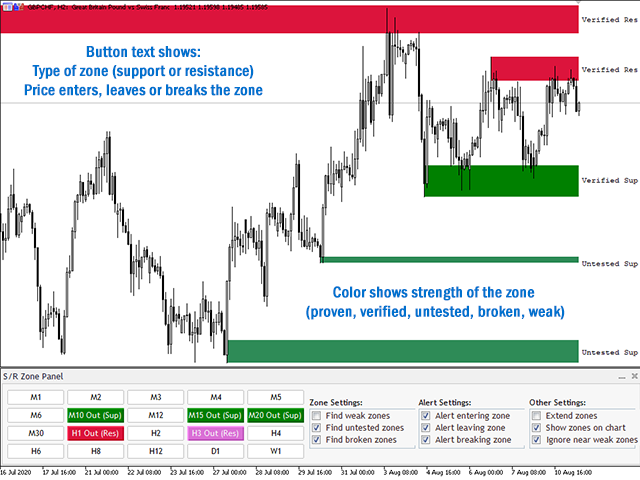
- Button text shows type of support and resistance zones (with "Sup" and "Res" abbreviations on buttons)
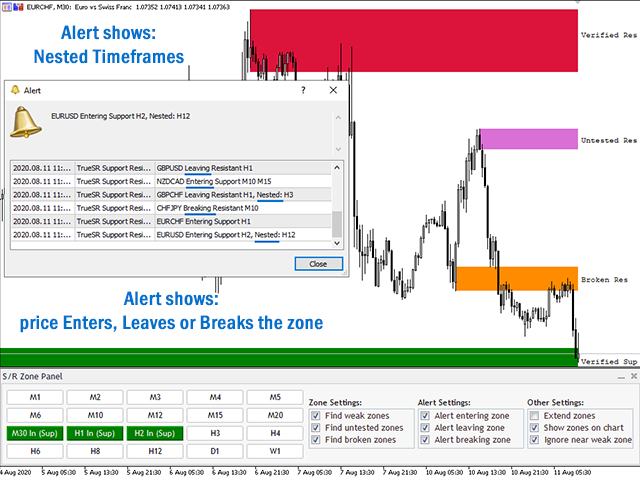
- Button text shows in which timeframes price enters, leaves or breaks a zone (with "In,Out,Br" abbreviations on buttons)
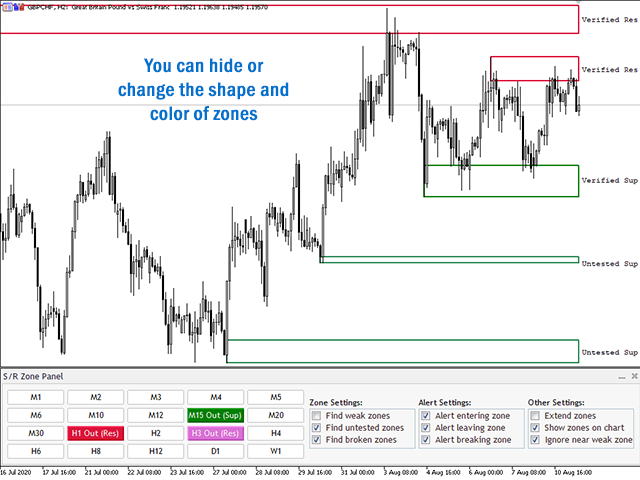
- Button color shows strength of support and resistance zone (you can change the color of zones)
- Ability to change frequently used settings directly through the panel
- Panel and zones will update on every 1-minute candle open and when chart time frame changes
Indicator shows the Strength of Support and Resistance Zones:
This indicator uses fractals and ATR indicator to find and draw support and resistance zones on price chart. Zones have different strength that are:
- Weak fresh zones: high and low points in trend that price didn't touch them again yet
- Fresh zones: important high and low points (major turning points) that price didn't touch them again yet
- Verified zones: strong zones, price touched them before but couldn't break them
- Proven zones: verified zone that at least four times the price can't break it
- Broken zones: zones that price breaks them (not applied for weak zones)
Pivot Points Features:
- Support and resistance zones indicator shows the daily, weekly and monthly pivot point levels on the chart.
- You can receive alert when price breaks a pivot point level or returns to it.
- You can choose between 5 different calculation type of pivot points (standard, fibonacci, camarilla, woodie and demark).
Different Alert Types:
You can enable the following alerts at the same time in the indicator settings. - when candle moves into a zone and closes inside it
- when price leaves (returns from) a zone and closes outside and also price is higher or lower than previous candle
- when price breaks a zone and closes outside of zone
Find Nested Zones at a glance:
In panel you can see if price enters or leaves support and resistance zones in more than one timeframe at the same time. Also alert shows nested zones in other timeframes in the indicator parameters you can set the number of nested zones that must be found before alert triggers.
Use the power of Support and Resistance zones in your EAs:
This indicator has a fast and lightweight version that you can use it in the code of expert advisors and indicators for accessing the values of nearest S/R zones to price in all timeframes.
- Bridge is included in the lifetime licenses of the indicator, contact me after buying the scanner and I'll send the bridge to you.
- You will receive a sample EA to see how to use the bridge in expert advisor code with iCustom function .
Please check out indicator blog page for more info about the bridge.
If you have any question, please ask in the comments section. I'll do my best to answer your questions.

