• Aperçu
  • Avis (1)
  • Commentaires (15)
  • Nouveautés

RSI Divergence Scanner MT4

5

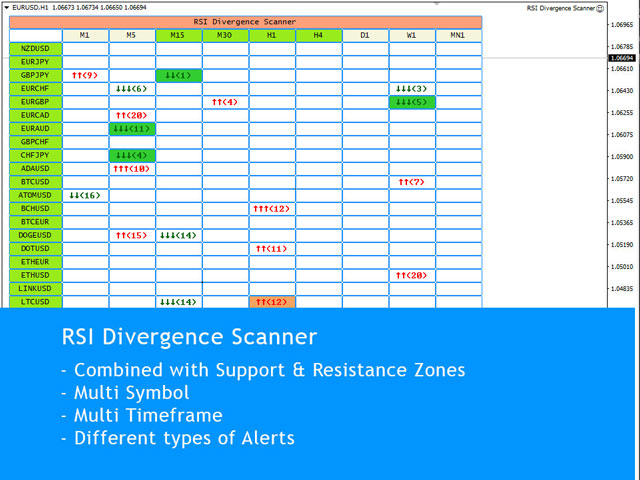
RSI Divergence Scanner is a multi-timeframe and multi-symbol dashboard and alert that checks all timeframes and symbols to find divergences between price chart and RSI indicator.

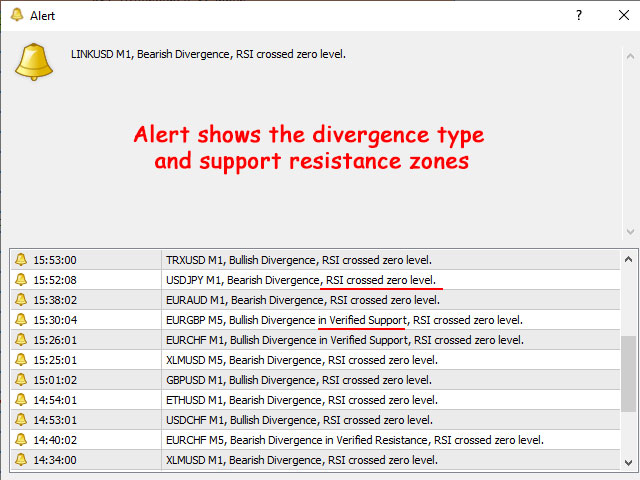
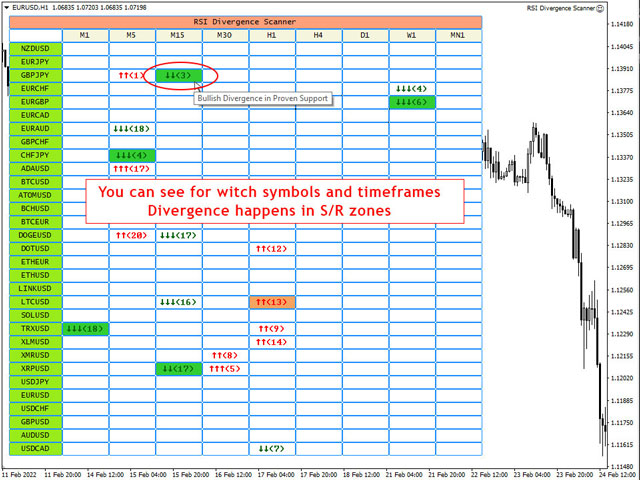
This divergence scanner is integrated with support and resistance zones so you can check the RSI divergences in the most important areas of the chart to find trend reversals in the price chart.

Download demo version (works on M 1,M5,M30,W1 timeframes)

Full description of scanner parameters -> click here.

How to get the most from the scanner -> read this article.

Using RSI divergences alongside other technical tools like price action, candlestick patterns and support resistance zones gives reliable signals for possible trend reversals.

If you are using RSI Divergence in your trading strategy, this scanner helps you find the best opportunities to trade without spending much time in front of your system.

RSI Divergence Scanner Features:

  • Scanner finds both regular (classic) and hidden divergences
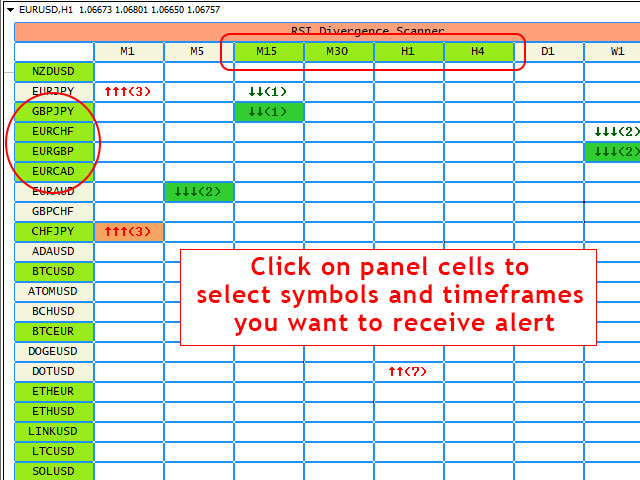
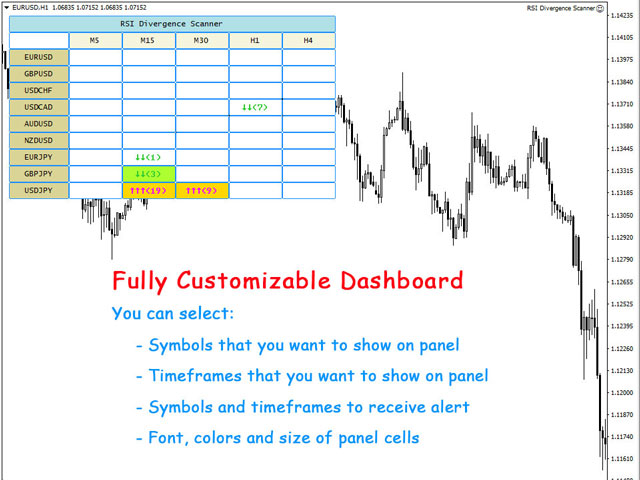
  • Run the dashboard on one chart and see the RSI Divergence for all selected symbols and timeframes.
  • You can set the scanner to only search for divergences that occur in overbought/oversold levels (you can set levels in parameters).
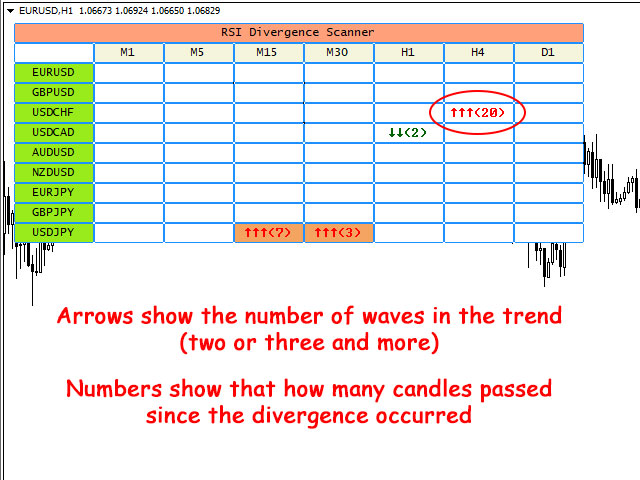
  • The panel shows that how many candles passed since the divergence occurred.
  • The panel shows the number of trend waves (2 or 3 and more) that leads to the divergence. 
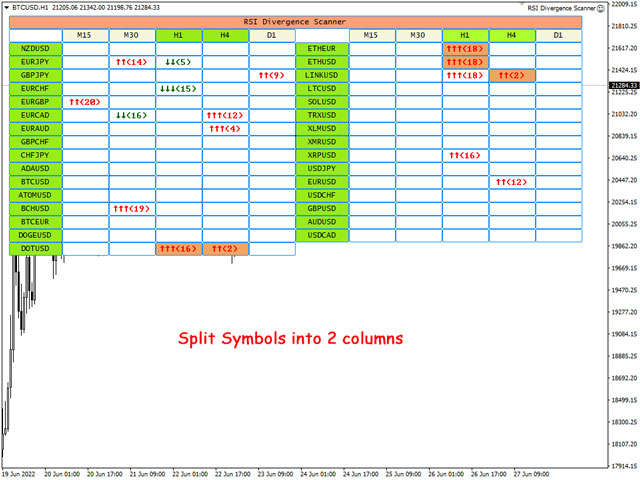
  • You can split the symbols into 2 or 3 columns to show more symbols on the chart
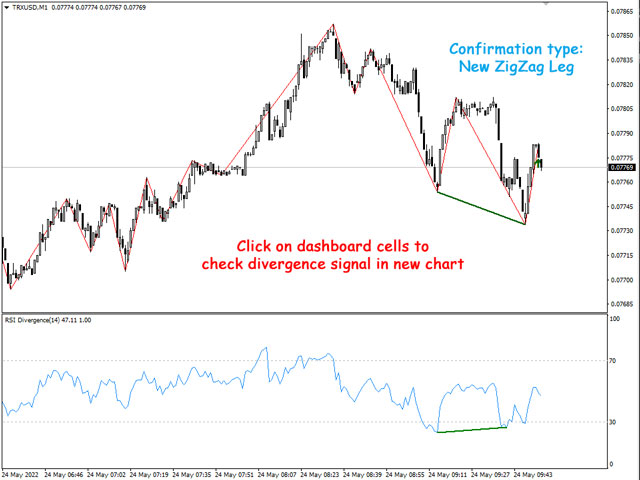
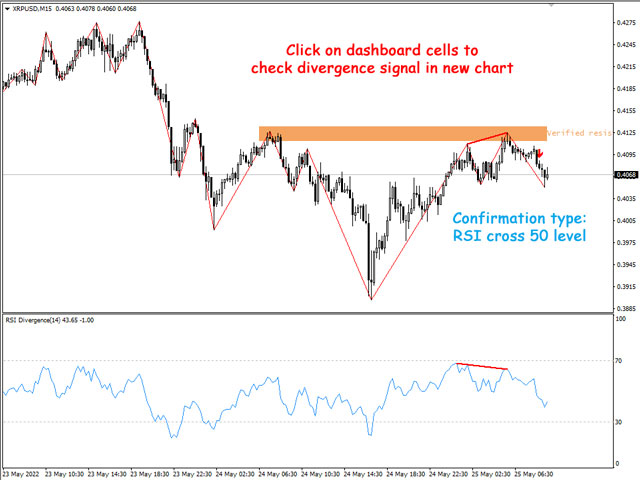
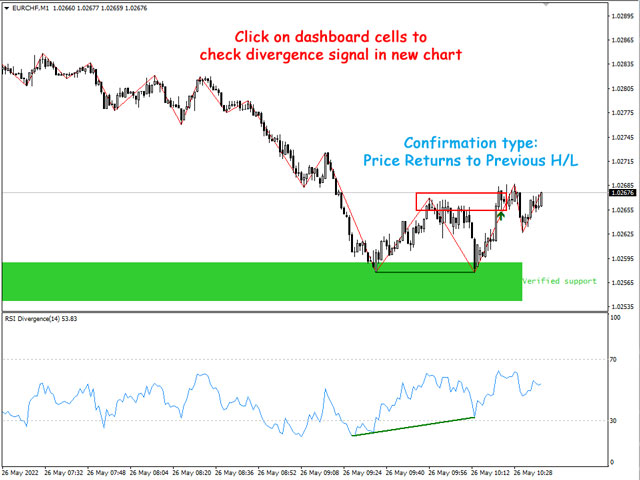
  • When you click on table cells, you can see the S/R zone, divergence line and divergence arrow on the opened price chart.
  • You can separate symbols into multiple dashboards with different parameters for each dashboard (for example for different markets).
  • You can enable/disable alerts for symbols and timeframes directly from the scanner dashboard.
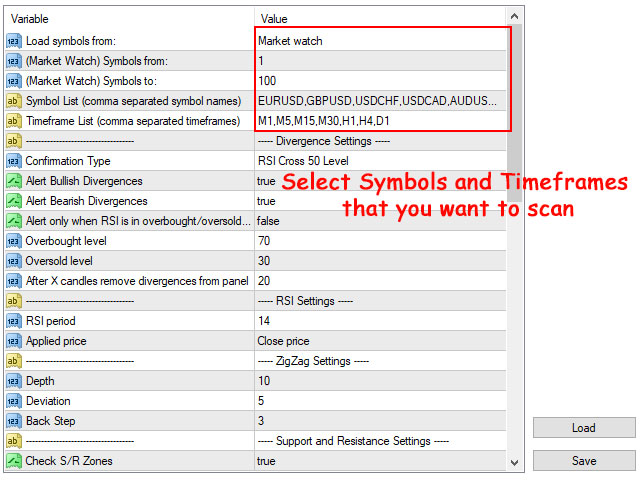
  • Scanner works in all markets (Forex, Stocks, Indices, Commodities, Crypto ...), you can write the symbol names in the settings (comma separated) or simply set the scanner to read the symbols from market watch.

Different confirmations for divergences

There are 6 confirmation option for RSI divergences that you can select in input parameters:

  • Candlestick Patterns
  • RSI line cross 50 level
  • Price returns to previous H/L
  • Changing the color of Heiken Ashi indicator
  • Strong Reversing Candle (may not happen)
  • Immediate alert without confirmation

Integrated with support and resistance zones

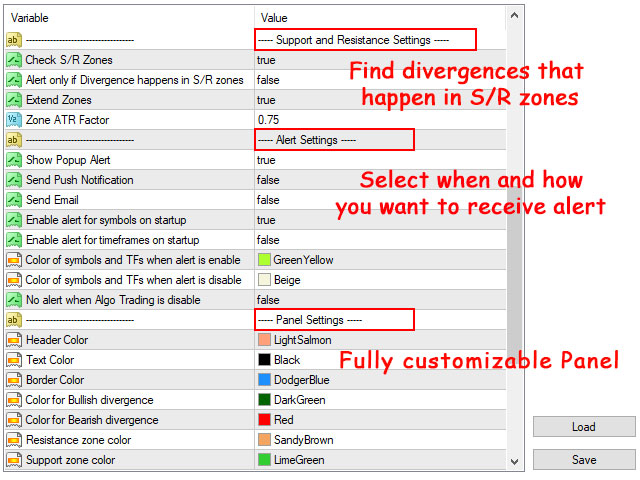
  • You can set the scanner to only receive alerts for RSI divergences that are inside the support and resistance zones.
  • You can see witch RSI divergences happen in support resistance zones through cell colors.
  • You can set the parameters for support and resistance zones in scanner input parameters.
  • Support and resistance zones are calculated based on shved supply and demand indicator that you can download for free from this link (scanner doesn't need it).

Different Alert Types:

You can enable the following alerts at the same time in the scanner settings.

  • Show Pop Up Alert: Show alert window when scanner alert triggers.
  • Send Push Notification: Send push notification to mobile phone when scanner alert triggers. (You should set metatrader Notifications options)
  • Send Email: Send email when scanner alert triggers. (You should set metatrader Email options)

Notes:

  • RSI Divergence Scanner uses ZigZag indicator to determine trend direction and HH/LL of the price, you can change the ZigZag parameters in the indicator's input window.
  • You can add the free RSI Divergence Indicator to your default chart template, so when you click on the dashboard cells, you can see the divergence on the opened chart (dashboard doesn't need the indicator to run).
  • Dashboard works smoothly for 70 symbols and all 9 timeframes on an average PC, you can add more symbols when you reduce the number of timeframes.
  • If there are many symbols in the market watch, in the first run of the scanner on the chart it may take some time to load the history data for all timeframes of all symbols.
  • If you don't want to find RSI divergences on W1 and MN1 timeframes, don't load them on the dashboard. Charts must have at least 300 candles for checking the trend and finding the divergences.
  • Dashboard updates every 1-minute candle open time, run it on more volatile symbols like EURUSD and BTCUSD to receive new price ticks faster.

Avis 1
Behzad Mohebali
81
Behzad Mohebali 2022.11.27 06:35 
 

An excellent and efficient tool Along with a professional and committed developer.

Hoping to add more features to this tool.

good luck

Produits recommandés
The indicator detects and displays Shark harmonic pattern (see the screenshot). The pattern is plotted by the extreme values of the ZigZag indicator (included in the resources, no need to install). After detecting the pattern, the indicator notifies of that by a pop-up window, a mobile notification and an email. The indicator highlights the process of the pattern formation and not just the complete pattern. In the former case, it is displayed in the contour triangles. After the pattern is comple
Wolfe Wave Scanner MT4
Reza Aghajanpour
4.56 (9)
**  All Symbols  x  All Timeframes  scan just by pressing scanner button ** *** Contact me  to send you instruction and add you in "Wolfe Wave Scanner group" for sharing or seeing experiences with other users. Introduction: A Wolfe Wave is created with five-wave patterns in price. It shows supply and demand and a fight towards a balance price. T hese waves of price actions can help traders identify the boundaries of   the trend . Also  It helps forecast how the price will move in the near future
Wise Men Indicator demo
Bohdan Kasyanenko
3 (2)
The indicator displays signals according to the strategy of Bill Williams on the chart. Demo version of the indicator has the same features as the paid, except that it can work only on a demo account . Signal "First Wise Man" is formed when there is a divergent bar with angulation.  Bullish divergent bar - with lower minimum and closing price in the upper half. Bearish divergent bar - higher maximum and the closing price at the bottom half. Angulation is formed when all three lines of Alligat
FREE
Introducing the Consecutive Green/Red Candle Alert Indicator for MT4 - Your Trend Spotting Companion! Are you ready to take your trading to the next level? We present the Consecutive Green/Red Candle Alert Indicator, a powerful tool designed to help you spot trends and potential reversals with ease. Whether you're a new trader looking for clarity in the market or an experienced pro seeking additional confirmation, this indicator is your trusted companion. Key Features of the Consecutive Green/Re
FREE
Chart Patterns Detect 15 patterns (Ascending Triangle, Descending Triangle, Rising Wedge, Falling Wedge, Bullish Flag, Bearish Flag, Bullish Rectangle, Bearish Rectangle Symmetrical triangle, Head and Shoulders, Inverted Head and Shoulders, Triple top, Triple Bottom, Double Top, Double Bottom) Use historical data to calculate the probability of each pattern to succeed (possibility to filter notification according to the chance of success) gives graphic indication about the invalidation level and
This product is a part of  ON Trade Waves Patterns Harmonic Elliot Wolfe you can test free version on EURJPY from this link  Wolf Waves Indicator Découvrez les Vagues de Loup - Votre Outil de Trading Ultime ! Êtes-vous à la recherche d'un outil puissant pour repérer facilement les Vagues de Loup sur n'importe quel intervalle de temps ? Ne cherchez plus ! Notre indicateur de Vagues de Loup fait le travail sans effort. Voici pourquoi il est parfait pour vous : Caractéristiques principales : Dé
Il s'agit d'une combinaison de plusieurs oscillateurs en un seul système de divergence qui donne l'impression d'un indicateur de divergence plus fiable. Il est basé sur plusieurs devises et fonctionne mieux sur une période de 15 minutes et plus. Chaque fois qu'un signal est généré, il affiche une alerte à l'utilisateur. Il est plus idéal s'il est combiné avec d'autres indicateurs d'action des prix ou systèmes de négociation.
MACDivergence MTF
Pavel Zamoshnikov
4.29 (7)
Advanced ideas of the popular MACD indicator: It detects and displays classic and reverse divergences (three methods of detecting divergences). It uses different color to highlight an uptrend and a downtrend. Two methods of determining a trend: а) MACD crosses the 0 level (classic signal); б) MACD crosses its own average (early signal). This is a multi-timeframe indicator: it can display MACD data from other timeframes. Two methods of drawing: classic histogram and line. It generates sound and v
Based on MACD indicator waves with standard parameters Applies Fibonacci levels to the last two MACD waves, positive and negative respectively, if at the moment the MACD indicator runs out of negative Wave - the color is green, if at the moment the MACD indicator runs out of positive Wave - the color is red. The Wave termination criterion is two ticks with a different MACD sign. Applies trend lines on the last four MACD Waves. Works well with the expert Figures MACD   https://www.mql5.com/ru/mar
Le Capteur de Tendance : La Stratégie du Capteur de Tendance avec Indicateur d'Alerte est un outil d'analyse technique polyvalent qui aide les traders à identifier les tendances du marché et les points d'entrée et de sortie potentiels. Elle présente une stratégie dynamique de Capteur de Tendance, s'adaptant aux conditions du marché pour une représentation visuelle claire de la direction de la tendance. Les traders peuvent personnaliser les paramètres selon leurs préférences et leur tolérance
FREE
SuperTrend V
Muhammad Hassaan
*This is TradingView indicator converted to mql4* The SuperTrend V indicator is a popular technical analysis tool used to identify trends and potential trend reversals in financial markets. It is based on the concept of the SuperTrend indicator but incorporates additional features and variations. The SuperTrend V indicator uses a combination of price action and volatility to determine the trend direction and generate trading signals. Here are the key components and features of the indicator:
This indicator is the undisputed leader among the indicators. And for this statement there is a good reason. The indicator builds a very high quality channel in which it generates signals to enter! What is the ideal strategy for the trader, since the trader always hesitates when choosing a strategy for the job. That is, this indicator will allow you to solve the dilemma of choosing a job by trend or to the channel, since it combines these two basic concepts. Working with the indicator is very
PZ The Zone
PZ TRADING SLU
This indicator displays buy or sell signals according to Bill Williams' definition of the Trading Zone. [ Installation Guide | Update Guide | Troubleshooting | FAQ | All Products ] Easy to use and understand Avoid trading flat markets Deterministic indicator with clear rules The indicator is non-repainting It implements alerts of all kinds It has straightforward trading implications. A blue arrow is a buy signal A red arrow is a sell signal According to Bill Williams trading in the zone helps to
MACD Divergence MT4
KEENBASE SOFTWARE SOLUTIONS
KT MACD Divergence shows the regular and hidden divergences build between the price and oscillator. If your trading strategy anticipates the trend reversal, you can include the MACD regular divergence to speculate the potential turning points. And if your trading strategy based on the trend continuation, MACD hidden divergence would be a good fit. Limitations of KT MACD Divergence Using the macd divergence as a standalone entry signal can be a risky affair. Every divergence can't be interpr
RSI TrendLine Divergency Message is an indicator for the MetaTrader 4 trading platform. Unlike the original indicator, this three in one version has a system of alerts that inform on market situation changes. It consists of the following signals: when the Main line crosses the levels of extreme zones and 50% level; when the Main line crosses the Trend line in the indicator window; divergence on the last bar. Parameters of levels of extremum, 50-level and divergence are adjustable. Parameters L
UPD1 Rsi Dots Dashboard
Vitaliy Kuznetsov
5 (1)
L'indicateur affiche les signaux basés sur l'oscillateur RSI terminal sur le graphique. Il est possible de filtrer les signaux répétés. Ici, l'oscillateur est utilisé pour rechercher un signal inverse. Il est recommandé comme point d'entrée dans les stratégies swing et le trading à partir de niveaux. Un tableau de bord multidevises est disponible. Avec lui, vous pouvez facilement basculer entre les graphiques. Dans les discussions sur les produits, vous pouvez suggérer un algorithme dans le
FREE
Free automatic Fibonacci is an indicator that automatically plots a Fibonacci retracement based on the number of bars you select on the BarsToScan setting in the indicator. The Fibonacci is automatically updated in real time as new highest and lowest values appears amongst the selected bars. You can select which level values to be displayed in the indicator settings. You can also select the color of the levels thus enabling the trader to be able to attach the indicator several times with differe
FREE
Robot scalpeur pour la période M5. Négocie sur la paire de devises GBPUSD. Ce robot a été spécialement développé par une société de traders professionnels pour le trading de la livre sterling. Le robot ouvre environ 5 à 15 transactions par jour. Il est préférable de négocier avec des courtiers qui ont un faible écart sur GBPUSD jusqu'à 10 pips. Le dépôt minimum recommandé pour commencer est de 500 $ ou plus. Avantages : n'utilise pas de martingale. pas un filet. chaque transaction a un stop l
Charles Henry Dow felt that if the industrial average and the railroad average both moved in the same direction, it meant that a meaningful economic shift was occurring. In brief, this indicator bases on the Dow's theory. It can create an index of market symbols, almost anythings index. For example: Index of the Euro, Index of the Great Britain Pound, Index of the Japanese Yen, Index of the Swiss Franc, Index of the Gold, Index of the New Zealand Dollar, Index of the Australian Dollar, Index of
Indicator without redrawing Divergent MAX The DivirgentMAX indicator is a modification based on the MACD. The tool detects divergence based on OsMA and sends signals to buy or sell (buy|sell), taking into account the type of discrepancies detected. Important!!!! In the DivirgentMAX indicator, the optimal entry points are drawn using arrows in the indicator's basement. Divergence is also displayed graphically. In this modification of the MACD, the lag problem characteristic of its predecessor
Forex Indicator "MACD with Trend ZigZag" for MT4 MACD   indicator itself is one of the most popular tool for trend trading "MACD with Trend ZigZag" is excellent for using   with Price Action entries or in combination with other indicators Use this indicator to select most accurate entry signals: - If MACD is above 0 (green color) and ZigZag line is upward - search only for Buy Price Action patterns -  If MACD is below 0 (pink color) and ZigZag line is downward - search only for Sell Price Action
This scanner shows the trend values of the well known indicator SuperTrend for up to 30 instruments and 8 time frames. You can get alerts via MT4, Email and Push-Notification as soon as the direction of the trend changes. This is the FREE version of the indicator: SuperTrend Scanner The free version works only on EURUSD and GBPUSD! Important Information How you can maximize the potential of the scanner, please read here: www.mql5.com/en/blogs/post/718074 With the following FREE indicator you
FREE
Atomic Analyst
Issam Kassas
5 (2)
Tout d'abord, il convient de souligner que cet indicateur de trading n'est ni repainting, ni redrawing et ne présente aucun délai, ce qui le rend idéal à la fois pour le trading manuel et automatisé. Manuel de l'utilisateur : réglages, entrées et stratégie. L'Analyste Atomique est un indicateur d'action sur les prix PA qui utilise la force et le momentum du prix pour trouver un meilleur avantage sur le marché. Équipé de filtres avancés qui aident à éliminer les bruits et les faux signaux, et à
KT Stoch Divergence MT4
KEENBASE SOFTWARE SOLUTIONS
Divergence is one of the vital signals that depicts the upcoming price reversal in the market. KT Stoch Divergence shows the regular and hidden divergences build between the price and stochastic oscillator. Limitations of KT Stoch Divergence Using the Stochastic divergence as a standalone entry signal can be risky. Every divergence can't be interpreted as a strong reversal signal. For better results, try to combine it with price action and trend direction. Features Marks regular and hidde
Shark Surfer is a new generation indicator applying a well-established trend-following trading. The product is good both for scalping, as well as medium- and long-term trading. Shark Surfer analyzes a selected symbol and shows the recommended market entry, take profit and stop loss levels. Shark Surfer trades on all symbols and timeframes. It also features email and push notifications concerning the new trading signals. The indicator searches for suitable market entry points on an already formed
This indicator combines double bottom and double top reversal chart patterns together with detection of divergences between the price chart and the Momentum oscillator. Features Easily detect strong reversal signals Allows to use double top/bottom and Momentum divergence signals combined or independently Get email and/or push notification alerts when a signal is detected Custom colors can be used The indicator is not repainting Can easily be used in an EA (see below) Inputs ENABLE Double Top
Supreme TrendHisto est un indicateur de tendance qui donne des signaux de tendance à la baisse et à la hausse, l'indicateur agit comme un histogramme, l'indicateur ne repeint/peint pas/retarde. Stratégie Achat d'échange : l'histogramme passe au-dessus de 0,65, nous ouvrons l'achat, quant à la sortie, vous pouvez soit sortir lorsque l'histogramme atteint le niveau 0,70, soit bien sortir. Commerce de vente : l'histogramme passe en dessous de -0,65, nous ouvrons le commerce d'achat, quant à
FX Flow
Eva Stella Conti
FX Flow   indicator can be used as an anticipator of the next trend, preferably confirmed by Price Action or another oscillator (RSi, Stochastic ..). It takes the money flows of the major currencies USD EUR GBP AUD NZD CAD CHF JPY into account, and processes them. Excellent tool for indices, but also for correlations between currencies. Works on each timeframes.  Blue line: Bull market Yellow line: Bear market Note : if the indicator opens the window, but does not draw lines, load the histo
Cet indicateur innovant de mesure de la force des devises de INFINITY est une aide indispensable pour les scalpers et les commerçants qui négocient à long terme. Le système d'analyse De la force/faiblesse des devises est connu depuis longtemps et utilisé sur le marché par les principaux traders du monde. Tout commerce d'arbitrage n'est pas complet sans cette analyse. Notre indicateur détermine facilement la force des devises sous-jacentes les unes par rapport aux autres. Il affiche des graphiqu
FREE
Les acheteurs de ce produit ont également acheté
Trade Assistant MT4
Evgeniy Kravchenko
4.43 (180)
It helps to calculate the risk per trade, the easy installation of a new order, order management with partial closing functions, trailing stop of 7 types and other useful functions. Attention, the application does not work in the strategy tester. Manual, Description, Download demo Line function -   shows on the chart the Opening line, Stop Loss, Take Profit. With this function it is easy to set a new order and see its additional characteristics before opening.   Risk management  - The risk
Bienvenue sur Trade Manager EA, l’outil ultime de gestion des risques conçu pour rendre le trading plus intuitif, précis et efficace. Ce n’est pas seulement un outil d’exécution d’ordres ; c’est une solution complète pour la planification des trades, la gestion des positions et le contrôle des risques. Que vous soyez débutant, trader expérimenté ou scalpeur ayant besoin d’une exécution rapide, Trade Manager EA s’adapte à vos besoins, offrant une flexibilité sur tous les marchés, des devises et i
Exp COPYLOT CLIENT for MT4
Vladislav Andruschenko
4.69 (62)
Copieur commercial pour MetaTrader 4.       Il copie les transactions de change, les positions et les ordres de tous les comptes. C'est l'un des meilleurs copieurs commerciaux       MT4 - MT4, MT5 - MT4       pour le       COPYLOTE MT4       version (ou       MT4 - MT5 MT5 - MT5       pour le       COPYLOTE MT5       version). Version MT5 Description complète   +DEMO +PDF Comment acheter Comment installer     Comment obtenir des fichiers journaux     Comment tester et optimiser     Tous le
Custom Alerts MT4
Daniel Stein
5 (1)
Custom Alerts est un outil polyvalent de surveillance multi-marchés qui identifie les configurations prometteuses sur les huit principales devises (USD, CAD, GBP, EUR, CHF, JPY, AUD et NZD), ainsi que sur le GOLD (XAU), les 28 paires Forex et GOLD basées sur ces devises, et jusqu'à sept indices tels que US30, UK100, WTI, Bitcoin, etc. Il est entièrement personnalisable. L'outil rassemble les données de nos indicateurs FX Power, FX Volume et IX Power et vous informe des événements importants.  
The product will copy all telegram signal to MT4   ( which you are member  ) , also it can work as remote copier.  Easy to set up, copy order instant, can work with almost signal formats, image signal, s upport to translate other language to English Work with all type of channel or group, even channel have "Restrict Saving Content", work with  multi channel, multi MT5 Work as remote copier: with signal have ticket number, it will copy exactly via ticket number. Support to backtest signal. How to
Trade Dashboard MT4
Fatemeh Ameri
5 (38)
Tired of complex order placement and manual calculations? Trade Dashboard is your solution. With its user-friendly interface, placing orders becomes effortless, by a single click, you can open trades, set stop loss and take profit levels, manage trade lot size, and calculate risk to reward ratios, allowing you to only focus on your strategy. Say goodbye to manual calculations and streamline your trading experience with Trade Dashboard. Download  Demo Version  right now. You can find  Details
TradePanel MT4
Alfiya Fazylova
4.9 (86)
Trade Panel est un assistant commercial multifonctionnel. L'application contient plus de 50 fonctions de trading manuel et vous permet d'automatiser la plupart des actions de trading. Avant d'acheter, vous pouvez tester la version Démo sur un compte démo. Démo ici . Instructions complètes ici . Commerce . Vous permet d'effectuer des opérations de trading de base en un clic : Ouvrir les ordres et positions en attente. Ouverture d'une grille d'ordres. Clôturez les ordres et les positions en attent
Copiez les signaux de n'importe quel canal dont vous êtes membre (   sans avoir besoin d'un jeton de bot ou de permissions d'administrateur  directement vers votre MT4. Il a été conçu en pensant à l'utilisateur tout en offrant de nombreuses fonctionnalités dont vous avez besoin Ce produit est présenté dans une interface graphique conviviale et attrayante. Personnalisez vos paramètres et commencez à utiliser le produit en quelques minutes ! Guide de l'utilisateur + Démo  | Version MT5 | Versio
Grid Manual MT4
Alfiya Fazylova
4.72 (18)
Grid Manual est un panneau de trading permettant de travailler avec une grille d'ordres. L'utilitaire est universel, possède des paramètres flexibles et une interface intuitive. Il fonctionne avec une grille d'ordres non seulement dans le sens des pertes, mais aussi dans le sens de l'augmentation des profits. Le commerçant n'a pas besoin de créer et de maintenir une grille d'ordres, l'utilitaire le fera. Il suffit d'ouvrir une commande et "Grid Manual" créera automatiquement une grille de comman
News Trapper EA
Noha Mohamed Fathy Younes Badr
4.86 (14)
News trapper EA un expert unique fait pour le trading de news Il a été développé en utilisant des années d'expérience dans le trading en direct {entièrement automatique}  très important Le programme contient des paramètres flexibles pour le trading sur les nouvelles du calendrier économique. Il ne peut pas être vérifié dans le testeur de stratégie. Uniquement du vrai travail. Dans les paramètres du terminal, vous devez ajouter le site d'actualités à la liste des URL autorisées. Cliquez sur Ou
Summer 40% discount ($149 -> $88) Everything for chart Technical Analysis indicator mt4 in one tool Draw your supply demand zone with rectangle and support resistance with trendline and get alerts to mobile phone or email alert -  Risk reward indicator Video tutorials, manuals, DEMO download   here .  Find contacts on my   profile . 1.   Extended rectangles and trendlines Object will be extended to the right edge of the chart when price will draw new candles on chart. This is rectangle extend
Telegram To MT4 Receiver
Levi Dane Benjamin
5 (3)
Copiez les signaux de n'importe quel canal dont vous êtes membre (y compris privé et restreint) directement sur votre MT4.  Cet outil a été conçu en pensant à l'utilisateur tout en offrant de nombreuses fonctionnalités dont vous avez besoin pour gérer et surveiller les transactions. Ce produit est présenté dans une interface graphique conviviale et visuellement attrayante. Personnalisez vos paramètres et commencez à utiliser le produit en quelques minutes ! Guide de l'utilisateur + Démo  | Ve
On the occasion of the first days of publishing and attracting first customers, a 50% discount $120 for first 10 user (3 license left) Next price is $160 > $200 > $240 Don't forget to send a message after buying (not renting) to add you to our VIP group for free. Live OrderBoook, Another high-level tool by Ziwox Order Book An order book is an electronic list of buy and sell orders for a specific asset, organized by price level. It provides real-time data on market depth, showing the amount o
Comprehensive on chart trade panel with the unique ability to be controllable from mobile as well. Plus has a library of downloadable configuration, e.g. exit rules, extra panel buttons, pending order setup and more. Please see our product video. Works with all symbols not just currency pairs. Features On chart panel plus controllable from free app for Windows, iPhone and Android Built-in script engine with library of downloadable configuration, e.g. add 'Close All Trades in Profit' button, exit
Trade Manager MT4 DaneTrades
Levi Dane Benjamin
4.33 (9)
Trade Manager pour vous aider à entrer et sortir rapidement des transactions tout en calculant automatiquement votre risque. Y compris des fonctionnalités pour vous aider à éviter le sur-trading, le trading de vengeance et le trading émotionnel. Les transactions peuvent être gérées automatiquement et les mesures de performances du compte peuvent être visualisées dans un graphique. Ces fonctionnalités rendent ce panneau idéal pour tous les traders manuels et contribuent à améliorer la plateforme
TPSpro Trade PRO
Roman Podpora
5 (4)
EN MODE TEST (dans le testeur), la fonctionnalité du panneau n'est PAS ACTIVE. Nous avons seulement fourni une représentation visuelle du panneau lui-même. Un outil capable de calculer instantanément la taille ou le risque de la position en fonction d'un niveau de stop loss donné est essentiel tant pour les traders professionnels que pour les débutants. L'utilitaire de trading TRADE PRO fournit des calculs rapides et précis, vous aidant à prendre des décisions dans des conditions de temps limi
VirtualTradePad mt4 Extra
Vladislav Andruschenko
4.88 (57)
Panneau de trading pour trader en 1 clic.   Travailler avec des positions et des commandes!   Trading à partir du graphique ou du clavier. En utilisant notre panel de trading, vous pouvez trader en un clic à partir du graphique et effectuer des opérations de trading 30 fois plus rapidement que le contrôle MetaTrader standard. Des calculs automatiques de paramètres et de fonctions qui facilitent la vie d'un trader et aident un trader à mener ses activités de trading beaucoup plus rapidement et p
BBMA Oma Ally Signals Scanner (BBMA Oma Ally Analyzer Dashboard EA) This is a multi-pair and multi scanner dashboard to find the key signal of BBMA Oma Ally Strategy BBMA consists of the use of 2 indicators: Moving Averages Bollinger Bands BBMA consists of many types of entries: Reentry Extreme Rejection EMA50 GAP (EMA50 to Upper/Lower BB) MHV Full Setup (CSE>TPW>MHV>Direction>Reentry) There are many multi timeframe signals based on this strategy. RRE (Reentry - Reentry - Extreme) REE (Reentry
Layer Master Toolbox
Peter Andrew Thomas
5 (3)
GRID TRADING - Layer Master tool kit is the ultimate, easy to use trading toolkit makes it simple to layer grids of Orders over any entry level. This toolkit will make it simple and fast to Open / Enter and Manage your grid trades on MT4. Every function is simple - but clicking and dragging the order zone - you define an area you want your orders, then you can quickly drag the SL and TP levels to where you want them. Hit one button and your orders are sent!!!  Features: It is capable to send h
The product will copy all  Discord  signal   to MT4   ( which you are member  ) , also it can work as remote copier.  Easy to set up. Work with almost signal formats, support to translate other language to English Work with multi channel, multi MT4. Work with Image signal. Copy order instant, auto detect symbol. Work as remote copier: with signal have ticket number, it will copy exactly via ticket number. How to setup and guide: Let read all details about setup and download Discord To MetaTrade
Ultimate Trade Copier
BLAKE STEVEN RODGER
5 (1)
This trade copy utility allows you to instantly and seamlessly replicate and synchronize unlimited orders from multiple master accounts to multiple slave accounts on your local machine. You can create custom channels (or portfolios) with advanced filtering capabilities to copy from multiple master accounts to multiple slave accounts. Moreover, you can tailor these channels with a range of lot sizing and trade condition options to ensure that copied trades outperform the original source. You can
Copieur->Interface d'interaction ->>>>Recommandé pour une utilisation sur des ordinateurs Windows ou VPS Windows Fonctions de base : La vitesse d'interaction du copy trading est inférieure à 0,5 s 95 % des symboles sur différentes plates-formes (cas particuliers tels que différents suffixes) sont automatiquement mis en correspondance, aucun réglage manuel n'est requis 4 modes de calcul de lots, qui peuvent être définis en fonction de différentes sources de signaux Plusieurs plates-formes, plusi
Smart Trading Copilot :   C'est un assistant de trading intelligent qui vous aidera à gérer vos opérations quotidiennes. Le Smart Trading Copilot est équipé d'un panneau de trading convivial, avec un design moderne et utilisant une technologie de pointe. Le Smart Trading Copilot offre un large éventail de fonctionnalités : 1. Support de gestion des risques : Il calcule automatiquement la taille de lot appropriée en fonction du pourcentage de risque spécifié et du stop loss, aidant ainsi les
DrawDown Limiter MT4
Haidar, Lionel Haj Ali
5 (8)
Expert Advisor "Drawdown Limiter"  Vous êtes au bon endroit si vous recherchez un contrôle de drawdown, un limiteur de drawdown, une protection du solde, une protection de l'équité ou une limite quotidienne de drawdown en rapport avec les entreprises de gestion de capitaux (Prop Firm), FTMO, My Forex Fund, ou si vous souhaitez protéger votre compte de trading. Avez-vous déjà eu du mal à contrôler votre drawdown en tradant sur des comptes financés ? Cet EA est fait pour vous. Les entreprises d
Unlimited Trade Copier Pro is a tool to copy trade remotely to multiple MT4, MT5 and cTrader accounts at different computers/locations over internet. This is an ideal solution for you if you are a signal provider and want to copy your trades to other receivers globally on your own rules. One provider can copy trades to multiple receivers and one receiver can get trade from multiple providers as well. The provider can even set the subscription expiry for each receiver, so that receiver will not b
The Expert Advisor will help you forward all pop-up alert with screenshot from  MetaTrader 4 to Telegram channel/ group, also forward all notifications to Telegram. Parameters  -  Telegram Bot Token - create bot on Telegram and get token.  -  Telegram Chat ID  - input your Telegram user ID,  group / channel ID  -  Forward Alert - default true, to forward alert.  -  Send message as caption of Screenshot - default false, set true to send message below Screenshot  How to setup and guide  - Telegram
Trade Copier Agent est conçu pour copier des transactions entre plusieurs comptes/terminaux MetaTrader(4/5). Avec cet outil, vous pouvez agir en tant que fournisseur (source) ou récepteur (destination). Toutes les actions de trading seront copiées du fournisseur vers le récepteur sans délai. Cet outil vous permet de copier des transactions entre plusieurs terminaux MetaTrader sur le même ordinateur avec des vitesses de copie ultra-rapides inférieures à 0,5 seconde. Guide d'installation et d'ent
Strategy Builder offers an incredible amount of functionality. It combines a trade panel with configurable automation (covert indicators into an EA), real-time statistics (profit & draw down) plus automatic optimization of SL, TP/exit, trading hours, indicator inputs. Multiple indicators can be combined into an single alert/trade signal and can include custom indicators, even if just have ex4 file or purchased from Market. The system is easily configured via a CONFIG button and associated pop-up
Ultimate Trailing Stop EA
BLAKE STEVEN RODGER
4.33 (15)
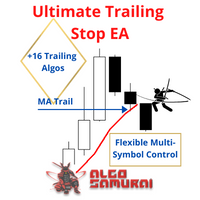
This EA Utility allows you to manage (with advanced filtering) unlimited open orders (manual or EA) with 16 trailing stop methods: fixed, percent, ATR Exit, Chandelier Exit, Moving Average, Candle High Low Exit, Bollinger Bands, Parabolic, Envelope, Fractal, Ichimoku Kijun-Sen, Alligator, Exit After X Minutes or Bars, RSI and Stochastic. The trailing stop can be either real or virtual, and you can exit fully or with a partial close percent on touch or bar close.  Moreover, you can add (overr
2024 50% discount ($199 -> $99) Advanced trading tool: One click smart orders that execute under your conditions Developed by trader for trading community:  position size calculator (lot size), open position after price action, strategy builder, set and forget trading, mobile notifications... Risk Management -  Risk percentage position size calculator, gain percentage, target risk reward ratio, spread and commissions are included in calculations 7 Advanced order types   - Set and forget tradi
Plus de l'auteur
RSI divergence indicator finds divergences between price chart and   RSI   indicator and informs you with alerts (popup, mobile notification or email). Its main use is to find trend reversals in the chart. Always use the divergence indicators with other technical assets like support resistance zones, candlestick patterns and price action to have a higher possibility to find trend reversals. Three confirmation type for   RSI   divergences: RSI   line cross 50 level Price returns to previous H/L C
FREE
RSI Divergence Scanner is a multi-timeframe and multi-symbol dashboard and alert that checks all timeframes and symbols to find regular and hidden divergences between price chart and RSI indicator. This divergence scanner is integrated with support and resistance zones so you can check the RSI divergences in the most important areas of the chart to find trend reversals in price chart. Download demo version   (works on M4,M5,M6,M12,H3,H8 timeframes) Full description of scanner parameters ->   cli
40% off. Original price: $50 Support and Resistance Dashboard for MT4 is a multi-timeframe and multi-symbol scanner and alert system that finds S/R zones and pivot points for all timeframes and symbols and alerts when price has interaction with them. If you are using support and resistance (or supply and demand) zones in your trading strategy, this dashboard and its alert and filtering system is a big time saver for you. Download demo version   (works on M 1,M5,M30,W1   timeframes) Full descrip
50% off. Original price: $60 Candlestick Pattern Scanner is a multi-timeframe and multi-symbol dashboard and alert system that checks all timeframes and currency pairs for different candlestick patterns that are formed in them. Scanner is integrated with support and resistance zones so you can check the candlestick patterns in the most important areas of the chart to find breakout and reversal patterns in the price chart. Download demo version   (works on M1,M5,M30,W1 timeframes) Read the full
MACD divergence indicator finds divergences between price chart and MACD indicator and informs you with alerts (popup, mobile notification or email) . Its main use is to find trend reversals in the chart. Always use the divergence indicators with other technical assets like support resistance zones, candlestick patterns and price action to have a higher possibility to find trend reversals. Three confirmation type for MACD divergences: MACD line cross zero level Price returns to previous H/L Crea
FREE
MACD Divergence Scanner is a multi-timeframe and multi-symbol dashboard and alert that checks all timeframes and symbols to find regular and hidden divergences between price chart and MACD indicator. This divergence scanner is integrated   with support and resistance zones so you can check the MACD divergences in the most important areas of the chart to find trend reversals in the price chart. Download demo version   (works on M4,M5,M6,M12,H3,H8 timeframes) Full description of scanner parameters
RSI divergence indicator finds divergences between price chart and RSI   indicator and informs you with alerts (popup, mobile notification or email). Its main use is to find trend reversals in the chart. Always use the divergence indicators with other technical assets like support resistance zones, candlestick patterns and price action to have a higher possibility to find trend reversals. Three confirmation type for RSI   divergences: RSI   line cross 50 level (doesn't repaint) Price returns to
FREE
40% off. Original price: $50 Moving Average Trend Scanner is a multi symbol multi timeframe triple MA crossover dashboard that helps traders to monitor, and identify potential market trends from one chart. This panel scans 3 moving averages in up to 28 configurable instruments and 9 timeframes for triple moving average alignment and moving average crossover  with a deep scan feature to scan all market watch symbols (up to 1000 instruments!). Download Demo here  (Scans only M1 and M5) Settin
Ichimoku Trend Alert is the Ichimoku Kinko Hyo indicator with Alerts and signal filters. Ichimoku Trend Alert features: Optional check of Ichimoku cloud, Tenkan sen(Conversion Line), Kijun sen(Base Line), Senkou span A, Senkou span B, and Chikou span relative to price, and more. Popup, email, and phone notification alerts for selected symbols and timeframes. There are 9 classic Ichimoku trend filters you can enable/disable in settings: Price/Cloud Order:   Checks the price position relative
FREE
40% off. Original price: $50 Moving Average Trend Scanner is a multi symbol multi timeframe triple MA crossover dashboard that helps traders to monitor, and identify potential market trends from one chart. This panel scans 3 moving averages in up to 28 configurable instruments and 9 timeframes for triple moving average alignment and moving average crossover with a deep scan feature to scan all market watch symbols (up to 1000 instruments!).   Download Demo   here   (Scans only M1 and M6) Sett
Moving Average Trend Alert is a triple MA indicator that helps traders to identify potential market trends based on 3 MAs alignment and crossover. Moving Average Trend Alert features: Customizable short-term, medium-term, and long-term MAs. Option to filter signals based on a minimum distance between moving averages to avoid premature MAs alignment. Optional Filter of signals with RSI indicator overbought/oversold levels. Optional Filter of signals with ADX indicator. Popup, email, and phone n
FREE
40% off. Original price: $50 Support and Resistance Dashboard for MT5 is a multi-timeframe and multi-symbol scanner and alert system that finds S/R zones and pivot points for all timeframes and symbols and alerts when price has interaction with them. If you are using support and resistance (or supply and demand) zones in your trading strategy, this dashboard and its alert and filtering system is a big time saver for you. Download demo version   (works on M4,M5,M6,M12,H3,H8 timeframes) Full desc
50% off. Original price: $60 Support and Resistance zones indicator for MT4 is a multi-timeframe panel and alert that finds support and resistance zones and pivot points for all timeframes of MetaTrader 4 and gives alert when price has interaction with them. Download demo version (works on GBPUSD, EURJPY and NZDUSD symbols) Read the full description of scanner parameters in the blog page . Many unique features in one indicator: Integrating support and resistance zones and pivot points in one
25% off. Original price: $40 RSI Scanner is a multi symbol multi timeframe RSI dashboard that monitors Relative Strength Index indicator for price entering and exiting overbought and oversold in up to 28 symbols and 9 timeframes. Download Demo here  (Scans only M1, M5 and M10) Settings description   here MT4 version   here RSI Scanner features: Signals RSI entering and exiting the overbought and oversold zones. Monitors 28 customizable instruments and 9 timeframes at the same time. Supports
50% off. Original price: $60 Ichimoku Assistant is a multi-timeframe panel and alert system that scans all timeframes for multiple rules related to different ichimoku strategies. The Ichimoku indicator has 5 different lines, including Tenkan-sen, Kijun-sen, Senku Span A, Senku Span B and Chikou Span. This scanner checks the status of these lines compared to each other and gives alerts based on your selected rules. If you are using ichimoku kinko hyo in your trading strategy, this scanner and it
MACD divergence indicator finds divergences between price chart and MACD indicator and informs you with alerts (popup, mobile notification or email). Its main use is to find trend reversals in the chart. Always use the divergence indicators with other technical assets like support resistance zones, candlestick patterns and price action to have a higher possibility to find trend reversals. Three confirmation type for MACD divergences: MACD line cross zero level Price returns to previous H/L Creat
FREE
50% off. Original price: $60 Candlestick Pattern Scanner is a multi-timeframe and multi-symbol dashboard and alert system that checks all timeframes and currency pairs for different candlestick patterns that are formed in them. Scanner is integrated   with support and resistance zones so you can check the candlestick patterns in most important areas of the chart to find breakout and reversal patterns in the price chart. Download demo version   (works on M4,M5,M6,M12,H3,H8 timeframes) Read the f
50% off. Original price: $60 Order Manager is a trade assistant and trade copier with a money manager that helps traders open, modify and close manual trades and also copy their trades between multiple accounts in the most simple way to help them focus more on their market analysis and open orders with just a few clicks. Download Demo here  (It only works on demo accounts) Full guide   here MT5 version here Order Manager features: Works on all instruments such as currency pairs, indexes, CF
50% off. Original price: $375 Reward Multiplier is a semi-automatic trade manager based on pyramid trading that opens additional orders with the running profit of your trades to maximize return exponentially without increasing the risk. Unlike other similar EAs, this tool shows potential profit/loss and reward to risk ratio before even entering the first trade! Download Demo here  (starting lot is fixed at 0.01) Guide + tips here MT5 version   here You only open the first order. When your
Ichimoku Trend Alert is the Ichimoku Kinko Hyo indicator with Alerts and signal filters. Ichimoku Trend Alert features: Optional check of Ichimoku cloud, Tenkan sen(Conversion Line), Kijun sen(Base Line), Senkou span A, Senkou span B, and Chikou span relative to price, and more. Popup, email, and phone notification alerts for selected symbols and timeframes. There are 9 classic Ichimoku trend filters you can enable/disable in settings: Price/Cloud Order: Checks the price position relative to
FREE
Moving Average Trend Alert is a triple MA indicator that helps traders to identify potential market trends based on 3 MAs alignment and crossover. Moving Average Trend Alert features: Customizable short-term, medium-term, and long-term MAs. Option to filter signals based on a minimum distance between moving averages to avoid premature MAs alignment. Optional Filter of signals with RSI indicator overbought/oversold levels. Optional Filter of signals with ADX indicator. Popup, email, and phone n
FREE
Reward Multiplier is a semi-automatic trade manager based on pyramid trading that opens additional orders with the running profit of your trades to maximize return exponentially without increasing the risk.Unlike other similar EAs, this tool shows potential profit/loss and reward to risk ratio before even entering the first trade! Download full version here  ( In the mini version. Starting lot is fixed at 0.01 (or minimum allowed lot size ) Guide + tips here MT4 version   here You only open the
FREE
Advanced Indicator Scanner is a multi-symbol multi-timeframe scanner that works with hundreds of custom indicators available across the web including mql5 website market and codebase indicators. Advanced Indicator Scanner features: Scans your indicator in 28 customizable instruments and 9 timeframes. Monitors up to 2 lines(buffers) of an indicator. Showing of indicator value on buttons. You can choose between 3 alert modes:  Single symbol and timeframe Multiple timeframes of a symbol Multipl
50% off. Original price: $60 Triangle Finder is a multi symbol multi timeframe dashboard that monitors and finds symmetrical triangle pattern in 28 symbols and 9 timeframes with a deep scan feature to scan all market watch symbols (up to 1000 instruments!). Download Demo here  (Scans only M1 and M5) Settings description   here MT5 version   here Triangle Finder features: Realtime monitoring of 28 customizable instruments and 9 timeframes at the same time. Deep scan mode to scan all market w
25% off. Original price: $40 RSI Scanner is a multi symbol multi timeframe RSI dashboard that monitors Relative Strength Index indicator for price entering and exiting overbought and oversold in up to 28 symbols and 9 timeframes. Download Demo here  (Scans only M1 and M5) Settings description   here MT5 version   here RSI Scanner features: Signals RSI entering and exiting the overbought and oversold zones. Monitors 28 customizable instruments and 9 timeframes at the same time. You can choos
Reward Multiplier is a semi-automatic trade manager based on pyramid trading that opens additional orders with the running profit of your trades to maximize return exponentially without increasing the risk. Unlike other similar EAs, this tool shows potential profit/loss and reward to risk ratio before even entering the first trade! Download full version here  ( In the mini version. Starting lot is fixed at 0.01 (or minimum allowed lot size ) Guide + tips here MT5 version   here You only open the
FREE
40% off. Original price: $50 ATR Scanner Pro is a multi symbol multi timeframe volatility scanner that monitors and analyzes Average True Range indicator value in up to 28 symbols and 9 timeframes in 3 modes : ATR value:   As a volatility dashboard it shows the ATR indicator value in all pairs and timeframes and signals when the ATR value reaches a maximum or minimum in a given duration. Short term ATR/Long term ATR ratio:  It shows ratio of 2 ATRs with different periods. It's useful in detec
50% off. Original price: $60 Order Manager is a trade assistant and trade copier with a money manager that helps traders open, modify and close manual trades and also copy their trades between multiple accounts in the most simple way to help them focus more on their market analysis and open orders with just a few clicks. Download Demo here  (It only works on demo accounts for 14 days) Full guide   here MT4 version here Order Manager features: Works on all instruments such as currency pairs,
25% off. Original price: $40 Stochastic Scanner is a multi symbol multi timeframe Stochastic dashboard that monitors the indicator for price entering and exiting overbought and oversold in up to 28 symbols and 9 timeframes. Download Demo here  (Scans only M1, M5 and M10) Settings description   here MT4 version   here Stochastic Scanner features: Signals price entering and exiting the overbought and oversold zones. Monitors up to 28 customizable instruments and 9 timeframes at the same time.
50% off. Original price: $60 Triangle Finder is a multi symbol multi timeframe dashboard that finds symmetrical triangle pattern in 28 symbols and 9 timeframes with a deep scan feature to scan all market watch symbols (up to 1000 instruments!). Download Demo here  (Scans only M1, M5 and M10) Settings description   here MT4 version   here Triangle Finder features: Realtime monitoring of 28 customizable instruments and 9 timeframes at the same time. Deep scan mode to scan all market watch sym
Filtrer:
Behzad Mohebali
81
Behzad Mohebali 2022.11.27 06:35 
 

An excellent and efficient tool Along with a professional and committed developer.

Hoping to add more features to this tool.

good luck

Répondre à l'avis
Version 6.3 2023.11.02
+ Stochastic indicator confirmation type added to the scanner. By selecting this option, divergence will confirm when Stochastic lines cross each other. You also can choose that lines cross must be in overbought or oversell levels.
+ "Confirm with Candlestick Patterns before other confirmations" option added to the scanner, by enabling it the divergences must first be confirmed by candlestick patterns, then confirm by selected confirmation type.
+ The option “Mark divergences that happen after a long trend” added to the dashboard (for “Check trend length for regular divergences” parameter).
+ Minor bug fixes and improvements.
Version 6.1 2023.10.10
+ Average body filter (for 2-bar and 3-bar patterns) and average height filter (for 1-bar patterns) parameters added to the dashboard, by enabling these filters you can set the dashboard to show only divergences that confirm by big size candlestick patterns.
+ Now you can use dashboard signals in your EAs. If you set the dashboard to show the divergences in new charts, then you can use the divergence information embedded in the Arrow name in your EA.
- Fixed a bug that caused the dashboard to sometimes show invalid divergences on dashboard startup.
Version 6.0 2023.08.30
+ A parameter added to the scanner to use a second ZigZag indicator for detecting more divergences. Enabling this parameter slows down the scanner, so use it if you are loading a limited number of symbols and timeframes in the dashboard.
+ Minor bug fixes and improvements.
Version 5.9 2023.08.02
+ Bug fixes and improvements.
Version 5.8 2023.07.05
+ Dashboard startup time has been reduced, it loads faster when attached to the chart or changing input parameters.
+ An option added to the dashboard to not remove the failed divergences from the dashboard, it is useful when you want to practice the divergence trading.
+ Now you can choose what information to see on the dashboard cells: “Divergence type,candles passed” or “Divergence type, divergence direction,candles passed” or “Compact detailed info”.
+ Improvement in candlestick pattern confirmation rules.
+ Minor changes and improvements.
Version 5.7 2023.06.12
+ Piercing, Dark Cloud and Harami patterns added to the candlestick pattern confirmation for divergences.
! Fixed a problem in MA filters, now filter direction parameters must work correctly.
Version 5.6 2023.06.07
+ Improvement in divergence detection rules.
+ Improvement in MA filters, now you can set for each filter to be applied to which type of divergence (regular, hidden or both), also the filters can be reversed separately.
Version 5.4 2023.05.29
+ Now you can filter divergences with 2 Moving Average indicators from same or upper timeframes, you can set timeframe and period of these MAs separately for each timeframe of the dashboard.
+ You can reverse the Moving Average filters and find divergences that are in the opposite direction of the MA.
+ Minor improvements.
Version 5.3 2023.05.20
+ Candlestick patterns (7 pattern) added to "Confirmation type" parameter, with this option divergence will be confirmed if a candlestick pattern forms after it. This option is experimental and will be removed if it doesn't work as expected.
+ Minor bug fixes and improvements.
Version 5.2 2023.04.01
Fixed a bug in changing the cell colors for S/R zones in the previous update.
Version 5.1 2023.02.23
+ Added Moving Average indicator filter, you can now set the scanner to find divergences based on the direction of the moving average and/or the position of the divergence relative to the MA.
- Fixed a bug in loading symbols from the symbol list when the symbol names have lowercase letters.
Version 5.0 2023.02.22
+ Now you can set the scanner to only find divergences that happen at the end of a long trend.
+ Two new confirmation type ("Changing the color of Heiken Ashi indicator" and "Strong Reversing Candle") added to the scanner and "New zigzag leg" confirmation type removed from the scanner.
+ Two filters (and their parameters) added for detecting the strong reversing candle.
+ You can choose to show the divergence lines and arrow on the opened charts with custom chart template (don't forget to add the RSI divergence indicator to the chart template and save it).
+ Minor improvements and bug fixes.
Version 4.0 2023.01.14
+ "Max. divergence pullback percent (Fibonacci retracement)" option added to the scanner, with this option you can set the maximum acceptable percent for the last pullback in the trend.
+ "Min. length ratio (last wave/previous wave)" options added to the scanner, with this parameter you can define the minimum acceptable length of the last wave of the trend compared to the length of the wave before it.
+ "Max. length ratio (last wave/previous wave)" options added to the scanner, with this parameter you can define the maximum acceptable length of the last wave of the trend compared to the length of the wave before it.
+ "Min. time ratio (last wave/previous wave)" parameter added to the scanner, with this parameter you can define the minimum acceptable duration of the last wave of the trend compared to the duration of the wave before it.
+ "Max. time ratio (last wave/previous wave)" parameter added to the scanner, with this parameter you can define the maximum acceptable duration of the last wave of the trend compared to the duration of the wave before it.
+ Improving the dashboard appearance.
- Fixing a bug where sometimes the dashboard didn't send immediate alert for new divergences.
Version 3.6 2022.12.21
- "Min. divergence pullback percent (Fibonacci retracement)" option added to the scanner, this option helps to filter out divergences caused by small pullbacks in the trend.
- "Cell background color" option added for the dashboard.
Version 3.5 2022.12.07
+ You can select for each symbol to alert only bullish or bearish divergences by clicking on its cell on dashboard.
+ Panel cells show the strength of divergences (weak, medium, strong).
+ Panel cells show when divergence happens in RSI oversold/overbought levels (by showing O letter in the cell).
+ You can see divergence lines for both price and RSI indicator when checking divergences in new charts.
+ You can see nearest support and resistance zones when checking divergences in new charts to see the price distance to S/R levels.
Version 3.4 2022.10.29
+ A parameter added to enabling alerts for selected timeframes on startup of dashboard.
Version 3.3 2022.10.03
+ Added an option to receive alert immediately after divergence detected by scanner (before any confirmation, this may create repeated alerts).
+ Added a parameter to automatically open divergence chart after detecting the divergence, without clicking on dashboard cell.
+ Now you can split the symbols into 3 columns for showing more symbols in the dashboard on a single chart.
Version 3.1 2022.09.04
+ Finding hidden divergences added to the scanner.
+ Now you can load a custom chart template when clicking on the dashboard cells.
! Fixed a bug in showing the zones when MetaTrader starts up.
! Minor bug fixes and improvements.
Version 2.2 2022.06.28
Fixed a bug in splitting symbols into 2 columns.
Version 2.1 2022.06.27
The option “Split symbols in 2 columns” added to the parameters, now you can show more symbols in the dashboard on a single chart.