Higher High Lower Low MT4
- Indicateurs
- KEENBASE SOFTWARE SOLUTIONS
- Version: 1.0
- Activations: 5
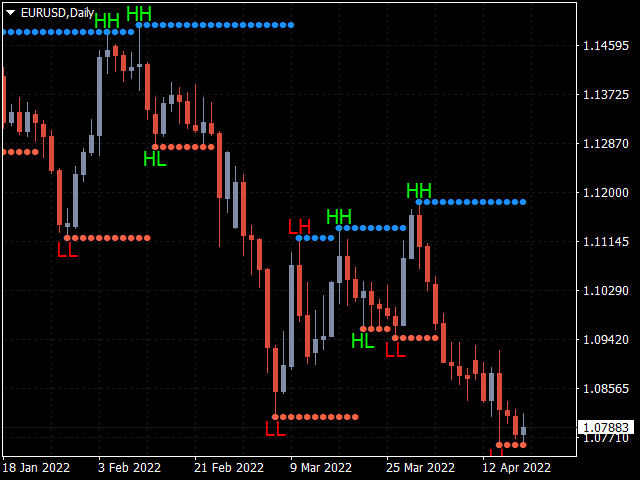
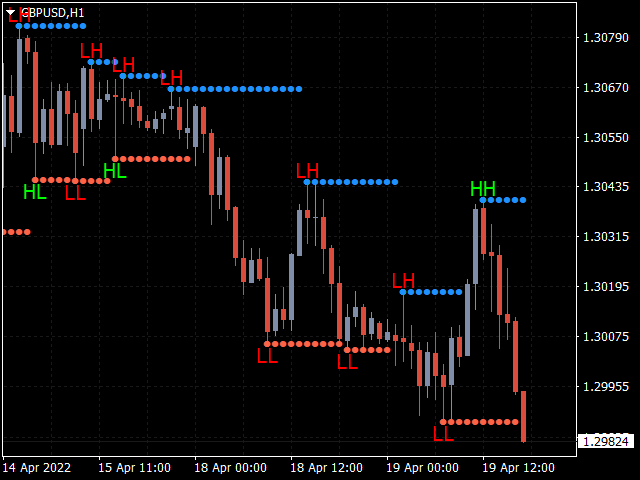
KT Higher High Lower Low marque les points de swing suivants avec leurs niveaux de support et de résistance respectifs :
- Higher High : Un sommet plus haut que le sommet précédent.
- Lower High : Un sommet plus bas que le sommet précédent.
- Lower Low : Un creux plus bas que le creux précédent.
- Higher Low : Un creux plus haut que le creux précédent.
Caractéristiques
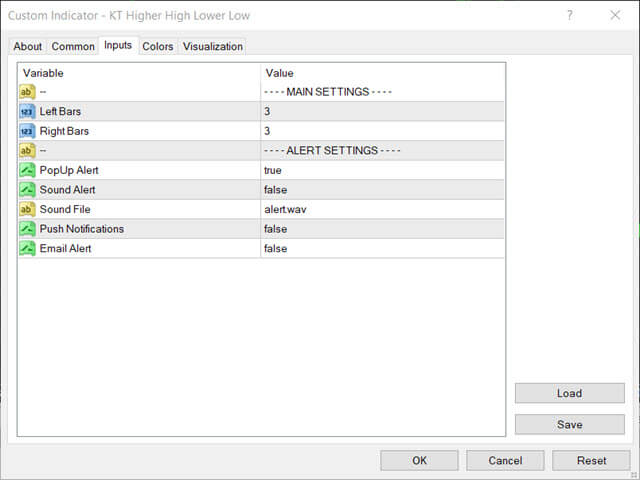
- L’intensité des sommets et des creux peut être ajustée en modifiant le nombre de barres à gauche et à droite.
- Alertes fournies lors de l’apparition de nouveaux HH, LH, LL et HL.
- Alertes fournies lorsque le prix touche un niveau de support ou de résistance.
L'utilisateur n'a laissé aucun commentaire sur la note