KT Fisher Transform MT4
- Indicateurs
- KEENBASE SOFTWARE SOLUTIONS
- Version: 1.0
- Activations: 5
KT Fisher Transform is an advanced version of the original Fisher Transform oscillator equipped with divergence detection, crossover alerts, and many more features. Originally it was developed by John F. Ehlers. It converts the asset's price into a Gaussian normal distribution to find the local extremes in a price wave.
Features
- A light-weighted oscillator that efficiently identifies the upward and downward crossovers and marks them using vertical lines.
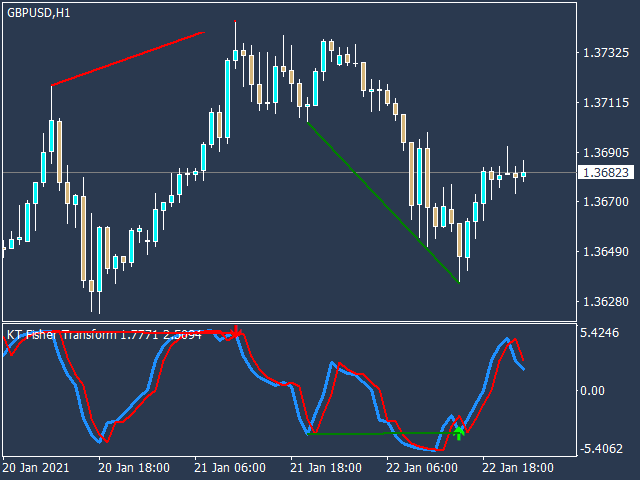
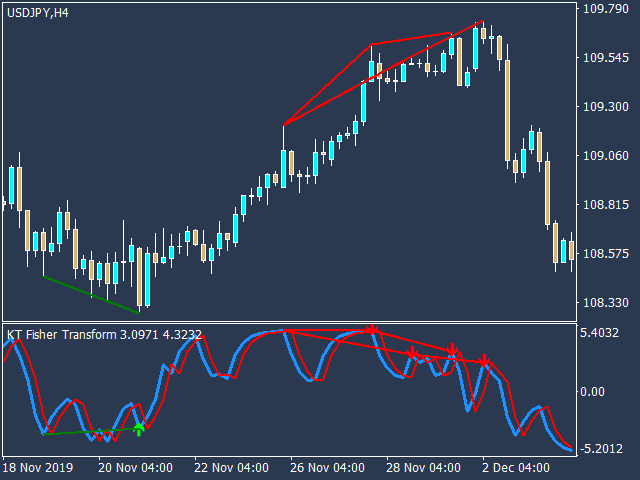
- It also finds regular and hidden divergences on the oscillator.
- It works efficiently to detect the sharp reversals in price.
- Traders can also use it for scalping on smaller timeframes.
- All Metatrader alerts included.
Long Trade
- Main-line cross above the 0.0 level after touching an extreme negative area.
- Upward crossover of main and signal line either in a positive or negative area.
- Bullish regular or hidden divergence.
Short Trade
- Main-line cross below the 0.0 level after touching an extreme positive area.
- Downward crossover of main and signal line either in a positive or negative area.
- Bearish regular or hidden divergence.
Pro Tip: It can be very noisy and provide multiple false signals before the actual reversal takes place. Instead of using it as a standalone indicator, it's best to combine it with other indicators for trade confirmation.
Formula
Fisher Transform = ½ * ln [(1 + X) / (1 – X)]
Where,
ln is the natural logarithm and X represents the transformation of asset's price to a level between -1 and 1 for ease of calculation.
Inputs
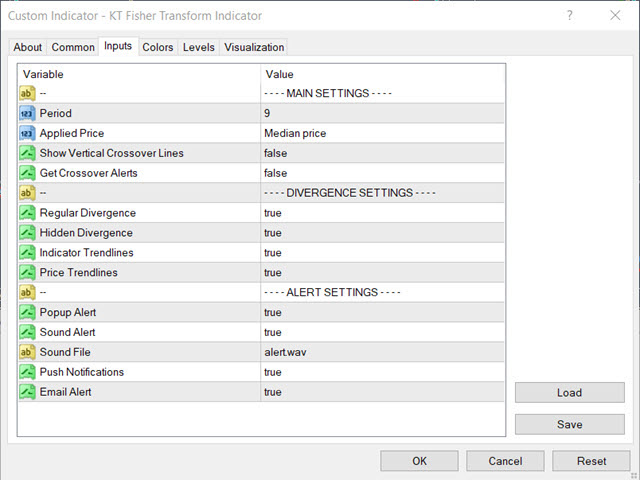
- Period: The integer value used to calculate the main and signal line.
- Show Vertical Lines: If true, the indicator will draw vertical lines on each upward or downward crossover. To avoid unnecessary clutter, we recommend keeping it off.
- Get Crossover Alerts: If true, the indicator will provide alerts on each crossover.
- Regular/Hidden Divergence: You can turn on/off the divergence detection.
- Indicator Trendlines: If true, the indicator will draw the oscillator's trendlines for each successive divergence.
- Price Trendlines: If true, the indicator will draw the trendlines on the price chart for each successive divergence.
