KT Coppock Curve MT5
- Indicateurs
- KEENBASE SOFTWARE SOLUTIONS
- Version: 1.0
- Activations: 5
KT Coppock Curve is a modified version of the original Coppock curve published in Barron's Magazine by Edwin Coppock in 1962. The Coppock curve is a price momentum indicator used to identify the market's more prominent up and down movements.
Features
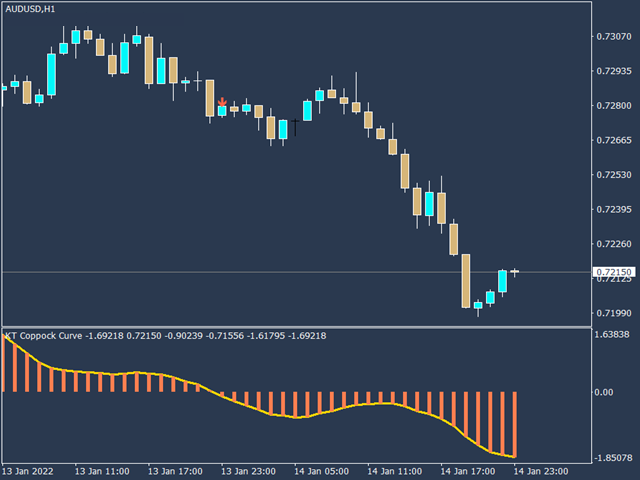
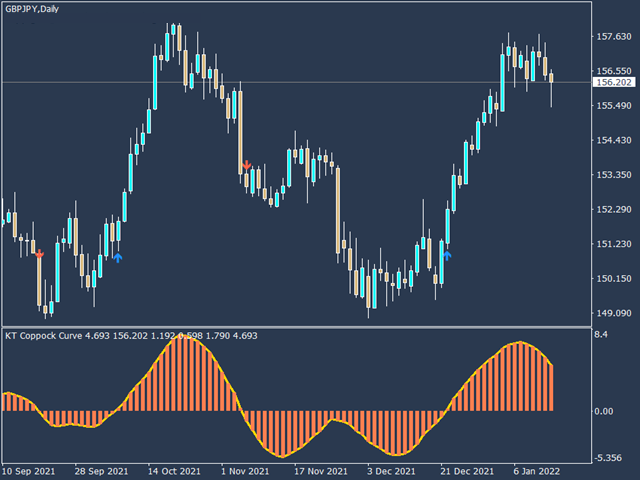
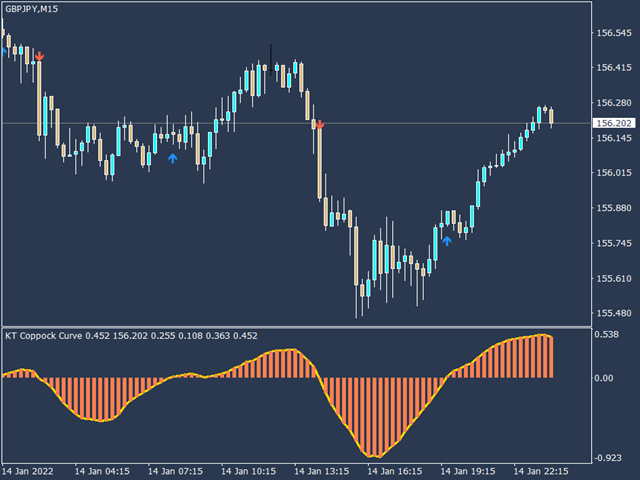
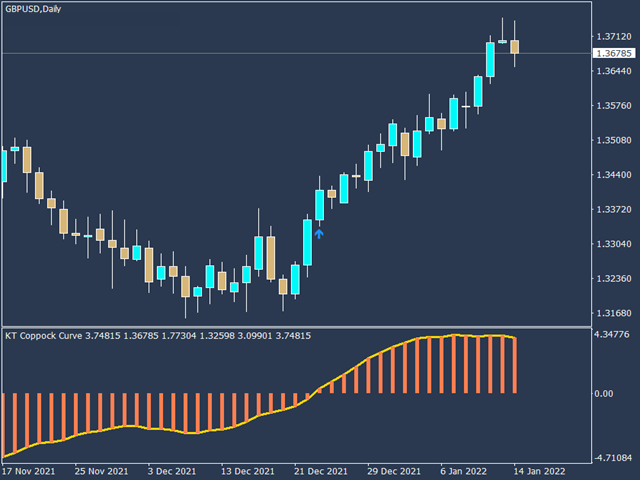
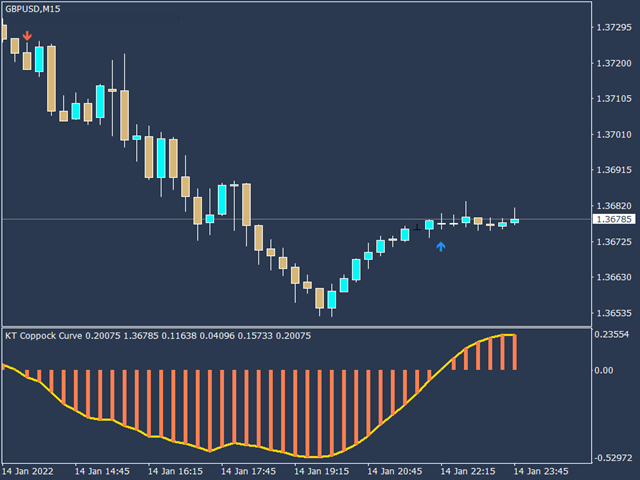
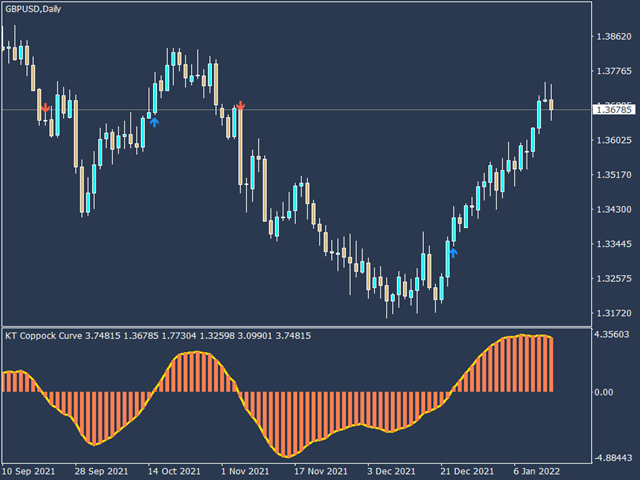
- It comes with up & down arrows signifying the zero line crossovers in both directions.
- It uses a simplified color scheme to represent the Coppock curve in a better way.
- It comes with all kinds of Metatrader alerts.
Applications
- It can provide buy/sell signals such as buying when the Coppock curve crosses above zero and selling below zero.
- One can also hold the stock for long-term stocks trading as long as the Coppock curve is above the zero line.
- One can also use it to filter out the low probability trades by going long only if the Coppock curve is above zero and going short only if it's below zero.
Coppock Formula
The Coppock curve is based on the following mathematical equation:
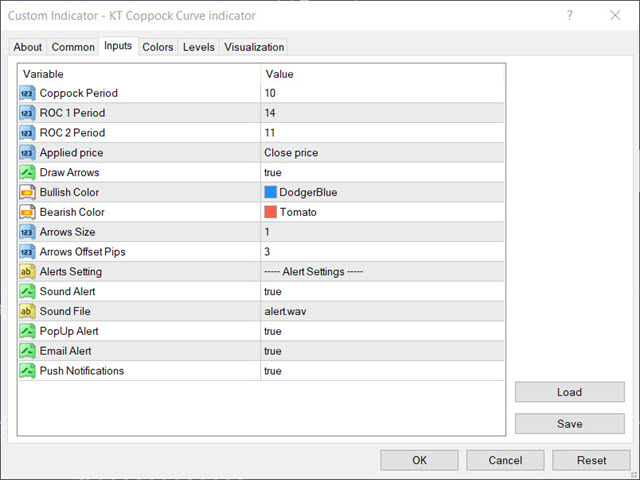
Coppock Curve = 10-period weighted moving average of (14-period ROC + 11-period ROC)

