• Aperçu
  • Avis
  • Commentaires

BalanceCurve

1. What is this

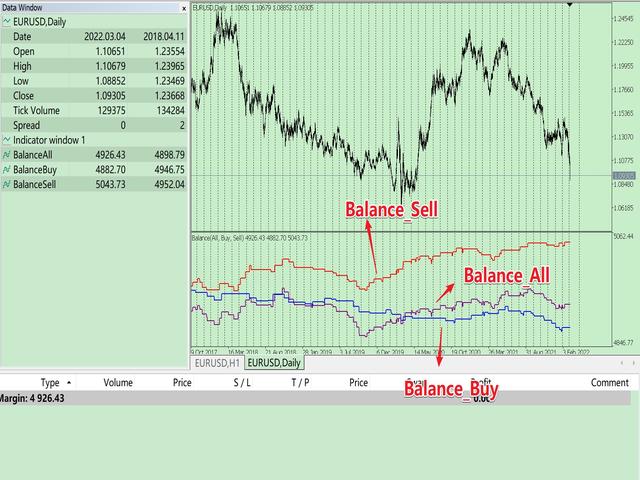
This is a tool used to display the balance curve in real time. The historical orders of the MT5 software are only tabular, and it looks troublesome when you have a lot of orders. This program can draw your historical trading orders in the form of a capital curve graph. This way you can see at a glance how well you are trading and where you are going wrong.

At the same time, although the MT5 strategy backtest has a capital curve, it does not match the price one by one. So it is very troublesome to use. This program makes the price curve match the capital curve one by one, which is very convenient to use.

2. Features

  • You can draw your historical trading orders in the form of a capital curve chart, which can draw different capital curves according to different time frames.
  • It can be used for strategy backtesting to show how your EA strategy is doing in real time.
  • It is divided into three funding curves. One is for only showing long position, one is for showing only short position, and one is for including all.
  • Programming in the form of indicators does not affect the overlay of other EAs or indicators.

3. Parameter description

  • InitDeposit = 5000; // Initial Deposit
  • Inp_StartTime = 0; // History start time, 0 - all time
  • Inp_ProfitNorm = false; // Is corrected position to 1.0 lots, default false.
  • Inp_Symbol = NULL; // Select Symbol, default is all symbols.

4. How to use

Just load it directly on the chart.

Here's how to use it in strategy backtesting, both of the following methods will work:

  • a. Load the following code into OnInit() of your EA, it will automatically load the indicator in the history test. First you have to copy the program to the Indicator directory.
    //---First you have to copy the program to the Indicator directory.
    iCustom(_Symbol, _Period, "BalanceCurve", 5000, 0, false);
  • b. Save the indicator to the template, and then load the template in the strategy backtest.



Produits recommandés
Avant d'installer l'indicateur HeatMap assurez vous d'utiliser un broker qui vous donne accès au Depth of market (DOM) !! Cet indicateur crée sur votre graphiques une heatmap vous permettant de voir les ordres limites d'achat ou de vente facilement et en temps réel. Vous avez la possibilité de changer de réglage et les couleurs de la HeatMap afin de s'adapter à  tous les marchés et à tous les graphiques. Voici un exemple de réglage que vous pouvez utiliser  avec le SPX500 sur le broker AMPGlob
Eternal Engine EA est un conseiller Expert avancé qui utilise plusieurs indicateurs et stratégies, fournissant aux traders un outil de trading automatisé complet. Il offre de nombreuses opportunités de trading, n’est pas sensible aux spreads, et emploie des points d’entrée stricts pour initier précisément chaque transaction. La stratégie a fait ses preuves sur le marché réel, avec un signal en temps réel d’une année de faible DD.Whether vous êtes un débutant ou un trader expérimenté, Eternal En
KT Renko Patterns MT5
KEENBASE SOFTWARE SOLUTIONS
KT Renko Patterns scans the Renko chart brick by brick to find some famous chart patterns that are frequently used by traders across the various financial markets. Compared to the time-based charts, patterns based trading is easier and more evident on Renko charts due to their uncluttered appearance. KT Renko Patterns features multiple Renko patterns, and many of these patterns are extensively explained in the book titled Profitable Trading with Renko Charts by Prashant Shah. A 100% automate
Cumulative delta indicator As most traders believe, the price moves under the pressure of market buying or selling. When someone redeems an offer standing in the cup, the deal is a "buy". If someone pours into the bid standing in the cup - the deal goes with the direction of "sale". The delta is the difference between purchases and sales. A cumulative delta - the difference between the cumulative sum of purchases and sales for a certain period of time. It allows you to see who is currently contr
ET9 for MT5
Hui Qiu
3 (4)
ET9 New on the Market, Launch promo! Only a few copies left at: $699 Next price: $799 Final price: $1599 The Best Expert Advisor  on   XAUUSD   any timeframes! ET9  for MT5 Updated v4.70 !!      Important update:  Merge Dragon Ball's H4 breakout strategy, Optimize parameters Include Free ET1 for MT5:  https://www.mql5.com/en/market/product/113131 Dragon Ball MT5 Updated v1.70 !!  https://www.mql5.com/en/market/product/116514 Descriptions ET9 for MT5 is a powerful automated trading progra
Orbit Rage Final 2
BILLY ARANDUQUE ABCEDE
Note : i only sell this EA on MQL5, any other sellers is fake. Orbit Rage Final, a cutting-edge trading strategy meticulously designed around the bull/bear candle approach and divergence analysis. This powerful tool is engineered to empower you to shape the life you desire. To embark on this transformative journey, simply download and seamlessly integrate it into your MetaTrader 4 platform by placing it in the experts advisors folder. Orbit Rage Final revolutionizes trading by offering a risk-f
| Fully-automated Smart Money Concept (ICT) inspired trading solution with multi-strategy capabilities | Built by a grid trader >> for grid traders.  This is MT5 version, click  here  for  Blue CARA MT4  (settings and logics are same in both versions)     Real monitoring signal  -->  Cara Gold Intro Blue CARA EA   ('CARA') - short for  C omprehensive  A lgorithmic   R esponsive   A dvisor is a next-gen  multi-currency    multi-timeframe  EA base on the widely known (and perhaps the most popul
Le niveau Premium est un indicateur unique avec une précision de plus de 80 % des prédictions correctes ! Cet indicateur a été testé par les meilleurs Trading Specialists depuis plus de deux mois ! L'indicateur de l'auteur que vous ne trouverez nulle part ailleurs ! À partir des captures d'écran, vous pouvez constater par vous-même la précision de cet outil ! 1 est idéal pour le trading d'options binaires avec un délai d'expiration de 1 bougie. 2 fonctionne sur toutes les paires de de
Trade Assistant GS mt5
Vasiliy Strukov
5 (13)
Le panneau de négociation est limité à la gestion des ordres - à la fois ouverts à l'aide de boutons et ouverts par l'utilisateur. Simple et pratique dans la Collection. Complétera tout acheteur. Je recommande de l'utiliser en tandem avec l'indicateur Gold Stuff. Configurez le trading en tant qu'ordres uniques et construisez une grille avec une distance. Pour créer une grille standard, définissez simplement une grande distance, telle que 10000. Les résultats en temps réel peuvent être consult
For a trader, trend is our friend. This is a trend indicator for MT5, can be used on any symbol. just load it to the terminal and you will see the current trend. green color means bullish trend and red means bearlish trend. you can also change the color by yourself when the indicator is loaded to the MT5 terminal the symbol and period is get from the terminal automaticly. How to use: I use this trend indicator on 2 terminals with different period  for the same symbol at same time. for example M5
Surf Board
Mohammadal Alizadehmadani
Benefits of the Surfboard indicator : Entry signals without repainting If a signal appears and is confirmed, it does NOT disappear anymore, unlike indicators with repainting, which lead to major financial losses because they can show a signal and then remove it. perfect opening of trades The indicator algorithms allow you to find the Peak and floor position to enter a deal (buy or sell an asset), which increases the success rate for each and every trader using it. Surfboard works with any asse
Gyroscope        professional forex expert   (for EURUSD, GBPUSD, USDJPY, AUDUSD, USDCHF, EURGBP, EURJPY, NZDUSD, USDCAD, EURCHF, AUDJPY, CADJPY pairs)   alyzing the market using the Elliot Wave Index. Elliott wave theory is the interpretation of processes in financial markets through a system of visual models (waves) on price charts. The author of the theory, Ralph Elliott, identified eight variants of alternating waves (of which five are in the trend and three are against the trend). The mo
Rainbow EA MT5
Jamal El Alama
Description : Rainbow EA MT5 is a simple Expert advisor based on   Rainbow MT5 indicator witch is based on Moving average with period 34. The indicator is incorporated in the EA, therefore, it is not required for the EA to operate, but if you wish, you can download it from   my product page . The Expert Advisor settings are as follows : Suitable for Timeframes up to H1 The parameters below can be set according to your trading rules. StopLoss ( Stop Loss in pips) TakeProfit ( Take Profit in pi
AUTOMATIC TRADE COPIER for local *   use . (copy trades between several metatrader terminals on the local computer/ *or GLOBALLY after setting your network /server !) Can copy trades from one or   several main MT5 accounts   to several MT5 and MT4 accounts   (no limit). For MT5 to MT4 copy you have to also get version for Metatrader 4 here : https://www.mql5.com/en/market/product/80842 - very fast execution (theoretically up to 5ms delay, depends on computer speed) - user can set speed of co
Atomic Analyst MT5
Issam Kassas
4.79 (19)
Tout d'abord, il convient de souligner que cet indicateur de trading n'est ni repainting, ni redrawing et ne présente aucun délai, ce qui le rend idéal à la fois pour le trading manuel et automatisé. Manuel de l'utilisateur : réglages, entrées et stratégie. L'Analyste Atomique est un indicateur d'action sur les prix PA qui utilise la force et le momentum du prix pour trouver un meilleur avantage sur le marché. Équipé de filtres avancés qui aident à éliminer les bruits et les faux signaux, et à
The Best RSI MT5
Szymon Palczynski
The relative strength index (RSI) is a popular momentum oscillator introduced in 1978. The RSI provides technical traders with signals about bullish and bearish price momentum, and it is often plotted beneath the graph of an asset's price. An asset is usually considered overbought when the RSI is above 70 and oversold when it is below 30. The Best RSI uses the input signal from the RSI indicator. Unlock the potential of the markets with The Best RSI, the fully automated and ready-to-use trading
Elevate your trading experience with Dynamic Trader EA MT5 , a cutting-edge trading robot designed to optimize your investment strategy. This advanced algorithm harnesses the power of four key indicators: RSI ( Relative Strength Index ), Stochastic Oscillator , MACD   ( Moving Average Convergence Divergence ) and ATR ( Average True Range ) to make informed and precise trading decisions. ATR is used to dynamically set stop-loss and take-profit levels based on market volatility. IMPORTANT! Read
Mine Farm
Maryna Kauzova
5 (1)
Mine Farm is one of the most classic and time-tested scalping strategies based on the breakdown of strong price levels. Mine Farm is the author's modification of the system for determining entry and exit points into the market... Mine Farm - is the combination of great potential with reliability and safety. Why Mine Farm?! - each order has a short dynamic Stop Loss - the advisor does not use any risky methods (averaging, martingale, grid, locking, etc.) - the advisor tries to get
Introduction Il s'agit d'une EA de retrait conçue pour détecter les divergences de tendance, ce qui correspond au premier type d'arguments d'achat et de vente de la théorie du « Zhan Zhong Shuo Chan ». Avec un facteur de profit exceptionnellement élevé, cette EA offre une rentabilité constante à long terme. Il utilise un trading en grille dynamique, lui permettant de s'adapter de manière transparente aux diverses conditions du marché. Nouveau prix promotionnel EA : 99 $ → 149 $ Signal en dire
The Expert Advisor is used to create Renko chart, realtime updates, easy for technical analysis. Backtest your strategy with all indicators with Renko chart in MetaTrader 5. Parameters Box Size : input the number of box size. Show Wicks : if true , draw a candle with high/low. History Start: input the date to creat first candle. Maximum Bars: limit number of bars on renko chart How to use Attach the Expert Advisor to a chart (timeframe M1), for which you want to create a renko. Input box siz
US500 Scalper
Sergey Batudayev
The S&P 500 Scalper Advisor is an innovative tool designed for traders who want to successfully trade the S&P 500 Index. The index is one of the most widely used and prestigious indicators of the American stock market, comprising the 500 largest companies in the United States. Peculiarities: Automated trading solutions:   The advisor is based on advanced algorithms and technical analysis to automatically adapt the strategy to changing market conditions. Versatile approach:   The advisor combine
How to use Pair Trading Station Pair Trading Station is recommended for H1 time frame and you can use it for any currency pairs. To generate buy and sell signal, follow few steps below to apply Pair Trading Station to your MetaTrader terminal. When you load Pair Trading Station on your chart, Pair Trading station will assess available historical data in your MetaTrader platforms for each currency pair. On your chart, the amount of historical data available will be displayed for each currency pai
Noize Absorption Index - is the manual trading system that measures the difference of pressure between bears forces and bulls forces. Green line - is a noize free index that showing curent situation. Zero value of index shows totally choppy/flat market.Values above zero level shows how powerfull bullish wave is and values below zero measures bearish forces.Up arrow appears on bearish market when it's ready to reverse, dn arrow appears on weak bullish market, as a result of reverse expectation.
Indicateur unique qui met en œuvre une approche professionnelle et quantitative pour signifier le trading de réversion. Il capitalise sur le fait que le prix dévie et revient à la moyenne de manière prévisible et mesurable, ce qui permet des règles d'entrée et de sortie claires qui surpassent largement les stratégies de trading non quantitatives. [ Installation Guide | Update Guide | Troubleshooting | FAQ | All Products ] Des signaux de trading clairs Étonnamment facile à échanger Couleurs et
Magic EA MT5
Kyra Nickaline Watson-gordon
Magic EA is an Expert Advisor based on Scalping, Elliot Waves and with filters such as RSI, Stochastic and 3 other strategies managed and decided with the robot smartly. Large number of inputs and settings are tested and optimized and embedded in the program thus inputs are limited and very simple. Using EA doesn't need any professional information or Forex Trading Knowledge. EA can trade on all symbols and all time frames, using special and unique strategies developed by the author. The EA
SolarTrade Suite Financial Robot: LaunchPad Market Expert - conçu pour ouvrir des transactions ! Il s'agit d'un robot de trading qui utilise des algorithmes spéciaux innovants et avancés pour calculer ses valeurs, votre assistant dans le monde des marchés financiers. Utilisez notre ensemble d'indicateurs de la série SolarTrade Suite pour mieux choisir le moment de lancer ce robot. Découvrez nos autres produits de la série SolarTrade Suite en bas de la description. Vous souhaitez naviguer
This indicator draws strong price levels (price consolidation levels). The levels are plotted using 2 MA indicators and 1 MACD using a complex algorithm. The algorithm used in the EA is also in personal use.  These levels have 4 variants (colors of the variants can be customized): strong up, weak up, strong down, weak down. In turn, a weak level usually appears and then it can become strong. A strong level can also become weak. Version MT4:  https://www.mql5.com/en/market/product/27997/ Versio
The Penta-O is a 6-point retracement harmonacci pattern which usually precedes big market movements. Penta-O patterns can expand and repaint quite a bit. To make things easier this indicator implements a twist: it waits for a donchian breakout in the right direction before signaling the trade. The end result is an otherwise repainting indicator with a very reliable trading signal. The donchian breakout period is entered as an input. [ Installation Guide | Update Guide | Troubleshooting | FAQ | A
Predictor PRO MT5
Evgenii Aksenov
5 (1)
A new generation progressive indicator from INFINITY. Predictor PRO uses its own entry and exit calculation strategy. Indicator without redrawing signals! This is very important for real trading. The indicator can be used for any currency pairs, metals, cryptocurrencies or indices. The best time of the H1 chart. Unlike other indicators, Predictor PRO shows shows the Buy/Sell entry point and the Close exit point. Calculating the profit of all signals in points on the panel helps to choose th
Utilitaire de gestion automatique des commandes et des risques. Permet de tirer le maximum des bénéfices et de limiter vos pertes. Créé par un commerçant pratiquant pour les commerçants. L'utilitaire est facile à utiliser, fonctionne avec tous les ordres de marché ouverts manuellement par un trader ou avec l'aide de conseillers. Peut filtrer les transactions par nombre magique. L'utilitaire peut fonctionner avec n'importe quel nombre de commandes en même temps. A les fonctions suivantes :
Les acheteurs de ce produit ont également acheté
Trade Assistant MT5
Evgeniy Kravchenko
4.39 (174)
It helps to calculate the risk per trade, the easy installation of a new order, order management with partial closing functions, trailing stop of 7 types and other useful functions. Attention, the application does not work in the strategy tester. Manual, Description, Download demo Line function -   shows on the chart the Opening line, Stop Loss, Take Profit. With this function it is easy to set a new order and see its additional characteristics before opening.   Risk management  - The risk
Do you think that in markets where the price can change in a split second, placing orders should be as simple as possible? In Metatrader, each time you want to open an order, you have to open a window where you enter the opening price, stop loss and take profit, as well as the trade size. In trading the financial markets, capital management is essential to maintain your initial deposit and multiply it. So, when you want to place an order, you probably wonder how big a trade you should open? Wha
TradePanel MT5
Alfiya Fazylova
4.86 (120)
Trade Panel est un assistant commercial multifonctionnel. L'application contient plus de 50 fonctions de trading manuel et vous permet d'automatiser la plupart des actions de trading. Avant d'acheter, vous pouvez tester la version Démo sur un compte démo. Démo ici . Instructions complètes ici . Commerce . Vous permet d'effectuer des opérations de trading de base en un clic : Ouvrir les ordres et positions en attente. Ouverture d'une grille d'ordres. Clôturez les ordres et les positions en attent
Local Trade Copier EA MT5
Juvenille Emperor Limited
4.99 (68)
Découvrez une expérience exceptionnellement rapide de copie de trades avec le   Local Trade Copier EA MT5 . Avec sa configuration facile en 1 minute, ce copieur de trades vous permet de copier des trades entre plusieurs terminaux MetaTrader sur le même ordinateur Windows ou Windows VPS avec des vitesses de copie ultra-rapides de moins de 0.5 seconde. Que vous soyez un trader débutant ou professionnel, le   Local Trade Copier EA MT5   offre une large gamme d'options pour le personnaliser en fonc
The product will copy all telegram signal to MT5 ( which you are member) , also it can work as remote copier.  Easy to set up, copy order instant, can work with almost signal formats, image signal,  s upport to translate other language to English Work with all type of channel or group, even channel have "Restrict Saving Content", work with  multi channel, multi MT5 Work as remote copier: with signal have ticket number, it will copy exactly via ticket number. Support to backtest signal. How to s
Trade Dashboard MT5
Fatemeh Ameri
5 (47)
Tired of complex order placement and manual calculations? Trade Dashboard is your solution. With its user-friendly interface, placing orders becomes effortless, by a single click, you can open trades, set stop loss and take profit levels, manage trade lot size, and calculate risk to reward ratios, allowing you to only focus on your strategy. Say goodbye to manual calculations and streamline your trading experience with Trade Dashboard. Download  Demo Version  right now. You can find  Details
MT5 to Telegram Signal Provider est un utilitaire facile à utiliser et entièrement personnalisable qui permet l'envoi de signaux spécifiés vers un chat, un canal ou un groupe Telegram, transformant ainsi votre compte en fournisseur de signaux. Contrairement à la plupart des produits concurrents, il n'utilise pas d'importations DLL. [ Démonstration ] [ Manuel ] [ Version MT4 ] [ Version Discord ] [ Canal Telegram ] Configuration Un guide utilisateur étape par étape est disponible. Aucune connai
Trade Manager DaneTrades
DaneTrades Ltd
4.76 (25)
Trade Manager pour vous aider à entrer et sortir rapidement des transactions tout en calculant automatiquement votre risque. Y compris des fonctionnalités pour vous aider à éviter le sur-trading, le trading de vengeance et le trading émotionnel. Les transactions peuvent être gérées automatiquement et les mesures de performances du compte peuvent être visualisées dans un graphique. Ces fonctionnalités rendent ce panneau idéal pour tous les traders manuels et contribuent à améliorer la plateforme
Exp COPYLOT CLIENT for MT5
Vladislav Andruschenko
4.04 (23)
Le copieur commercial pour MT5 est un copieur commercial pour la plate-forme МetaТrader 5   . Il copie les transactions de change   entre       tous les comptes   MT5   -   MT5, MT4   -   MT5 pour la version COPYLOT MT5 (ou MT4   -   MT4 MT5   -   MT4 pour la version COPYLOT MT4) Copieur fiable ! Version MT4 Description complète   +DEMO +PDF Comment acheter Comment installer     Comment obtenir des fichiers journaux     Comment tester et optimiser     Tous les produits de Expforex Vous po
-25% discount ($149 -> $111) Everything for chart Technical Analysis indicator mt5 in one tool Draw your supply demand zone with rectangle and support resistance with trendline and get alerts to mobile phone or email alert -  Risk reward indicator mt5 Video tutorials, manuals, DEMO download   here .   Find contacts on my   profile . 1.   Extended rectangles and trendlines Object will be extended to the right edge of the chart when price will draw new candles on chart. This is rectangle extend
Set price targets, and leave everything else to HINN Lazy Trader! This tool is designed for automatic position sizing from specified levels to designated targets. Using a VPS is recommended (*). The demo version   limited in functionality, be sure to watch this video before using -->  https://youtu.be/2NE8COr9-Bk  and this -->  https://youtu.be/Yv9gid3bMxE A community for users, product discussion, update news, and first line of support are organized in a free Discord: https://discord.gg/zFhEZc
Copiez les signaux de n'importe quel canal dont vous êtes membre (y compris les canaux privés et restreints) directement sur votre MT5.  Cet outil a été conçu en pensant à l'utilisateur et offre de nombreuses fonctionnalités nécessaires pour gérer et surveiller les trades. Ce produit est présenté dans une interface graphique conviviale et attrayante. Personnalisez vos paramètres et commencez à utiliser le produit en quelques minutes ! Guide de l'utilisateur + Démo  | Version MT4 | Version Dis
Panneau de trading pour trader en 1 clic.   Travailler avec des positions et des commandes!   Trading à partir du graphique ou du clavier. Avec notre panneau de trading, vous pouvez exécuter des transactions en un seul clic directement depuis le graphique et effectuer des opérations de trading 30 fois plus rapidement qu'avec le contrôle MetaTrader standard. Les calculs automatiques des paramètres et des fonctions rendent le trading plus rapide et plus pratique pour les traders. Des conseils grap
DrawDown Limiter
Haidar, Lionel Haj Ali
5 (18)
Expert Advisor "Drawdown Limiter"  Vous êtes au bon endroit si vous recherchez un contrôle de drawdown, un limiteur de drawdown, une protection du solde, une protection de l'équité ou une limite quotidienne de drawdown en rapport avec les entreprises de gestion de capitaux (Prop Firm), FTMO, My Forex Fund, ou si vous souhaitez protéger votre compte de trading. Avez-vous déjà eu du mal à contrôler votre drawdown en tradant sur des comptes financés ? Cet EA est fait pour vous. Les entreprises d
The product will copy all  Discord  signal   to MT5   ( which you are member  ) , also it can work as remote copier.  Easy to set up. Work with almost signal formats, support to translate other language to English Work with multi channel, multi MT5. Work with Image signal. Copy order instant, auto detect symbol. Work as remote copier: with signal have ticket number, it will copy exactly via ticket number. How to setup and guide: Let read all details about setup and download Discord To MetaTrade
Trade Assistant 38 in 1
Makarii Gubaydullin
4.88 (17)
Outil multifonctionnel : plus de 65 fonctions, dont : calcul de lot, price action, facteur R/R, gestionnaire des trades, zones d'offre et de demande Version de démonstration   |   Manuel de l'Utilisateur   |    MT4 L'utilitaire ne fonctionne pas dans le testeur de stratégie : vous pouvez télécharger la version de démonstration ICI pour tester le produit. Contactez-moi   pour toutes questions / idées d'amélioration / en cas de bug trouvé Simplifiez, accélérez et automatisez votre processus de tr
Take a Break MT5
Eric Emmrich
4.73 (15)
The most advanced news filter and drawdown limiter on MQL market NEW: Take a Break can be backtested against your account history! Check the " What's new " tab for details. Take a Break has evolved from a once simple news filter to a full-fledged account protection tool. It pauses any other EA during potentially unfavorable market conditions and will continue trading when the noise is over. Typical use cases: Stop trading during news/high volatility (+ close my trades before). Stop trading when
-25% discount ($199 -> $149) Advanced trading tool: One click smart orders that execute under your conditions Developed by trader for trading community:  position size calculator (lot size), open position after price action, strategy builder, set and forget trading, mobile notifications... Risk Management -  Risk percentage position size calculator, gain percentage, target risk reward ratio, spread and commissions are included in calculations 7 Advanced order types  - Set and forget trading w
Le gestionnaire UTM est un outil intuitif et facile à utiliser qui offre une exécution rapide et efficace des transactions. L'une des fonctionnalités les plus remarquables est le mode "Ignore Spread", qui vous permet de négocier au prix des bougies, en ignorant complètement les spreads (par exemple, permet de négocier des paires de spreads plus élevés sur LTF, évitez d'être retiré des transactions par spread). Un autre aspect clé du gestionnaire UTM est son copieur de commerce local unique, perm
The top-selling EAs on the market cost a lot and one day they are suddenly gone. This is because one strategy will not work in the forex market all the time. Our product is unique from all others in the MQL Marketplace because our EA comes with 34+ built-in indicators that allow develop strategies every time.  You build your strategy and keep updating it. If one strategy does not work, simply build another all using only one EA. This is All-In-One EA   in this market place. You can use as trade
Comprehensive on chart trade panel with the unique ability to be controllable from mobile as well. Plus has a library of downloadable configuration, e.g. exit rules, extra panel buttons, pending order setup and more. Please see our product video. Works with all symbols not just currency pairs. Features On chart panel plus controllable from free app for Windows, iPhone and Android Built-in script engine with library of downloadable configuration, e.g. add 'Close All Trades in Profit' button, exit
Cerberus Equity Watcher
Samuel Bandi Roccatello
5 (2)
Cerberus the Equity Watcher est un outil de gestion des risques qui surveille en permanence la valeur de votre compte et empêche les pertes importantes, qu'elles soient causées par des EA défectueux ou des émotions si vous êtes un trader discrétionnaire. Il est extrêmement utile pour les traders systématiques qui s'appuient sur des EA susceptibles de contenir des bogues ou de ne pas fonctionner correctement dans des conditions de marché inattendues. Cerberus vous permet de définir une valeur min
Mentfx Mmanage mt5
Anton Jere Calmes
4.25 (8)
The added video will showcase all functionality, effectiveness, and uses of the trade manager. Drag and Drop Trade Manager. Draw your entry and have the tool calculate the rest. Advanced targeting and close portions of a trade directly available in tool (manage trades while you sleep). Market order or limit order on either side with factored spread. Just draw the entry, the tool does the rest. Hotkey setup to make it simple. Draw where you want to enter, and the stop loss, the tool calculates al
YuClusters
Yury Kulikov
4.93 (43)
Attention: You can view the program operation in the free version  YuClusters DEMO .  YuClusters is a professional market analysis system. The trader has unique opportunities to analyze the flow of orders, trade volumes, price movements using various charts, profiles, indicators, and graphical objects. YuClusters operates on data based on Time&Sales or ticks information, depending on what is available in the quotes of a financial instrument. YuClusters allows you to build graphs by combining da

Envoyez des signaux entièrement personnalisables de MT5 à Telegram et devenez un fournisseur de signaux ! Ce produit est présenté dans une interface graphique conviviale et visuellement attrayante. Personnalisez vos paramètres et commencez à utiliser le produit en quelques minutes seulement ! Guide de l'utilisateur + Démo  | Version MT4  | Version Discord Si vous souhaitez essayer une démo, veuillez consulter le Guide de l'utilisateur. L'émetteur de MT5 vers Telegram NE fonctionne PAS dans le
OrderManager MT5
Lukas Roth
4.89 (18)
Présentation du   OrderManager   : Un utilitaire révolutionnaire pour MT5 Gérez vos transactions comme un pro avec le tout nouveau utilitaire Order Manager pour MetaTrader 5. Conçu avec simplicité et facilité d'utilisation à l'esprit, l'Order Manager vous permet de définir et de visualiser sans effort le risque associé à chaque transaction, vous permettant de prendre des décisions éclairées et d'optimiser votre stratégie de trading. Pour plus d'informations sur l'OrderManager, veuillez vous réfé
Ultimate Trailing Stop EA MT5
BLAKE STEVEN RODGER
4.57 (7)
This EA Utility allows you to manage (with advanced filtering) unlimited open orders (manual or EA) with 16 trailing stop methods: fixed, percent, ATR Exit, Chandelier Exit, Moving Average, Candle High Low Exit, Bollinger Bands, Parabolic, Envelope, Fractal, Ichimoku Kijun-Sen, Alligator, Exit After X Minutes or Bars, RSI and Stochastic. The trailing stop can be either real or virtual, and you can exit fully or with a partial close percent on touch or bar close.  Moreover, you can add (overri
RiskGuard Management
MONTORIO MICHELE
5 (13)
ATTENTION the expert does not work in strategy tester, for a trial version visit my profile. " Launch offer : until the end of August 2024, purchase our product for only 100 USD instead of 150 USD!" Manual RiskGuard Management   RiskGuard management was born with the idea of ​​helping traders from their initial journey to becoming expert and aware traders. Compatible with any operating system whether Mac or Windows. The operations panel is integrated into the graph giving the possibility to
Auto Trade Copier is designed to copy trades to multiple MT4, MT5 and cTrader accounts/terminals with 100% accuracy. The provider and receiver accounts must be on the same PC/VPS. With this tool, you can copy trades to receiver accounts on the same PC/VPS. All trading actions will be copied from provider to receiver perfectly. This version can be used on MT5 accounts only. For MT4 accounts, you must use Auto Trade Copier (for MT4). Reference: - For MT4 receiver, please download Trade Receiver Fr
Didi Alert Needle Detector
Alexandre Tadeu Molina
5 (4)
EA DIDI  Alert: lecteur d'aiguille du ATM SYSTEMS Êtes-vous à la recherche d’outils pour vous aider à profiter des meilleures opportunités de trading sur les marchés financiers ? Ensuite, DIDI Alert – Agulhadas Detector d'ATM Systems est le seul conseiller sur le marché qui exploite la puissante stratégie de trading Needles Setup de Didi Aguiar avec le DIDI INDEX, contrairement à d'autres conseillers dédiés à cette stratégie. Nous devons savoir que nous disposons d’une variété de ressources.
Plus de l'auteur
This product can be used to synchronize multiple Charts, and each Chart can be set to a different sync mode. With this product you can better view and manipulate charts: different time frames for a single Symbol, the same time frame for multiple Symbols, system indicators for single/multiple Symbols... and more. Feature: Chart settings can be synchronized, including : background, indentation, size, etc. Multiple Chart window start times  or end times can be synchronized. Multiple Chart time f
This product can be used to synchronize multiple Charts, and each Chart can be set to a different sync mode. With this product you can better view and manipulate charts: different time frames for a single Symbol, the same time frame for multiple Symbols... and more. PS: The link below is the FreeDemo product, you can use it on EURUSD/XUAUSD/USDCNH symbol: https://www.mql5.com/en/market/product/38557 Feature: Chart settings  can be synchronized, including : background, indentation, size, etc.
Do you think it's a bit cumbersome when you need to switch symbols or timeframes with mouse click? 1. What is this? This is a program that can switch symbols and timeframes with direction keys. Fast switching, very convenient, no mouse click required. For traders, one symbol with multi-timeframe charts are usually added,  you can change symbol on those charts easily. For multi-currency traders, different symbol charts are usually added, you can also change those timeframes easily. I wrote this p
1. What is this         Rising volatility and falling volatility are not the same, whether it is academic research or actual testing has shown this point.         The original ATR indicator is calculated by putting up and down fluctuations together. This indicator is to calculate separately the upward volatility and the downward volatility, which can better help you study the market. 2. Indicator description          There are two modes for the calculation of this indicator, as shown in the f
Have you ever take a long time to watch a Symbol when the network link is not good ? Have you ever wait for a long time when you switch chart between different Symbols or different TimeFrames ? If you do long-term backtesting , Have you ever to be downloaded datas for a long time ? Yes, If there is no data in the system, those will happen.  1. What is this: Download all the Symbol data in Market Watch to the system. PS: This is not outputting data to Files. This Link go to Demo version: https:
I see that many tools in the market deal with Position and Order in the form of operation panels. Which is loaded into a Chart in the form of an EA. However, once the operator panel EA is loaded, no other EAs can be loaded. So, I wrote the one-click operation of Position and Order as a script, so you can load other EAs and easily complete one-click operation of Trade. 1. What is this: This is a one-click script to close position order. Now you can close position tickets at high speed, for examp
I see that many tools in the market deal with Position and Order in the form of operation panels. Which is loaded into a Chart in the form of an EA. However, once the operator panel EA is loaded, no other EAs can be loaded. So, I wrote the one-click operation of Position and Order as a script, so you can load other EAs and easily complete one-click operation of Trade. 1. What is this: This is a one-click script to delete the pending order . Now you can delete pending tickets at high speed, for
Do you think it's a bit cumbersome when you need to switch symbols or timeframes with mouse click? 1. What is this? This is a program that can switch symbols and timeframes with direction keys. Fast switching, very convenient, no mouse click required. For traders, one symbol with multi-timeframe charts are usually added,  you can change symbol on those charts  easily . For multi-currency traders, different symbol charts are usually added, you can also change those timeframes easily. I wrote thi
According to trading experience: Some symbols are easy to reverse on certain days, such as Monday, or afternoon, and so on. So comparing the current price with the corresponding historical moment price is valuable. If the price coordinate system uses a logarithmic price, you will get a lot of valuable information. 1. What is this? This program can convert the symbol price and add it to your Chart. You can compare it with your major chart. The DEMO version Link: https://www.mql5.com/en/market/p
What is this: Violent trading: means sending a large number of orders to your brokerage server,  it can conduct a stress test of the trading. In this program you can run a variety of trading tests.  Now you can trade at high speed, For example 1000 orders in an instant. The Demo version's link:  https://www.mql5.com/en/market/product/38431/ Why to use: Whether manual trading or EA trading,  the status of the broker server is very important. So it is beneficial to conduct a trading stress test on
1. Why did I develop this series of indicators I found that most traders need to use multiple time frame indicators. They usually switch time frame to see indicators. However, once the timeframe is switched, you cannot see the  corresponding relationship  between  the price in the smaller timeframe  and  the indicator in the larger timeframe . For example: if your price chart is in H1 timeframe, you can see H4, D1 and W1 indicators in H1 timeframe Chart. This is more helpful for you to find t
Filtrer:
Aucun avis
Répondre à l'avis