• Aperçu
  • Avis (66)
  • Commentaires (250)
  • Nouveautés

The 1 2 3 Pattern Scanner

4.75

** All Symbols x All Timeframes scan just by pressing scanner button **

After 17 years of experience in the markets and programming, Winner indicator is ready. I would like to share with you!

*** Contact me to send you instruction and add you in "123 scanner group" for sharing or seeing experiences with other users.

Introduction

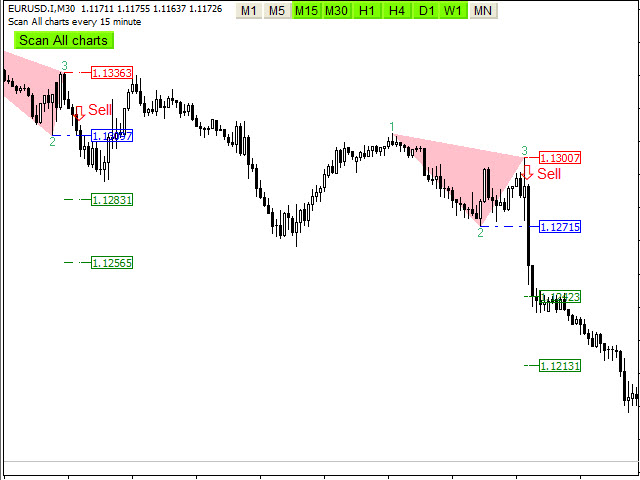
The 123 Pattern Scanner indicator with a special enhanced algorithm is a very repetitive common pattern finder with a high success rate. Interestingly, this Winner indicator indicates that the trend has changed its direction or the end of a trend retracement or even the 1 2 3 Pattern appears at the range market.

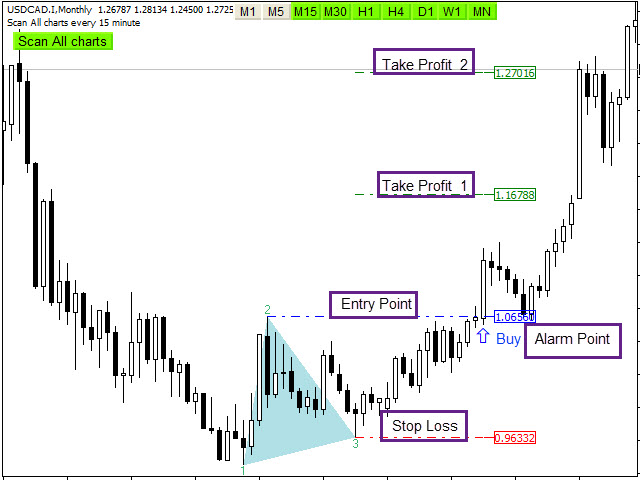
The 1,2,3 Pattern Scanner finds immediately with alarm and notification and also has stop loss, take profits and entry point with candlestick checking for easy trading.

Main Features

  • Use special enhanced algorithm
  • Detect the best and  most successful pattern with very repetitive in trend, swing and breakout.
  • Easy-to-use and user-friendly indicator
  • NO repaint
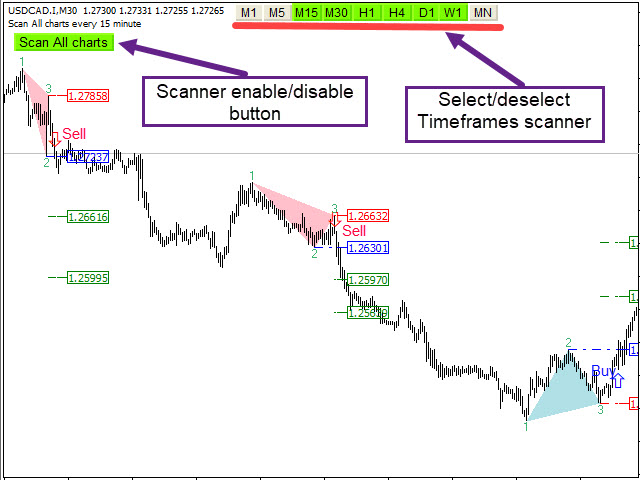
  • Scan all charts button ( Forex, Crypto, Indices and commodities)
  • Select and deselect time frames button for scan (M5,M15,M30,H1,H4,D1,W1,MN)
  • It displays and pushes notification stop-loss, entry-point and take-profit levels
  • Real Statistics Dashboard
  • Candlestick check for the best entry point
  • Method to choose how appearing pattern : breakout(after breakout the point 2) or pattern(in point 3)
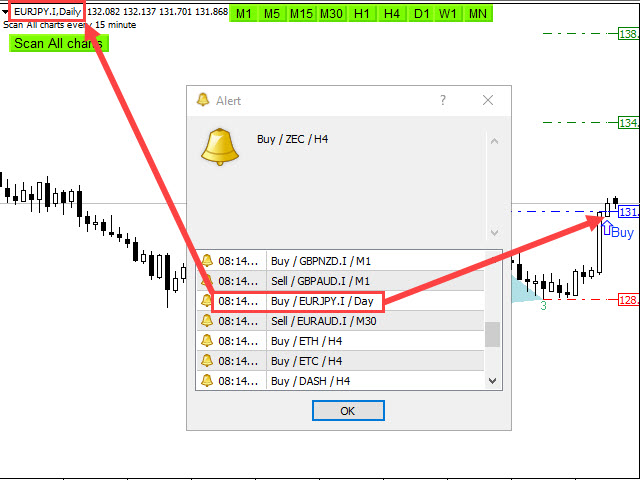
  • Sending the alert and push notification, email and files
  • Alert enable/disable base on your setting time
  • Adjust the pattern setting
  • Risk to Reward : 1:2
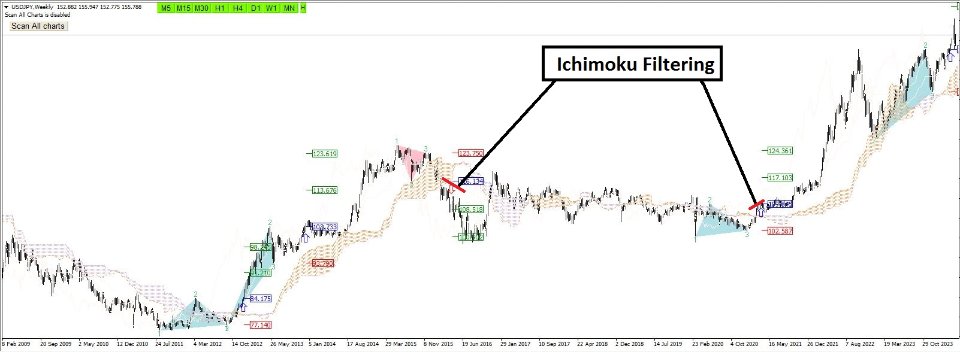
  • Ichimuku filtering

    Input Parameters

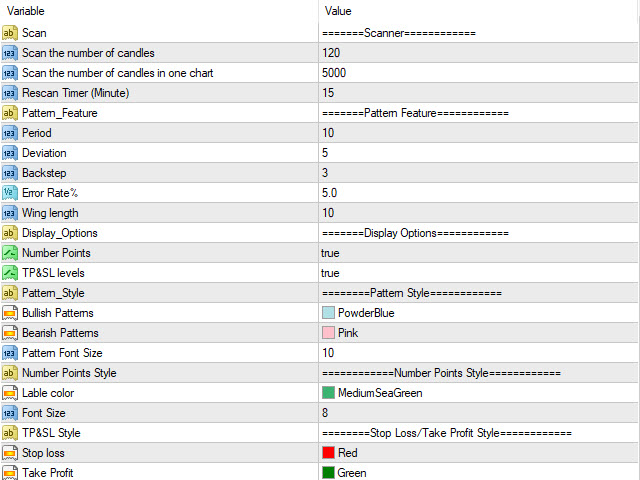
    =========Scanner============

    • Scan all charts - Enabled
    • Scan the number of candles – Amount of history bars to evaluate
    • Re-scan Timer – Re-scan all charts and all time frames after passing time
    • Method - choose how appearing a pattern : breakout(after breakout in point 2) or pattern(in point 3)

    =======Pattern Feature============

    • Pattern_Feature(Period, Deviation, Back step) - Algorithm Parameters for pattern recognition
    • Error_Rate – Maximum allowable error relative to pattern percentage
    • Wing length - Minimum distance between two legs in a pattern

    =======Display/style Options============

    • Display_Options – Display or do not display TP & SL levels
    • Stop Loss/Take Profit levels and Breakout Style - Set the Fonts and colors of patterns
    • Chart view - Color Scheme of chart (White / Black / Don't change)
    • Statistics Dashboard - Display or do not display Dashboard

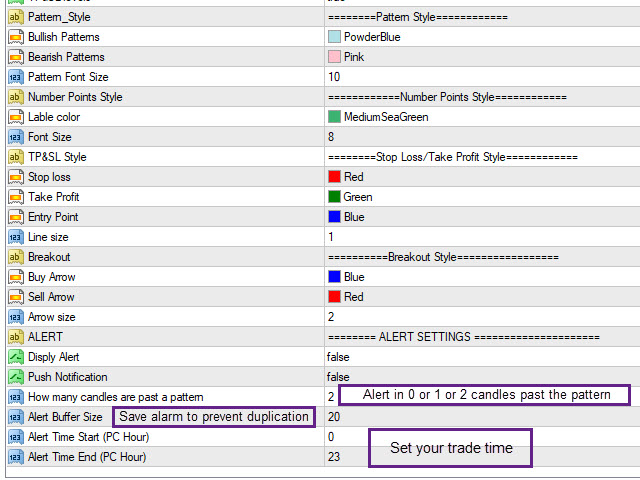
    ========ALERT SETTINGS ==========

    • Display Alert or Push Notification – Enable or disable Alert or Push Notification
    • How many candles are past a pattern – Maximum Number of candles Passed from a pattern to allow alert
    • Alert Buffer Size – Maximum save alert to prevent duplicate alerts
    • Alert start/end time  – Determine trading hours based on the computer clock to activate and deactivate the alarm
      Avis 20
      NaraChid
      61
      NaraChid 2024.09.25 17:07 
       

      Excellent tool and prompt support

      Khalid Karim
      390
      Khalid Karim 2024.09.12 07:36 
       

      great product. less but accurate signals. simple and smooth.

      aph.andy
      308
      aph.andy 2024.07.17 07:43 
       

      Very good indicator. If you follow the manual Reza give you, the indicator will be work like charm. Thank you for the support Reza. Really recommended.

      Produits recommandés
      Multi Timeframe ZigZag Indicator
      Salman A A A T Bakhash
      5 (2)
      Description: This indicator draw ZigZag Line in multiple time frame also search for Harmonic patterns before completion of the pattern. Features: Five instances of ZigZag indicators can be configured to any desired timeframe and inputs. Draw Harmonic pattern before pattern completion. Display Fibonacci retracement ratios. Configurable Fibonacci retracement ratios. Draw AB=CD based on Fibonacci retracement you define. You can define margin of error allowed in Harmonic or Fibonacci calculatio
      FREE
      Cet indicateur vous dessinera les niveaux suivants : Ligne ouverte quotidienne : le marché ci-dessous est baissier, le marché ci-dessus est haussier. Plage quotidienne moyenne haute et basse Marché asiatique haut et bas Hier, les hauts et les bas Ces niveaux sont des niveaux de support et de résistance forts auxquels tout le monde doit prêter attention. Si vous n'avez pas utilisé le temps pour commencer ! Vous devez faire attention lorsque le prix est proche de ces niveaux ! Profitez du t
      FREE
      FxSProMT
      Sergiy Podolyak
      5 (1)
      The FxSProMT indicator shows the current market trend and trend change. Indicator Parameters Ind_Period - the number of previous bars used to calculate actual values. Number_Bars - the number of bars to display the indicator.. Too many bars may significantly slow down the operation of the trading terminal. Signal_Sound - sound alert to notify of trend change. The sound can be played multiple times until the signal is confirmed (the bar closes). Default is disabled. Signal_Alert - an alert to n
      FREE
      Free automatic Fibonacci is an indicator that automatically plots a Fibonacci retracement based on the number of bars you select on the BarsToScan setting in the indicator. The Fibonacci is automatically updated in real time as new highest and lowest values appears amongst the selected bars. You can select which level values to be displayed in the indicator settings. You can also select the color of the levels thus enabling the trader to be able to attach the indicator several times with differe
      FREE
      CYCLE WAVE OSCILLATOR indicator is an indicator based on cyclical price fluctuations. This indicator can help you determine overbought and oversold levels, and help you predict price trends within the cycle. MT5 Version here!  You can combine it with our indicators below to make your trading decisions more accurate: Supply Demand Ribbon MT4 Basic Feature: - Three Trend Types: + Zero + Basic + Advanced
      FREE
      This indicator filters the Zigzag indicator to calculate the main support and resistance levels. Variables minimum gap between peaks : is the distance (GAP) between the peaks of the Zigzag peaks sensitivity : Minimum number of nearby peaks look back: it means that it has to test the last 50 peaks in the Zigzag object name perfix: a prefix for level’s line name on chart
      FREE
      Valable ZigZag
      Sergey Ermolov
      4.5 (6)
      Version MT5 | Indicateur Trend Monitor VZ  |  Indicateur Owl Smart Levels   |  Stratégie Owl Smart Levels  |   FAQ La théorie des vagues d'Elliott   est une interprétation des processus sur les marchés financiers qui s'appuie sur un modèle visuel des vagues sur les graphiques des prix.   L'indicateur valable ZigZag   affiche la structure des vagues du marché sur laquelle vous pouvez compter pour prendre des décisions commerciales. L'indicateur Valable ZigZag est plus stable et ne change pas sou
      FREE
      [Deviation of each indicator MT4] is a collection of 18 indicators, and one of them can be arbitrarily selected to participate in the calculation. It can calculate the deviation form of each indicator and can prompt an alarm. Parameter setting description: [indicators] is to choose one of the 18 indicators to participate in the calculation (this parameter is very important) . [period] is a common cycle for each indicator. [Method] is the MA mode of some indicators. [Apply_to] is the
      FREE
      OrderBlock TS Roman
      Vladislav Vlastovskii
      3.8 (5)
      Индикатор строит блоки заказов (БЗ) по торговой системе (ТС) Романа. Поиск блоков осуществляется одновременно на двух таймфремах: текущем и старшем (определяемым в настройках). Для оптимизации и игнорирования устаревших блоков в настройках задается ограничение количества дней в пределах которых осуществляется поиск блоков. Блоки строятся по правилам ТС состоящем из трех шагов: какую свечу вынесли (что?); какой свечой вынесли (чем?); правило отрисовки (как?).
      FREE
      TrendPlus
      Sivakumar Subbaiya
      4.15 (13)
      Trend Plus   Trendplus  Indicator   Time Frame: Suitable for any time frame.  Purpose: Trend Prediction. Blue and red candle indicate the buy and sell call respectively. Buy: When the blue candle is formed buy call is initiated. close the buy trades when the next red candle will formed.   Sell: When the Red candle is formed Sell call is initiated. close the Sell trades when the next blue candle will formed.   Happy trade!!
      FREE
      Introduction This indicator detects volume spread patterns for buy and sell opportunity. The patterns include demand and supply patterns. You might use each pattern for trading. However, these patterns are best used to detect the demand zone (=accumulation area) and supply zone (=distribution area). Demand pattern indicates generally potential buying opportunity. Supply pattern indicates generally potential selling opportunity. These are the underlying patterns rather than direct price action. T
      FREE
      RSX Signal 2 AM
      Andriy Matviyevs'kyy
      The indicator displays the signals of the RSX oscillator on the price chart. (To display these signals in a separate window, along with the oscillator, another indicator is used -  RSX Osc 4 AM ). It is optimal to use the indicator signals as signals to open a trade when the price overcomes the maximum or minimum of the bar at which the signal was given. An opposite signal cancels the previous signal. Settings: Data period for indicator calculation - data period for indicator calculation; Data
      FREE
      Necessary for traders: tools and indicators Waves automatically calculate indicators, channel trend trading Perfect trend-wave automatic calculation channel calculation , MT4 Perfect trend-wave automatic calculation channel calculation , MT5 Local Trading copying Easy And Fast Copy , MT4 Easy And Fast Copy , MT5 Local Trading copying For DEMO Easy And Fast Copy , MT4 DEMO Easy And Fast Copy , MT5 DEMO The homeopathic indicator is also called the CCI indicator. The CCI indicator was propos
      FREE
      Exclusive Channel on Zig Zag is a channel indicator for the MetaTrader 4 terminal. This indicator plots a channel based on the peaks of the standard ZigZag indicator. If you trade using the ZigZag indicator or channels, then Exclusive Channel on Zig Zag will suit you perfectly. Advantages of Exclusive Channel on Zig Zag The indicator is perfect for scalping and intraday trading. Suitable for beginners and experienced traders. Works on any financial instruments and markets. Works on all timefra
      Necessary for traders: tools and indicators Waves automatically calculate indicators, channel trend trading Perfect trend-wave automatic calculation channel calculation , MT4 Perfect trend-wave automatic calculation channel calculation , MT5 Local Trading copying Easy And Fast Copy , MT4 Easy And Fast Copy , MT5 Local Trading copying For DEMO Easy And Fast Copy , MT4 DEMO Easy And Fast Copy , MT5 DEMO Advanced Bollinger Bands: 1. The Bollinger rail will change color with the direction" 2. T
      FREE
      Discover the power of precision and efficiency in your trading with the " Super Auto Fibonacci " MT4 indicator. This cutting-edge tool is meticulously designed to enhance your technical analysis, providing you with invaluable insights to make informed trading decisions. Key Features: Automated Fibonacci Analysis: Say goodbye to the hassle of manual Fibonacci retracement and extension drawing. "Super Auto Fibonacci" instantly identifies and plots Fibonacci levels on your MT4 chart, saving you tim
      FREE
      Ratio market
      Aleksandr Krokhalev
      4.33 (15)
      Volatility under control. The indicator shows the optimal depth for setting goals within the day and on the average trend. It also builds pivot zones for the estimated correction depth. As an accompaniment, the key levels of the structure are displayed for several timeframes. Classical volatility indicators ATR & ADX on fixed timeframes are used for calculation. The calculation takes into account the spread, and if the market is slightly volatile, you will see a warning about the risk. You can c
      FREE
      RSI with Bands
      Amirhossein Ghasemi Moroodi
      Après 7 ans, j'ai décidé de mettre à disposition gratuitement certains de mes propres indicateurs et Expert Advisors (EAs). Si vous les trouvez utiles, merci de  soutenir avec une évaluation de 5 étoiles ! Vos retours me motivent à continuer à fournir des outils gratuits. Découvrez mes autres outils gratuits également ici . _________________________________ Indicateur "RSI avec Bandes" – Pour de meilleures décisions de trading L'indicateur "RSI avec Bandes" combine le RSI classiq
      FREE
      The Penta-O is a 6-point retracement harmonacci pattern which usually precedes big market movements. Penta-O patterns can expand and repaint quite a bit. To make things easier this indicator implements a twist: it waits for a donchian breakout in the right direction before signaling the trade. The end result is an otherwise repainting indicator with a very reliable trading signal. The donchian breakout period is entered as an input. [ Installation Guide | Update Guide | Troubleshooting | FAQ | A
      SMAconfirm
      Muhammad Robith
      This indicator helps you to comfirm SMAs' crossovers by draw a signal line that determines SMA movement direction. when Short SMA cross above Long SMA and Close price is above the signal several bars later, then uptrend is expected. when Short SMA cross below Long SMA and Close price is below the signal several bars later, then downtrend is expected. Input Description :  MA_Period_short: Short-term SMA's period. Used for short-term PriceX. Must be higher than 1.  MA_Period_long: Long-term SMA'
      FREE
      Fibonacci Ratio is useful to measure the target of a wave's move within an Elliott Wave structure. Different waves in an Elliott Wave structure relates to one another with Fibonacci Ratio. For example, in impulse wave: • Wave 2 is typically 50%, 61.8%, 76.4%, or 85.4% of wave 1. Fibonacci Waves could be used by traders to determine areas where they will wish to take profits in the next leg of an Up or Down trend.
      TIbors Timer
      Tibor Hartmut Sturm
      Indikator zur klaren Anzeige im Metatrader Dieser Indikator wurde von mir Entwickelt damit die Anzeige der relevanten Parameter klar und deutlich im Chart auf einen Blick zu sehen ist.  Er dient zur Information und ist ohne Gewähr.  Folgende Parameter werden angezeigt: -   Der  Aktuelle Kurs - Das Aktuelle Handelspaar - Die Restzeit zur nächsten Kerzenbildung / Zum Abschluss der Aktuellen Kerze - Die Kontonummer des Handelskontos - Die Frei Verfügbare Margin - Die Margin auf 1 Lot - Der Akt
      FREE
      UPD1 X00 Levels
      Vitaliy Kuznetsov
      5 (8)
      L'indicateur montre des niveaux ronds sur le graphique. Ils sont également appelés niveaux psychologiques, niveaux de banque ou niveaux des principaux acteurs. À ces niveaux, il y a une véritable lutte entre les haussiers et les baissiers, une accumulation de nombreux ordres, ce qui entraîne une volatilité accrue. L'indicateur s'adapte automatiquement à tout instrument et à toute période. Si le niveau 80 est cassé puis testé, il faut acheter. Si le niveau 20 est cassé puis testé, vendre. L'obje
      FREE
      Follow The Line
      Oliver Gideon Amofa Appiah
      4.07 (14)
      FOLLOW THE LINE GET THE FULL VERSION HERE: https://www.mql5.com/en/market/product/36024 This indicator obeys the popular maxim that: "THE TREND IS YOUR FRIEND" It paints a GREEN line for BUY and also paints a RED line for SELL.  It gives alarms and alerts of all kinds. IT DOES NOT REPAINT and can be used for all currency pairs and timeframes. Yes, as easy and simple as that. Even a newbie can use it to make great and reliable trades. NB: For best results, get my other premium indicators for more
      FREE
      Fx BFP Pivot Points
      Maged Ait Abbi
      5 (5)
      A forex   pivot point   strategy could very well be a trader’s best friend as far as identifying levels to develop a bias, place stops and identify potential profit targets for a trade. Pivot points have been a go-to for traders for decades. The basis of pivot points is such that price will often move relative to a previous limit, and unless an outside force causes the price to do so, price should stop near a prior extreme. Pivot point trading strategies vary which makes it a versatile tool for
      FREE
      Le Capteur de Tendance : La Stratégie du Capteur de Tendance avec Indicateur d'Alerte est un outil d'analyse technique polyvalent qui aide les traders à identifier les tendances du marché et les points d'entrée et de sortie potentiels. Elle présente une stratégie dynamique de Capteur de Tendance, s'adaptant aux conditions du marché pour une représentation visuelle claire de la direction de la tendance. Les traders peuvent personnaliser les paramètres selon leurs préférences et leur tolérance
      FREE
      Triple RSI
      Pablo Leonardo Spata
      1 (1)
      LOOK AT THE FOLLOWING STRATEGY WITH THIS INDICATOR. Triple RSI is a tool that uses the classic Relative Strength Indicator, but in several timeframes to find market reversals.    1.  ️ Idea behind the indicator and its strategy: In Trading, be it Forex or any other asset, the ideal is to keep it simple, the simpler the better . The triple RSI strategy is one of the simple strategies that seek market returns. In our experience, where there is more money to always be won, is in the marke
      FREE
      ScalperX
      Mustafa Sabir
      First of all, it is worth highlighting here that this Trading Indicator is Non Repainting, Non Redrawing and Non Lagging, which makes it ideal for manual trading. Never repaint and recalculate Once an arrow appears it never disappears, the signal comes at the opening of the new candle You will now be more profitable with this indicator You can do swing trading or scalping trading The indicator helps you identify the trend Can be optimized across all pairs and time frames Blue arrow is for buyin
      FREE
      Extremum by trend
      Anton Iudakov
      5 (2)
      Looking for entry points along the local trend without repaint! Arrows indicate entry points. Based on classic indicators. The indicator is easy to use. Settings Наименование Описание Frequency factor Signal frequency. The less, the more often. This affects the quality. Recommendations Recommended for use on major currency pairs. Timeframe from m5, m15, m30 Subscribe to my telegram channel, where we discuss intraday trading, ideas, indicators, etc., a link in my profile contacts.
      FREE
      Basic Harmonic Pattern
      Mehran Sepah Mansoor
      4.57 (51)
      Cet indicateur identifie les modèles harmoniques les plus populaires qui prédisent les points d'inversion du marché. Ces modèles harmoniques sont des formations de prix qui se répètent constamment sur le marché des changes et suggèrent des mouvements de prix futurs possibles / Version MT5 gratuite En outre, cet indicateur dispose d'un signal d'entrée sur le marché intégré, ainsi que de différents take profits et stop losses. Il convient de noter que, bien que l'indicateur de configuration har
      FREE
      Les acheteurs de ce produit ont également acheté
      Gann Made Easy
      Oleg Rodin
      4.83 (92)
      Gann Made Easy est un système de trading Forex professionnel et facile à utiliser qui est basé sur les meilleurs principes de trading en utilisant la théorie de mr. WD Gann. L'indicateur fournit des signaux d'ACHAT et de VENTE précis, y compris les niveaux Stop Loss et Take Profit. Vous pouvez échanger même en déplacement en utilisant les notifications PUSH. S'il vous plaît contactez-moi après l'achat! Je partagerai avec vous mes astuces de trading et d'excellents indicateurs bonus gratuitement!
      Bull versus Bear
      Mohamed Hassan
      4.8 (5)
      Official Release price of $65 for the first 48 /50   copies ( 2 copies left). Next price is $120 !  Send us a message after your purchase to receive more information on how to get your  BONUS  for FREE  that works in great combination with Bull vs Bear ! Bull versus Bear is an easy-to-use Forex indicator that gives traders clear and accurate signals based on clear trend retests . Forget about lagging indicators or staring at charts for hours because  Bull vs Bear provides real-time entries
      - Real price is 80$ - 40% Discount ( It is 49$ now ) Contact me for instruction, add group and any questions! Related Products:  Bitcoin Expert , Gold Expert Introduction The breakout and retest strategy is traded support and resistance levels. it involves price breaking through a previous level.  The break and retest strategy is designed to help traders do two main things, the first is to avoid false breakouts. Many false breakouts start with a candlestick that breaks out of a level but ends w
      FX Volume
      Daniel Stein
      4.58 (33)
      Obtenez votre mise à jour quotidienne du marché avec des détails et des captures d'écran via notre Morning Briefing ici sur mql5 et sur Telegram ! FX Volume est le PREMIER et SEUL indicateur de volume qui fournit un VRAI aperçu du sentiment du marché du point de vue d'un courtier. Il fournit des informations impressionnantes sur la façon dont les acteurs institutionnels du marché, comme les courtiers, sont positionnés sur le marché des changes, bien plus rapidement que les rapports COT. Voir c
      Atomic Analyst
      Issam Kassas
      5 (2)
      Tout d'abord, il convient de souligner que cet indicateur de trading n'est ni repainting, ni redrawing et ne présente aucun délai, ce qui le rend idéal à la fois pour le trading manuel et automatisé. Manuel de l'utilisateur : réglages, entrées et stratégie. L'Analyste Atomique est un indicateur d'action sur les prix PA qui utilise la force et le momentum du prix pour trouver un meilleur avantage sur le marché. Équipé de filtres avancés qui aident à éliminer les bruits et les faux signaux, et à
      Gold Stuff
      Vasiliy Strukov
      4.89 (241)
      Gold Stuff est un indicateur de tendance conçu spécifiquement pour l'or et peut également être utilisé sur n'importe quel instrument financier. L'indicateur ne se redessine pas et ne traîne pas. Délai recommandé H1. Au niveau de l'indicateur de travail, l'Expert Advisor EA Gold Stuff est entièrement automatique. Vous pouvez le trouver sur mon profil. Vous pouvez obtenir une copie gratuite de notre indicateur Strong Support et Trend Scanner, veuillez envoyer un message privé. moi! Contactez
      Scalper Inside PRO
      Alexey Minkov
      4.73 (56)
      An exclusive indicator that utilizes an innovative algorithm to swiftly and accurately determine the market trend. The indicator automatically calculates opening, closing, and profit levels, providing detailed trading statistics. With these features, you can choose the most appropriate trading instrument for the current market conditions. Additionally, you can easily integrate your own arrow indicators into Scalper Inside Pro to quickly evaluate their statistics and profitability. Scalper Inside
      FX Power MT4 NG
      Daniel Stein
      5 (13)
      Obtenez votre mise à jour quotidienne du marché avec des détails et des captures d'écran via notre Morning Briefing ici sur mql5 et sur Telegram ! FX Power MT4 NG est la nouvelle génération de notre très populaire indicateur de force des devises, FX Power. Et qu'est-ce que ce compteur de force de nouvelle génération offre ? Tout ce que vous avez aimé de l'original FX Power PLUS Analyse de la force de l'OR/XAU Des résultats de calcul encore plus précis Périodes d'analyse configurables individuel
      FX Levels est un indicateur de support et de résistance exceptionnellement précis qui fusionne la méthode traditionnelle Lighthouse avec une approche dynamique innovante, fonctionnant parfaitement sur tous les symboles de trading. Cela inclut les paires de devises, les indices, les actions ou les matières premières. FX Levels identifie les points d'inversion et les affiche sur le graphique, qui peuvent être idéalement utilisés comme cibles de profit dans vos activités de trading. Pour développe
      The Stochastic Basket Currency Strenght  brings the Stochastic indicator to a new level.  Expanding the boundaries of TimeFrames and mono-currency analysis, the SBCS take the movements of each currency that composes the cross and confront them in the whole basket of 7 crosses.  The indicator works with any combination of AUD, CAD, CHF, EUR, GBP, JPY, NZD, USD pairs and with full automation takes in account every stochastic value (main line) for the selected Time Frame.  After that, the indicator
      TPSproTREND PrO
      Roman Podpora
      4.79 (19)
      TPSpro TREND PRO   est un indicateur de tendance qui analyse automatiquement le marché et fournit des informations sur la tendance et chacun de ses changements, ainsi que des signaux pour entrer dans des transactions sans redessiner ! L'indicateur utilise chaque bougie et les analyse séparément. faisant référence à différentes impulsions - impulsion ascendante ou descendante. Points d'entrée précis dans les transactions sur les devises, les crypto-monnaies, les métaux, les actions, les indices 
      Stratos Pali
      Michela Russo
      5 (1)
      Stratos Pali Indicator   is a revolutionary tool designed to enhance your trading strategy by accurately identifying market trends. This sophisticated indicator uses a unique algorithm to generate a complete histogram, which records when the trend is Long or Short. When a trend reversal occurs, an arrow appears, indicating the new direction of the trend. Important Information Revealed Leave a review and contact me via mql5 message to receive My Top 5 set files for Stratos Pali at no cost! D
      Trend Screener
      STE S.S.COMPANY
      4.81 (88)
      Indicateur de tendance, solution unique révolutionnaire pour le trading et le filtrage des tendances avec toutes les fonctionnalités de tendance importantes intégrées dans un seul outil ! Il s'agit d'un indicateur multi-période et multi-devises 100 % non repeint qui peut être utilisé sur tous les symboles/instruments : forex, matières premières, crypto-monnaies, indices et actions. OFFRE À DURÉE LIMITÉE : L'indicateur Support and Resistance Screener est disponible pour seulement 50 $ et à vie. (
      Reversal-Arrow : Identification Précise et Fiable des Points de Renversement Reversal-Arrow est un indicateur avancé conçu pour aider les traders à identifier des points de renversement potentiels de tendance. Il fournit des signaux visuels clairs, simplifiant le processus de prise de décision et réduisant l’incertitude dans l'analyse du marché. Il est particulièrement optimisé pour les paires XAUUSD et XAUEUR en périodes de 1 minute, 5 minutes et 15 minutes, où il affiche sa meilleure performan
      TPSpro RFI Levels
      Roman Podpora
      4.82 (22)
      INSTRUCTIONS       RUS   -   ANGLAIS       Il   est recommandé de l'utiliser avec un indicateur       -       TPSpro   TENDANCE PRO -   Version MT4         Un élément clé du trading est constitué par les zones ou les niveaux à partir desquels les décisions d'achat ou de vente d'un instrument de trading sont prises. Malgré les tentatives des principaux acteurs de dissimuler leur présence sur le marché, ils laissent inévitablement des traces. Notre tâche était d'apprendre à identifier ces traces
      Dynamic Forex28 Navigator
      Bernhard Schweigert
      5 (2)
      Dynamic Forex28 Navigator - L'outil de trading Forex de nouvelle génération. ACTUELLEMENT 49 % DE RÉDUCTION. Dynamic Forex28 Navigator est l'évolution de nos indicateurs populaires de longue date, combinant la puissance de trois en un : Advanced Currency Strength28 Indicator (695 avis) + Advanced Currency IMPULSE avec ALERT (520 avis) + CS28 Combo Signals (Bonus). Détails sur l'indicateur https://www.mql5.com/en/blogs/post/758844 Qu'offre l'indicateur de force de nouvelle génération ? T
      Ce tableau de bord affiche les derniers modèles harmoniques disponibles pour les symboles sélectionnés, ce qui vous permettra de gagner du temps et d'être plus efficace / version MT5 . Indicateur gratuit: Basic Harmonic Pattern Colonnes de l'indicateur Symbol : les symboles sélectionnés apparaissent Trend : haussière ou baissière Pattern : type de motif (gartley, papillon, chauve-souris, crabe, requin, cypher ou ABCD) Entry: prix d'entrée SL: prix du stop loss TP1: 1er prix de prise de pr
      Scalper Vault
      Oleg Rodin
      5 (27)
      Scalper Vault est un système de scalpage professionnel qui vous fournit tout ce dont vous avez besoin pour un scalpage réussi. Cet indicateur est un système de trading complet qui peut être utilisé par les traders de forex et d'options binaires. Le délai recommandé est M5. Le système vous fournit des signaux fléchés précis dans le sens de la tendance. Il vous fournit également des signaux supérieurs et inférieurs et des niveaux de marché Gann. Les indicateurs fournissent tous les types d'alertes
      Gold Channel is a volatility-based indicator, developed with a specific timing algorithm for the XAUUSD pair, which consists of finding possible corrections in the market. This indicator shows two outer lines, an inner line (retracement line) and an arrow sign, where the theory of the channel is to help identify overbought and oversold conditions in the market. The market price will generally fall between the boundaries of the channel. If prices touch or move outside the channel it is a tra
      Actuellement 20% de réduction ! La meilleure solution pour tout débutant ou trader expert ! Ce logiciel de tableau de bord fonctionne sur 28 paires de devises. Il est basé sur 2 de nos principaux indicateurs (Advanced Currency Strength 28 et Advanced Currency Impulse). Il donne un excellent aperçu de l'ensemble du marché Forex. Il montre les valeurs de l'Advanced Currency Strength, la vitesse de mouvement des devises et les signaux pour 28 paires de devises dans tous les (9) délais. Imagine
      Currency Strength Wizard est un indicateur très puissant qui vous offre une solution tout-en-un pour un trading réussi. L'indicateur calcule la puissance de telle ou telle paire de devises en utilisant les données de toutes les devises sur plusieurs périodes. Ces données sont représentées sous la forme d'un indice de devise facile à utiliser et de lignes électriques de devise que vous pouvez utiliser pour voir la puissance de telle ou telle devise. Tout ce dont vous avez besoin est d'attacher l'
      Tout d'abord, il convient de souligner que cet outil de trading est un indicateur non repeint, non redessiné et non retardé, ce qui le rend idéal pour le trading professionnel. Cours en ligne, manuel utilisateur et démonstration. L'indicateur Smart Price Action Concepts est un outil très puissant à la fois pour les nouveaux et les traders expérimentés. Il regroupe plus de 20 indicateurs utiles en un seul, combinant des idées de trading avancées telles que l'analyse du trader Inner Circle et les
      ACTUELLEMENT 26% DE RÉDUCTION La meilleure solution pour tout débutant ou trader expert ! Cet indicateur est un outil de trading unique, de haute qualité et abordable car nous avons incorporé un certain nombre de caractéristiques exclusives et une nouvelle formule. Avec seulement UN graphique, vous pouvez lire la force de la devise pour 28 paires Forex ! Imaginez comment votre trading va s'améliorer parce que vous êtes capable de repérer le point de déclenchement exact d'une nouvelle tendan
      Ultimate Gold Advisor pour MetaTrader 4 L'Ultimate Gold Advisor est un outil technologique avancé conçu pour optimiser l'expérience de trading sur MetaTrader 4. Créé pour répondre aux besoins des traders expérimentés, cet indicateur combine précision, analyse sophistiquée et fonctionnalité polyvalente, offrant un soutien pour des décisions de trading éclairées. Idéal pour le trading de l'or, mais applicable à une large gamme d'actifs, l'Ultimate Gold Advisor peut vous aider à améliorer vos stra
      Gann Swing Structure
      Kirill Borovskii
      5 (1)
      This indicator is based on the mathematics of the great trader W.D. Ganna. With its help, you can easily find strong levels by analyzing swings to find the optimal entry point. The indicator works on all instruments and all timeframes. The indicator is fully manual and has control buttons. All you need to do is press the NEW button, a segment will appear, which you can place on any movement, swing or even 1 candle that you want to analyze. By placing the segment, press the OK button. A grid (th
      Nous vous présentons ON Trade Waves Patterns Harmonic Elliot Wolfe, un indicateur avancé conçu pour détecter divers types de schémas sur le marché à l'aide de méthodes manuelles et automatiques. Voici comment il fonctionne : Schémas Harmoniques : Cet indicateur peut identifier les schémas harmoniques qui apparaissent sur votre graphique. Ces schémas sont essentiels pour les traders qui pratiquent la théorie du trading harmonique, telle qu'elle est décrite dans le livre de Scott Carney "Harmonic
      Market Structure Patterns MT4
      Samuel Manoel De Souza
      5 (16)
      Market Structure Patterns   is an indicator based on   smart money concepts   that displays   SMC/ICT   elements that can take your trading decisions to the next level. Take advantage of the   alerts ,   push notifications   and   email messages   to keep informed from when an element is formed on the chart, the price crosses a level and/or enters in a box/zone. Developers can access the values of the elements of the indicator using the   global variables  what allows the automation of trading
      IX Power MT4
      Daniel Stein
      4.67 (6)
      IX Power apporte enfin la précision imbattable de FX Power aux symboles non-Forex. Il détermine avec précision l'intensité des tendances à court, moyen et long terme de vos indices, actions, matières premières, ETF et même crypto-monnaies préférés. Vous pouvez analyser tout ce que votre terminal a à offrir. Essayez-le et découvrez comment votre timing s'améliore considérablement lors de vos transactions. Caractéristiques principales d'IX Power Résultats de calcul précis à 100 %, sans ré
      Advanced Supply Demand
      Bernhard Schweigert
      4.91 (295)
      CURRENTLY 26% OFF !! Best Solution for any Newbie or Expert Trader! This indicator is a unique, high quality and affordable trading tool because we have incorporated a number of proprietary features and a new formula. With this update, you will be able to show double timeframe zones. You will not only be able to show a higher TF but to show both, the chart TF, PLUS the higher TF: SHOWING NESTED ZONES. All Supply Demand traders will love it. :) Important Information Revealed Maximize the potenti
      Supply and Demand Dashboard PRO
      Bernhard Schweigert
      4.8 (20)
      Actuellement 20% de réduction ! Ce tableau de bord est un logiciel très puissant qui fonctionne sur plusieurs symboles et jusqu'à 9 horizons temporels. Il est basé sur notre indicateur principal (Best reviews : Advanced Supply Demand ).   Le tableau de bord donne une excellente vue d'ensemble. Il montre :  Les valeurs d'offre et de demande filtrées, y compris l'évaluation de la force de la zone, Les distances en pips vers/et dans les zones, Il met en évidence les zones imbriquées, Il donne
      Plus de l'auteur
      AI Swing MT4
      Reza Aghajanpour
      5 (1)
      Introduction : AI Swing EA is a fully automated trader with Fixed SL and high win rate. The price is $1000, But now it is just $249, Limited time offer is active. Real Live Signal 1:  https://www.mql5.com/en/signals/2264899 Real Live Signal 2: https://www.mql5.com/en/signals/2256860 No Martingale, No Grid Contact me  to send you instruction and add you in group. Passed Prop Firm challenges The next generation G P T AI model quickly gained significant attention with its broad range of capabili
      ** All Symbols x All Timeframes scan just by pressing scanner button ** *** Contact me  to send you instruction and add you in "123 scanner group" for sharing or seeing experiences with other users. After 17 years of experience in the markets and programming, Winner indicator is ready. I would like to share with you! Introduction The 123 Pattern Scanner indicator with a special enhanced algorithm is a very repetitive common pattern finder with a high success rate . Interestingly, this Winner in
      **   All Symbols   x   All Timeframes   scan just by pressing scanner button ** *** Contact me  to send you instruction and add you in "Trend Reversal group" for sharing or seeing experiences with other users. Introduction: Trendlines are the most famous technical analysis in trading . Trendlines continually form on the charts of markets across all the different timeframes providing huge opportunities for traders to jump in and profit on the action. In the other hand,  The trendline reversal str
      Market Structure
      Reza Aghajanpour
      4.85 (26)
      ** All Symbols x All Timeframes scan just by pressing scanner button ** *** Contact me  to send you instruction and add you in "Market Structure group" for sharing or seeing experiences with other users. Introduction: Market structure is important for both new and professional traders since it can influence the liquidity and price action of a market (Breakout and Retest). It’s also one of the most commonly used techniques to understand trends, identify potential reversal points, and get a feel f
      Swing Scanner
      Reza Aghajanpour
      4.6 (20)
      ** All Symbols x All Time frames scan just by pressing scanner button ** *** Contact me  to send you instruction and add you in "Swing scanner group" for sharing or seeing experiences with other users. Swing EA:  https://www.mql5.com/en/market/product/124747 Introduction: Swing Scanner is the indicator designed to detect swings in the direction of the trend and possible reversal swings. The indicator studies several price and time vectors to track the aggregate trend direction and detects situa
      M W Scanner MT5
      Reza Aghajanpour
      5 (6)
      **   All Symbols   x   All Timeframes   scan just by pressing scanner button ** *** Contact me  to send you instruction and add you in "M W Scanner group" for sharing or seeing experiences with other users. Introduction: Double Top(M) and Double Bottom(W) is a very repetitive common type of price reversal patterns. Double Top resembles M pattern and indicates bearish reversal whereas Double Bottom resembles W pattern and indicates a bullish reversal that they have  high win  rate. The M W Scanne
      QM Pattern Scanner MT5
      Reza Aghajanpour
      5 (3)
      Contact me  to send you instruction and add you in group. QM (Quasimodo) Pattern is based on Read The Market(RTM) concepts. The purpose of this model is to face the big players of the market (financial institutions and banks), As you know in financial markets, big traders try to fool small traders, but RTM prevent traders from getting trapped. This style is formed in terms of price candles and presented according to market supply and demand areas and no price oscillator is used in it. RTM con
      All Divergence Scanner MT4
      Reza Aghajanpour
      4.93 (15)
      ** All Symbols x All Timeframes scan just by pressing scanner button ** *** Contact me  to send you instruction and add you in "All Divergences scanner group" for sharing or seeing experiences with other users. Introduction Divergence is a main technique used to determine trend reversing when it’s time to sell or buy because prices are likely to drop or pick in the charts. All Divergence indicator can help you locate the top and bottom of the market. This indicator finds Regular divergences for
      ** All Symbols x All Timeframes scan just by pressing scanner button ** *** Contact me  to send you instruction and add you in "ABCD scanner group" for sharing or seeing experiences with other users. Introduction This indicator scans AB=CD retracement patterns in all charts. The ABCD is the basic foundation for all harmonic patterns and highly repetitive with a high success rate . The ABCD Scanner indicator is a scanner reversal ABCD pattern that helps you identify when the price is about to cha
      Wolfe Wave Scanner MT5
      Reza Aghajanpour
      5 (6)
      **  All Symbols  x  All Timeframes  scan just by pressing scanner button ** *** Contact me  to send you instruction and add you in "Wolfe Wave Scanner group" for sharing or seeing experiences with other users. Introduction: A Wolfe Wave is created with five-wave patterns in price. It shows supply and demand and a fight towards a balance price. T hese waves of price actions can help traders identify the boundaries of   the trend . Also  It helps forecast how the price will move in the near futu
      QM Pattern Scanner MT4
      Reza Aghajanpour
      4.8 (5)
      Contact me  to send you instruction and add you in group. QM (Quasimodo) Pattern is based on Read The Market(RTM) concepts. The purpose of this model is to face the big players of the market (financial institutions and banks), As you know in financial markets, big traders try to fool small traders, but RTM prevent traders from getting trapped. This style is formed in terms of price candles and presented according to market supply and demand areas and no price oscillator is used in it. RTM con
      AI Next Level
      Reza Aghajanpour
      5 (1)
      The next generation G P T AI model quickly gained significant attention with its broad range of capabilities and versatility, We used its expertise in assisting prediction prices in formulating and applying improved trading strategies. Our AI core is capable of extracting data insights from financial news, Sentiment Analysis , specific formula, Oscillators and indicators status and other unstructured data sources. This information can then be used in conjunction with other datasets to make our
      Trend Reversal MT4
      Reza Aghajanpour
      5 (6)
      **   All Symbols   x   All Timeframes   scan just by pressing scanner button ** *** Contact me  to send you instruction and add you in "Trend Reversal group" for sharing or seeing experiences with other users. Introduction: Trendlines are the most famous technical analysis in trading . Trend lines continually form on the charts of markets across all the different timeframes providing huge opportunities for traders to jump in and profit on the action. In the other hand,  The trend line reversal s
      ABCD Pattern Scanner
      Reza Aghajanpour
      5 (19)
      ** All Symbols x All Timeframes scan just by pressing scanner button ** *** Contact me  to send you instruction and add you in "ABCD scanner group" for sharing or seeing experiences with other users. Introduction This indicator scans AB=CD retracement patterns in all charts. The ABCD is the basic foundation for all harmonic patterns and highly repetitive with a high success rate . The ABCD Scanner indicator is a scanner reversal ABCD pattern that helps you identify when the price is about to ch
      Harmonic Pattern Scanner
      Reza Aghajanpour
      4.67 (15)
      ** All Symbols x All Time frames scan just by pressing scanner button ** *** Contact me  to send you instruction and add you in "Harmonic Scanner group" for sharing or seeing experiences with other users. Introduction Harmonic Patterns are best used to predict turning point. Harmonic Patterns give you high win rate and high opportunities for trade in during one day. This indicator detects the best and successful patterns base on Harmonic Trading books . The Harmonic Patterns Scanner Scans All ch
      ** All Symbols x All Time frames scan just by pressing scanner button ** *** Contact me  to send you instruction and add you in "Divergence group" for sharing or seeing experiences with other users. Introduction MACD divergence is a main technique used to determine trend reversing when it’s time to sell or buy because prices are likely to drop or pick in the charts. The MACD Divergence indicator can help you locate the top and bottom of the market. This indicator finds Regular divergence for pul
      Market Structure MT5
      Reza Aghajanpour
      5 (3)
      **   All Symbols   x   All Timeframes   scan just by pressing scanner button ** *** Contact me  to send you instruction and add you in "Market Structure group" for sharing or seeing experiences with other users. Introduction: Market structure is important for both new and professional traders since it can influence the liquidity and price action of a market. It’s also one of the most commonly used techniques to understand trends, identify potential reversal points, and get a feel for current mar
      M W Scanner
      Reza Aghajanpour
      5 (8)
      **   All Symbols   x   All Timeframes   scan just by pressing scanner button ** *** Contact me  to send you instruction and add you in "M W Scanner group" for sharing or seeing experiences with other users. Introduction: Double Top(M) and Double Bottom(W) is a very repetitive common type of price reversal patterns. Double Top resembles M pattern and indicates bearish reversal whereas Double Bottom resembles W pattern and indicates a bullish reversal that they have  high win  rate. The M W Scanne
      Wolfe Wave Scanner MT4
      Reza Aghajanpour
      4.56 (9)
      **  All Symbols  x  All Timeframes  scan just by pressing scanner button ** *** Contact me  to send you instruction and add you in "Wolfe Wave Scanner group" for sharing or seeing experiences with other users. Introduction: A Wolfe Wave is created with five-wave patterns in price. It shows supply and demand and a fight towards a balance price. T hese waves of price actions can help traders identify the boundaries of   the trend . Also  It helps forecast how the price will move in the near future
      Swing Scanner MT5
      Reza Aghajanpour
      5 (6)
      **   All Symbols   x   All Time frames   scan just by pressing scanner button ** *** Contact me  to send you instruction and add you in "Swing scanner group" for sharing or seeing experiences with other users. Swing EA:  https://www.mql5.com/en/market/product/124747 Introduction: Swing Scanner   is the indicator designed to detect swings in the direction of the trend and possible reversal swings. The indicator studies several price and time vectors to track the aggregate trend direction and dete
      Head and Shoulder MT4
      Reza Aghajanpour
      5 (4)
      **   All Symbols   x   All Timeframes   scan just by pressing scanner button ** *** Contact me  to send you instruction and add you in "Head & Shoulders Scanner group" for sharing or seeing experiences with other users. Introduction: Head and Shoulders   Pattern  is a very repetitive common type of price reversal patterns. The pattern appears on all time frames and can be used by all types of traders and investors.   The  Head and Shoulders  Scanner indicator  Scans All charts just by pressing o
      RSI Divergence Scanner
      Reza Aghajanpour
      4.46 (13)
      ** All Symbols x All Timeframes scan just by pressing scanner button ** *** Contact me  to send you instruction and add you in "RSI scanner group" for sharing or seeing experiences with other users. Introduction RSI divergence is a main technique used to determine trend reversing when it’s time to sell or buy because prices are likely to drop or pick in the charts. The RSI Divergence indicator can help you locate the top and bottom of the market. This indicator finds Regular divergence for pu
      ** All Symbols x All Time frames scan just by pressing scanner button ** *** Contact me  to send you instruction and add you in "Harmonic Scanner group" for sharing or seeing experiences with other users. Introduction Harmonic Patterns are best used to predict turning point. Harmonic Patterns give you high win rate and high opportunities for trade in during one day. This indicator detects the best and successful patterns based on Harmonic Trading concepts . The   Harmonic Patterns   Scanner   Sc
      Market Heartbeat
      Reza Aghajanpour
      5 (7)
      Market Heartbeat in your hand! Introduction The Market Heartbeat indicator with a special enhanced algorithm (volume, money flow, cycle of market and a secret value) is a very repetitive trend finder with a high success rate . Interestingly, this Winner indicator indicates that the trend has changed its direction or the end of a trend retracement or even appears at the range market. The Market Heartbeat can use in scalping trading or trend trading. It finds immediately with alarm, notification a
      Market Heartbeat is in your hand! Introduction The Market Heartbeat indicator with a   special enhanced algorithm   (volume, money flow, cycle of market and a secret value) is a very repetitive trend finder with a high success rate .   Interestingly, this   Winner indicator   indicates that the trend has changed its direction or the end of a trend retracement or even appears at the range market. The Market Heartbeat can use in scalping trading or trend trading. It finds immediately with alarm, n
      RSI Divergences Scanner MT5
      Reza Aghajanpour
      4.73 (11)
      ** All Symbols x All Timeframes scan just by pressing scanner button ** ***Contact me to send you instruction and add you in "RSI scanner group" for sharing or seeing experiences with other users. Introduction RSI divergence is a main technique used to determine trend reversing when it’s time to sell or buy because prices are likely to drop or pick in the charts. The RSI Divergence indicator can help you locate the top and bottom of the market. This indicator finds Regular divergence for pullba
      Introduction RSI divergence is a main technique used to determine trend reversing when it’s time to sell or buy because prices are likely to drop or pick in the charts. The RSI Divergence indicator can help you locate the top and bottom of the market. This indicator finds Regular divergence for pullback the market and also finds hidden RSI Divergence to show continuing trend. This indicator shows divergence on the RSI that is a strong hint for an excellent entry point and finds immediately with
      FREE
      Channel Scanner MT5
      Reza Aghajanpour
      5 (1)
      **   All Symbols   x   All Timeframes   scan just by pressing scanner button ** *** Contact me  to send you instruction and add you in "Channel Scanner group" for sharing or seeing experiences with other users. Introduction: The Channel pattern is described as the area located between two trend lines. This area is used for a measure of a trading range. In this case, the upper trend line connects price highs while the lower trend line connects price lows. Also when it comes to breakout points, it
      MACD Divergence Scanner
      Reza Aghajanpour
      5 (2)
      ** All Symbols x All Time frames scan just by pressing scanner button ** *** Contact me  to send you instruction and add you in "Divergence group" for sharing or seeing experiences with other users. Introduction MACD divergence is a main technique used to determine trend reversing when it’s time to sell or buy because prices are likely to drop or pick in the charts. The MACD Divergence indicator can help you locate the top and bottom of the market. This indicator finds Regular divergence for pul
      **   All Symbols   x   All Timeframes   scan just by pressing scanner button ** *** Contact me  to send you instruction and add you in "Head & Shoulders Scanner group" for sharing or seeing experiences with other users. Introduction: Head and Shoulders   Pattern  is a very repetitive common type of price reversal patterns.   The pattern appears on all time frames and can be used by all types of traders and investors.   The  Head and Shoulders  Scanner indicator  Scans All charts just by pressing
      Filtrer:
      NaraChid
      61
      NaraChid 2024.09.25 17:07 
       

      Excellent tool and prompt support

      Khalid Karim
      390
      Khalid Karim 2024.09.12 07:36 
       

      great product. less but accurate signals. simple and smooth.

      aph.andy
      308
      aph.andy 2024.07.17 07:43 
       

      Very good indicator. If you follow the manual Reza give you, the indicator will be work like charm. Thank you for the support Reza. Really recommended.

      Sjackson
      97
      Sjackson 2024.06.13 00:52 
       

      If you have a strategy that works well with indicator, then this is the only indicator you will need. Exceptional customer service! If the indicator is not operating as expected, he will fix bug and push update without question.

      zjd_77
      32
      zjd_77 2024.05.13 18:02 
       

      L'utilisateur n'a laissé aucun commentaire sur la note

      sami57
      119
      sami57 2024.05.13 14:11 
       

      all indicators work very well

      Giulio Franceschini
      542
      Giulio Franceschini 2024.03.09 09:53 
       

      Hi Reza I'm using 123 Pattern scanners for 1 day in real, out of 14 trades done only 2 at stop loss and two still in progress, it's a fantastic indicator you did an extraordinary job, thank you. It would be even nicer if you could set the scanner for WIN RATIO, thus having the possibility that the scanner sends signals only for example for crosses with a win ratio greater than 70 or 75 - 80 or a selectable percentage of your choice. I don't know if this is feasible but it would become a SUPER indicator!!

      asahi0808
      175
      asahi0808 2024.01.07 22:11 
       

      L'utilisateur n'a laissé aucun commentaire sur la note

      guiguibrl
      42
      guiguibrl 2023.12.16 07:26 
       

      91% win rate in M30 eur/usd and 88% jp225 M5 very accurate win rate (25win for 4 loss)

      Reza Aghajanpour
      86776
      Réponse du développeur Reza Aghajanpour 2023.12.16 08:07
      Thank you for your awesome feedback.🌹⛱️🏖️🥇
      Enjoy your trading.⭐⭐⭐⭐⭐
      Oleg Pozdnyakov
      736
      Oleg Pozdnyakov 2023.10.28 11:16 
       

      Отличная работа и поддержка автора!!!

      Reza Aghajanpour
      86776
      Réponse du développeur Reza Aghajanpour 2023.10.28 14:57
      Thank you for your awesome feedback.🌹⛱️🏖️🥇
      Enjoy your trading.⭐⭐⭐⭐⭐
      Tony Gregg
      761
      Tony Gregg 2023.10.14 17:13 
       

      Probably the best 123 Indicator on MT4 right now.

      Reza Aghajanpour
      86776
      Réponse du développeur Reza Aghajanpour 2023.10.14 17:25
      Thank you for your awesome feedback. It is my pride.😍🌹🌹🙏
      Enjoy your trading. ⭐⭐⭐⭐⭐
      MissyD1202
      283
      MissyD1202 2023.09.22 11:54 
       

      Very good indicator and scanner, makes seeing the price structure much easier. Highly recommended.

      Reza Aghajanpour
      86776
      Réponse du développeur Reza Aghajanpour 2023.09.22 16:19
      Thank you for your warm feedback. It is my pride.😍🌹🌹🙏
      Enjoy your trading. ⭐⭐⭐⭐⭐
      Ck.
      1041
      Ck. 2023.09.01 16:14 
       

      Great work and support by author.

      Reza Aghajanpour
      86776
      Réponse du développeur Reza Aghajanpour 2023.09.01 16:16
      Thank you for your awesome feedback. It is my pride.😍🌹🌹🙏
      Enjoy your trading. ⭐⭐⭐⭐⭐
      quitdayjob247
      144
      quitdayjob247 2023.07.01 20:55 
       

      not worth $39 more like $1, i tested default settings on two charts to verify it's consistency. Some how i set it up wrong message from author. One chart shows all patterns with 15 minutes intervals working fine , 2nd chart on same demo server different account / MT4 with same settings doesn't show all patterns. If i'm wrong by dragging and dropping in chart and using default settings i accept my $39 loss.

      *1.33* Version going to test it this coming Week 08/06 on my live account.

      *1.38* IS a Winner, combined with MA + Fib levels for confirmation.

      Ich Khiem Nguyen
      227
      Ich Khiem Nguyen 2023.05.28 18:43 
       

      Works very well. Method Pattern mode should be used for trend trading with a high R:R ratio. However, to increase the win rate, I think the Breakout method is reasonable. The indicator saves a lot of time

      Reza Aghajanpour
      86776
      Réponse du développeur Reza Aghajanpour 2023.05.28 20:57
      Thank you for your awesome feedback. It is my pride.😍🌹🌹🙏
      Enjoy your trading. ⭐⭐⭐⭐⭐
      Alireza Saeedi
      234
      Alireza Saeedi 2023.05.18 18:34 
       

      L'utilisateur n'a laissé aucun commentaire sur la note

      Reza Aghajanpour
      86776
      Réponse du développeur Reza Aghajanpour 2023.05.18 21:40
      Thank you for your awesome feedback. It is my pride.😍🌹🌹🙏
      Enjoy your trading. ⭐⭐⭐⭐⭐
      Devonish
      3043
      Devonish 2023.04.08 16:36 
       

      I like it. I also agree with JACK_LE_CHAT's comments.

      Reza Aghajanpour
      86776
      Réponse du développeur Reza Aghajanpour 2023.04.08 17:29
      Thank you for your positive feedback. It is my pride.😍🌹🌹🙏
      Enjoy your trading. ⭐⭐⭐⭐⭐
      Chiedozie
      140
      Chiedozie 2023.04.02 18:29 
       

      L'utilisateur n'a laissé aucun commentaire sur la note

      Reza Aghajanpour
      86776
      Réponse du développeur Reza Aghajanpour 2023.04.02 19:07
      Thank you for your awesome feedback. It is my pride.😍🌹🌹🙏
      Enjoy your trading. ⭐⭐⭐⭐⭐
      Dmitrii Castravet
      464
      Dmitrii Castravet 2023.03.20 17:39 
       

      It says no repaint. But clear it does repaint.

      JACK_LE_CHAT
      360
      JACK_LE_CHAT 2023.03.17 01:20 
       

      I added this indicator to my trading tool kit a couple of weeks ago. Further to extensive testing with various instruments under various market conditions, I can assess that it provides very accurate signals based on the exact calculation of 123-patterns on any time frame. I shall however add a warning to the present review. Even though this indicator may make trading look pretty much easy at first glance, beginners must be very careful since its apparent simplicity is not a free ticket to ride: one should always have the signals confirmed by means of sound peripheral analysis of the market context, and only jump into trades when the 123-patterns displayed are thoroughly examined within the framework of a sturdy strategy taking confluences into account. If such a methodology is carefully implemented, this indicator is a highway to profits! On top of this, its author, M. Reza, is very supportive and always ready to help and advise. Bravo, and keep up with the great work ! MF

      Reza Aghajanpour
      86776
      Réponse du développeur Reza Aghajanpour 2023.03.17 06:22
      Thank you for your awesome feedback. It is my pride.😍🌹🌹🙏
      Enjoy your trading. ⭐⭐⭐⭐⭐
      Répondre à l'avis
      Version 1.39 2024.08.20
      - Fixed Object name issue
      Version 1.38 2024.06.05
      - Fixed sending email notification
      Version 1.37 2024.06.03
      - Alert Display in input setting
      Version 1.36 2024.04.22
      - Added symbol for scan in input setting

      - Solved issue in Strategy Tester & buffer

      - Improved print messages
      Version 1.35 2024.03.06
      - Added Font size for dashboard
      Version 1.34 2023.08.18
      - Added "Ichimoku Filtering" in input setting. (it is disabled by default )
      Version 1.33 2023.08.05
      - Improved Strategy Tester
      Version 1.32 2023.02.05
      - Added new option : Select Time Frames for scan in input setting
      Version 1.31 2023.02.01
      - Added email notification
      Version 1.30 2023.01.06
      - Fixed M1 timeframe button bug
      Version 1.29 2022.09.15
      - Edit Push signals to file
      Version 1.28 2022.09.15
      - Edit push signals to file
      Version 1.27 2022.09.15
      - Push signals to file
      Version 1.26 2022.09.13
      - Improved Printing
      Version 1.25 2022.09.02
      - Improved Printing - Part2
      Version 1.24 2022.09.02
      - Improved Printing
      Version 1.23 2022.09.01
      - Fixed dashboard bug
      Version 1.22 2022.09.01
      - Added Statistics Dashboard
      Version 1.21 2022.07.18
      - Solved a bug
      Version 1.20 2022.06.26
      - Remove just 123 indicator objects in changing TF and Keep other objects from other indicators.
      Version 1.19 2022.05.31
      - Fixed a bug
      Version 1.18 2022.05.29
      - Fixed a bug
      Version 1.17 2022.05.14
      - Fixed a buffer bug
      Version 1.16 2022.04.24
      - Add "H" button for hiding all buttons
      Version 1.15 2022.04.20
      - Add SL & TP & Entry point levels in alert message
      Version 1.14 2022.04.14
      - Improved buffers and Added signal buffer(Buy=1 / Sell=0) for creating EA
      - Fixed a bug
      Version 1.13 2022.04.04
      - Fixed a bug,
      Please download new version
      Version 1.12 2022.04.04
      - Imroved scan
      Version 1.11 2022.03.29
      - Fixed a small bug
      Version 1.10 2022.03.28
      - Updated chart view option(white,Black,Don't change)
      Version 1.9 2022.03.28
      - changed "chart view" option in input part
      Version 1.8 2022.03.24
      - Add "H" button : Hidden all buttons on chart
      Version 1.7 2022.03.21
      - Add "Chart View black" in input section: change color chart to black(Default MT4)
      - changed "scan the number of candles in open chart" to 500
      Version 1.6 2022.03.09
      - Add pattern name in alarm and notification based on users ask
      Version 1.5 2022.03.08
      - Add method to choose when appearing and alarm : breakout(after breakout in point 2) or pattern(in point 3)
      Version 1.4 2022.02.28
      - Scan just open chart when disable "scan all charts" button
      - Add buffer for someone who wants to use this indicator as an iCustom()
      Version 1.3 2022.02.22
      - Scan only your Market watch,
      Please download new version.
      Version 1.2 2022.02.08
      Improved Print
      Version 1.1 2022.02.08
      - Add "Market watch" or "just currency pairs" button for scan