The VIZUALIZER
- Utilitaires
- Antonin Skaryd
- Version: 1.10
- Mise à jour: 31 mars 2020
- Activations: 5
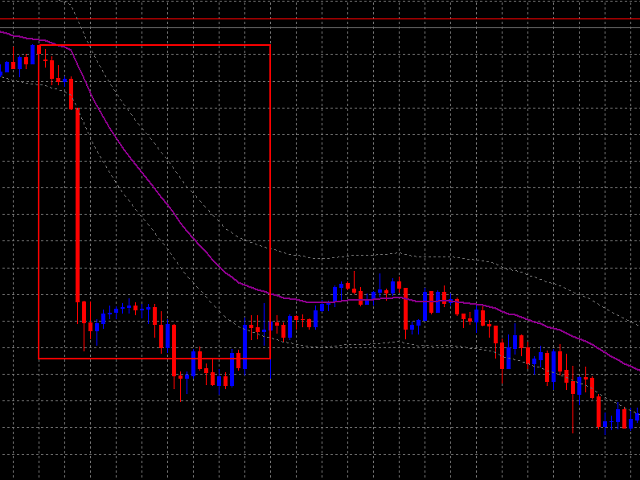
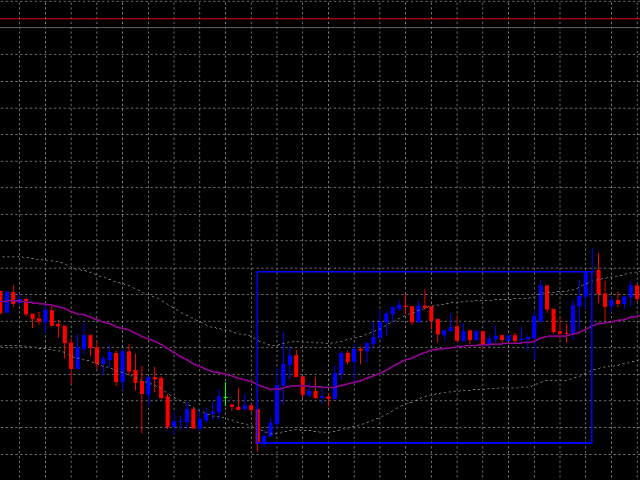
THE [VIZUALIZER] is a MetaTrader (MT4) Script designed to visualize an account history. It will read the account statement and then will visualize the positions on chart in form of rectangles, showing the OpenTime, OpenPrice, CloseTime and ClosePrice.
Generally, it has been developed to analyze the trading history, to observe how risky the particular positions were, allowing you to analyze the trading strategy from the account statement.
- It is working with standard MS Excel CSV files
- It is visualizing only one currency pair at a time
- Showing separately LONG and SHORT positions
THE [VIZUALIZER] features:
- Can be individually set-up to display positions including T/Ps and S/Ls
- You can choose individual colours for LONG and SHORT positions
- Works on different timeframes / you are free to drop it anywhere
Make sure to synchronize the account Statement with your MT4/Broker Server time.
IF YOU ALREADY PURCHASED THE PRODUCT:
Please write a private message to us, we will give you recommendations on how to set-up and use the VIZUALIZER, how to work with the account Statements and CSV files.
AUTHOR:
Antonin Skaryd, private investor and market analyst, software developer and founder of the FUTURE ENTERPRISE company.
The [VIZUALIZER] is useful tool to display the account Statement on chart. Generally, it has been developed to analyze the trading history, to observe how risky the particular positions were, allowing you to analyze the trading strategy from the account statement.

