Qv2 OBOS
- Indicateurs
- Joao Marcilio
- Version: 1.0
- Activations: 5
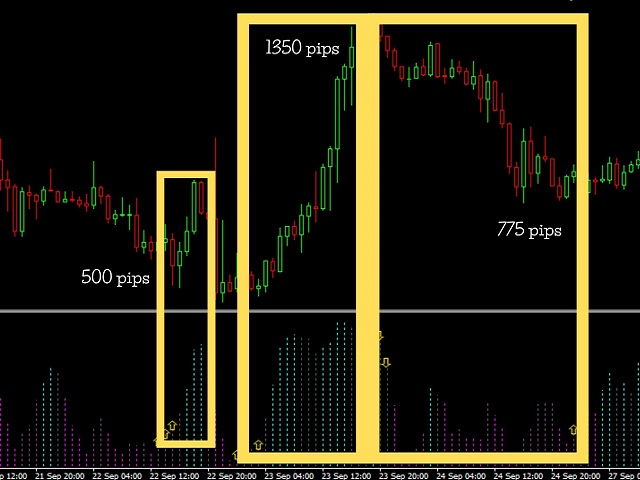
Qv² OBOS is an indicator that aims to identify overbought and oversold regions considering price standard deviation and volume analysis.
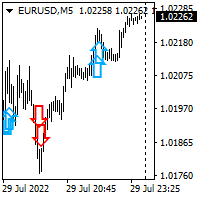
Oversold signals are indicated by arrows pointing upwards.
Overbought signals are indicated by arrows pointing downwards.
Can be used in all timeframes.
Can be used on all pairs.
I use in H1
Important note, the histogram is displayed to improve the trader's analysis. But the signs of overbought and oversold are the arrows as mentioned above.
Important note: I recommend using it in markets that show sideways (accumulating) moves. For trending markets I present my other indicator in this link Qv2 Trend
