Levels of Swing Market
- Indicateurs
- Alessandro Fucelli
- Version: 1.0
- Activations: 5
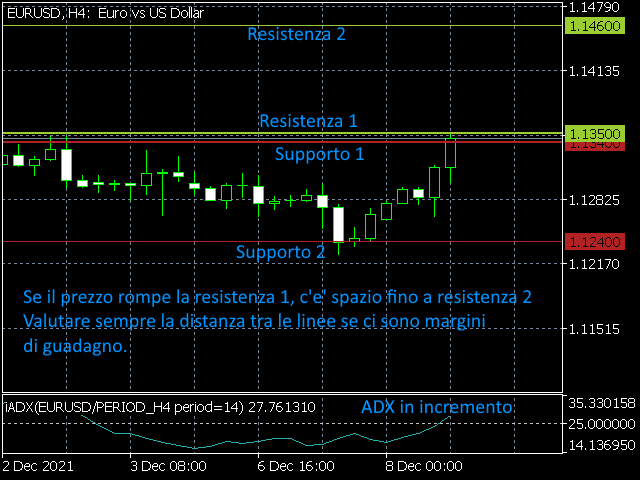
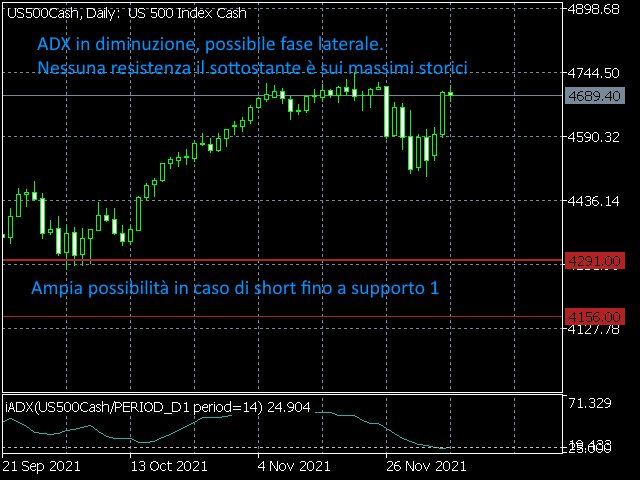
This indicator shows supports and resistences calculated form historical data when market was swing.
When market was swing ? When ADX was below 25 for some bars. In fact market can be considered without a trend.
I mean and suggest timeframes H4 and Daily.
Using that lines in the present you see resistance and support. More lines are distant and best is possible profit.
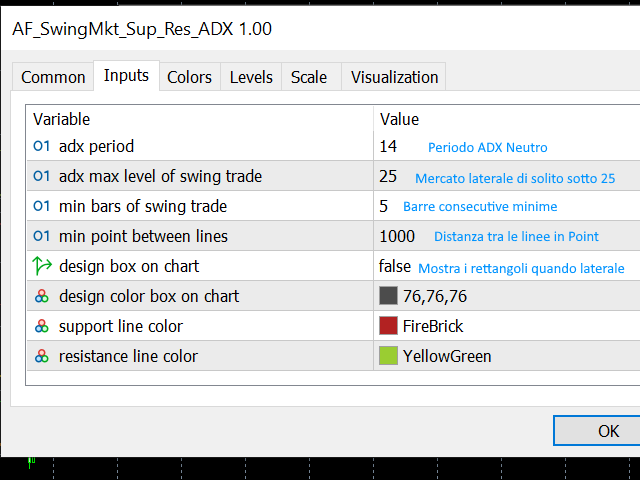
Every ADX parameters can be set, so colors, swing market bars number.
I am available to get feedback or modify code.
Thanks
Alessandro

