• Aperçu
  • Avis
  • Commentaires (1)

MarketMonitor

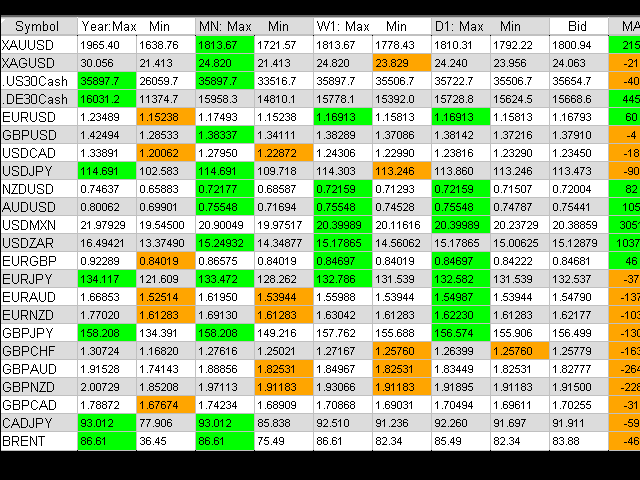
L'application affiche les données de plusieurs dizaines de paires sur une feuille. Cela vous permet d'identifier rapidement les paires prometteuses pour le trading.
Il n'est pas nécessaire d'ouvrir et d'analyser des dizaines de graphiques, vous n'ouvrirez que des graphiques 3-4-5 et exactement ceux qui doivent être analysés.
Voir dans "Commentaires" l'image en taille réelle.
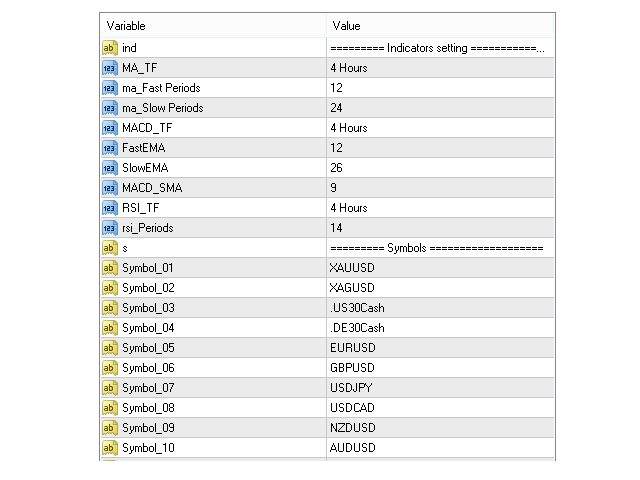
Le menu peut être réglé de 1 à 30 symboles. Si cela ne suffit pas, vous pouvez en ajouter un nombre illimité via l'interface graphique. Vous pouvez également y supprimer les paires inutiles.
L'interface graphique vous permet également de modifier les paramètres de tendance des indicateurs intégrés.
    L'indicateur trouve le maximum et le minimum du jour, de la semaine, du mois, de l'année. Le tableau affiche les valeurs maximales / minimales. L'amplitude "maximum-minimum" est affichée dans l'info-bulle pour chacune des périodes.
Si le prix s'approche du maximum ou du minimum, la cellule correspondante change de couleur. Si le maximum est Lime, si le minimum est Orange.
Le haut / bas peut également être comparé au prix actuel, qui est également affiché dans le tableau.
   Il y a 3 indicateurs intégrés dans l'application : MA-Cross, MACD, RSI.
Le tableau affiche les valeurs actuelles des indicateurs, ainsi que la direction de la tendance est indiquée par la couleur.
Les paramètres de base des indicateurs sont définis dans le menu, tous peuvent être modifiés via l'interface graphique.
Double-cliquez sur la ligne verte épaisse sous l'interface graphique pour ouvrir le menu de l'application.

Paramètres d'entrée
MA_TF ... ... ... rsi_Periods - Paramètres d'entrée des indicateurs.
Symbol_01 ... Symbol_30 sont les noms des paires que vous avez l'intention d'observer. Les noms doivent être entrés exactement tels qu'ils apparaissent sur l'onglet Market Watch. La casse, les points, les tirets comptent.
Produits recommandés
The Stock Exchange One Sessions Hours version 2.00 This indicator facilitates observing the currency pair's quotations during subsequent parts of the stock exchange session live. Before the session starts, a rectangle is drawn on the chart but not filled in with color. It means the extent of the session duration. Before the first bar enters the rectangle of the session, a sound signal or pop-up window will notify us that the session will just start. When the price graph crosses the edge of th
FREE
Skan
Niravkumar Maganbhai Patel
4.67 (3)
SKAN   This indicator helps you to scan all symbols which are in the Market Watch window and filter out a trend with alerts. It works on five most effective indicators which are used by most of traders for trading: Moving Average Super Trend (ST) Bolinger Band (BB) OPRC BFD It calculates two bars for scanning. When box colour changes to coral or royal blue colour, it indicates you for trend change for long and short entry. And also you will get alert on screen. When it changes to royal blue, it
FREE
This indicator uses a different approach from the previous version to get it's trendlines. This method is derived from Orchard Forex, and the process of making the indicator is demonstrated in there video   https://www.youtube.com/watch?v=mEaiurw56wY&t=1425s . The basic idea behind this indicator is it draws a   tangent line   on the highest levels and lowest levels of the bars used for calculation, while ensuring that the lines don't intersect with the bars in review (alittle confusing? I kno
FREE
RSI with Bands
Amirhossein Ghasemi Moroodi
Après 7 ans, j'ai décidé de mettre à disposition gratuitement certains de mes propres indicateurs et Expert Advisors (EAs). Si vous les trouvez utiles, merci de  soutenir avec une évaluation de 5 étoiles ! Vos retours me motivent à continuer à fournir des outils gratuits. Découvrez mes autres outils gratuits également ici . _________________________________ Indicateur "RSI avec Bandes" – Pour de meilleures décisions de trading L'indicateur "RSI avec Bandes" combine le RSI classiq
FREE
QuantumAlert Stoch Navigator is a free indicator available for MT4/MT5 platforms, its work is to provide "alerts" when the market is inside "overbought and oversold" regions in the form of "buy or sell" signals. This indicator comes with many customization options mentioned in the parameter section below, user can customise these parameters as needful. Join our   MQL5 group , where we share important news and updates. You are also welcome to join our private channel as well, contact me for the p
FREE
The Hong Kong Stock Exchange Session's Hours This indicator facilitates observing the currency pair's quotations during subsequent parts of the stock exchange session live. Before the session starts, a rectangle is drawn on the chart but not filled in with color. It means the extent of the session duration. Before the first bar enters the rectangle of the session, a sound signal or pop-up window will notify us that the session will just start. When the price graph crosses the edge of the sess
FREE
This indicator collects and organizes spread data. It is an organic add-on to my news robot, ExpertNews , which can be downloaded here . You can also watch a video about news trading using the ExpertNews robot. It is available on youtube . Unfortunately, it is not possible to place the robot in the mql5.com store, because the automatic validation of ExpertNews by the mql5 service ends in failure. In reality, there are no errors in the robot. Testing fails due to the fact that the advisor
FREE
Critical Zones MT4
Rodrigo Arana Garcia
Critical Zones a été créé spécialement pour les traders manuels à la recherche d'entrées plus précises sur le marché. Cet indicateur utilise des algorithmes avancés pour détecter les zones d'intérêt en calculant le support et la résistance les plus pertinents sur le graphique, ainsi que leurs cassures et retests. Cet indicateur peut être configuré pour envoyer des alertes et des notifications lorsque des opportunités d'achat/vente potentiellement lucratives sont détectées, permettant ainsi aux
FREE
Market Profile 3
Hussien Abdeltwab Hussien Ryad
3 (2)
Market Profile 3 MetaTrader 4 indicator  — is a classic Market Profile implementation that can show the price density over time, outlining the most important price levels, value area, and control value of a given trading session. This indicator can be attached to timeframes between M1 and D1 and will show the Market Profile for daily, weekly, monthly, or even intraday sessions. Lower timeframes offer higher precision. Higher timeframes are recommended for better visibility. It is also possible t
FREE
PTW NON REPAINT TRADING SYSTEM + HISTOGRAM Non-Repainting ,   Non-Redrawing   and   Non-Lagging  Trading System. Does the following: - Gives Accurate Entry and Exit Points - Scalping, Day and Swing Trading  - 95% Accuracy  - Targets, where to take profits. - Shows Trends, Support and resistance levels - Works on All Brokers - Works on All Currencies, CFDs and Stocks - It does not place trades for you, it only shows you what trades to place. - It works on All Timeframes - It is for Trend or ra
The Icarus Reversals(TM) FREE Indicator is a powerful tool to identify high-probability reversal points, across all instruments.  The Reversals Indicator provides traders and investors with a simple-to-use and highly dynamic insight into points of likely price-action reversals.  Generated by a unique proprietary code-set, the Reversals Indicator (FREE version) generates long and short trade signals, which can be customised for key inputs and colourisation. Settings of the Icarus Reversals FREE h
FREE
Fonctionne avec l'indicateur Trend Line PRO et les fichiers set créés par l'utilitaire Optimizer Vous pouvez télécharger des programmes supplémentaires: ici Le scanner est conçu pour recevoir de nouveaux signaux de l'indicateur Trend Line PRO sur toutes les paires et toutes les périodes de M5 à MN1 Pour que le scanner fonctionne, vous devez avoir un indicateur. Le principal avantage de SCANNER Trend Line PRO est la possibilité d'utiliser un fichier de jeu individuel pour chaque paire et cha
FREE
RaysFX Supertrend + Alert RaysFX Supertrend è un indicatore di tendenza superiore progettato per i trader che desiderano avere un vantaggio nel mercato. Questo indicatore utilizza una combinazione di CCI (Commodity Channel Index) e ATR (Average True Range) per identificare le tendenze del mercato e fornire segnali di trading accurati. Caratteristiche principali Indicatori CCI e ATR: Utilizza due degli indicatori più popolari e affidabili per identificare le tendenze del mercato e generare segnal
FREE
TrendPlus
Sivakumar Subbaiya
4.08 (12)
Trend Plus   Trendplus  Indicator   Time Frame: Suitable for any time frame.  Purpose: Trend Prediction. Blue and red candle indicate the buy and sell call respectively. Buy: When the blue candle is formed buy call is initiated. close the buy trades when the next red candle will formed.   Sell: When the Red candle is formed Sell call is initiated. close the Sell trades when the next blue candle will formed.   Happy trade!!
FREE
Minutes 51
Joaquin Nicolas Metayer
On the other hand, we denounce with righteous indignation and dislike men who are so beguiled and demoralized by the charms of pleasure of the moment, so blinded by desire, that they cannot foresee the pain and trouble that are bound to ensue; and equal blame belongs to those who fail in their duty through weakness of will, which is the same as saying through shrinking from toil and pain. These cases are perfectly simple and easy to distinguish. In a free hour, when our power of choice is untram
FREE
FRM Half Trend
Noiros Tech
5 (1)
YOU CAN NOW DOWNLOAD FREE VERSIONS OF OUR PAID INDICATORS . IT'S OUR WAY OF GIVING BACK TO THE COMMUNITY ! >>>    GO HERE TO DOWNLOAD   The system is a free open source pine script originally published on TradingView by everget   . It was converted to Mt4 by Forex Robot Makers. This system is a  popular trend indicator based on ATR ( Average True Range ) , Moving Averages and the Donchian channel . System BackGround ATR The average true range is an indicator of the price volatility of an as
FREE
Candle GAP
Thushara Dissanayake
3 (1)
L'indicateur   Candle GAP   est un outil essentiel pour les traders utilisant   les stratégies de Gap Trading   car il identifie automatiquement les écarts de bougie pour chaque jour de la semaine. Un écart fait référence à une différence de niveau de prix entre la clôture et l'ouverture de deux jours consécutifs. Cet indicateur reconnaît quatre types de schémas d'écart : commun, de rupture, de continuation et d'épuisement. En incorporant cet indicateur dans n'importe quel graphique, les traders
FREE
This product shows you a different view of the market by examining the performance of volume and continuous patterns in the market, then by calculating the behavior of traders and market patterns, calculates the probability of the next movement of the market by calculations. Function. How to receive the signal: If the candlestick is currently a bullish candlestick, according to a market scan, if the next bullish candlestick is below 5%, you can open a free trade by hitting the wisdom areas.
Wise Men Indicator demo
Bohdan Kasyanenko
3 (2)
The indicator displays signals according to the strategy of Bill Williams on the chart. Demo version of the indicator has the same features as the paid, except that it can work only on a demo account . Signal "First Wise Man" is formed when there is a divergent bar with angulation.  Bullish divergent bar - with lower minimum and closing price in the upper half. Bearish divergent bar - higher maximum and the closing price at the bottom half. Angulation is formed when all three lines of Alligat
FREE
Super trend is one of the best trend indicators in metatrader 4 (MT4). Triple SuperTrend indicator is an indicator that consist of three super trend indicator that can be aranged. This indicator is built by mql4 language and doesn't provided by MT4 platform. Highly recommended using EMA SuperTrend Strategy Indicator if you want to get better result in here: https://www.mql5.com/en/market/product/91664 This indicator is easy to use, power full and has many benefits, there are: Using three ind
FREE
Email Drawdown Alert
Roman Starostin
5 (12)
Free informative Indicator-helper. It'll be usefull for traders who trade many symbols or using grid systems (Averaging or Martingale). Indicator counts drawdown as percent and currency separate. It has a number of settings: Count deposite drawdown according equity value and send e-mail or notifications to user if DD more than set; Sending e-mail when max open orders reached; Shows price and remaining pips amount before MarginCall on current chart and Account generally; Display summary trade lot
FREE
Oscillator helps determine the direction of the market Shows the direction of the price movement and is painted in the appropriate color. Allows you to conduct trend and counter trend trading It works on all timeframes, on any currency pairs, metals and cryptocurrency Can be used when working with binary options Distinctive features Does not redraw; Simple and clear settings; It works on all timeframes and on all symbols; Suitable for trading currencies, metals, options and cryptocurrency (Bitco
Free automatic Fibonacci is an indicator that automatically plots a Fibonacci retracement based on the number of bars you select on the BarsToScan setting in the indicator. The Fibonacci is automatically updated in real time as new highest and lowest values appears amongst the selected bars. You can select which level values to be displayed in the indicator settings. You can also select the color of the levels thus enabling the trader to be able to attach the indicator several times with differe
FREE
Rainbow MT4
Jamal El Alama
Rainbow MT4 is a technical indicator based on Moving average with period 34 and very easy to use. When price crosses above MA and MA changes color to green, it’s a signal to buy. When price crosses below MA and MA changes color to red, it’s a signal to sell. The Expert advisor ( Rainbow EA MT4) based on Rainbow MT4 indicator, as you can see in the short video below is now available here .
FREE
Contact me for any queries or custom orders, if you want to use this in an EA. Key Features: Pattern Recognition : Identifies Fair Value Gaps (FVGs) Spots Break of Structure (BOS) points Detects Change of Character (CHoCH) patterns Versatile Application : Optimized for candlestick charts Compatible with any chart type and financial instrument Real-Time and Historical Analysis : Works seamlessly with both real-time and historical data Allows for backtesting strategies and live market analysis V
FREE
Check my paid tools they work great and I share Ea's based on them for free please r ate The Dual Timeframe RSI (Relative Strength Index) indicator is a novel trading tool that allows traders to monitor RSI readings from two different timeframes on a single chart. This dual perspective enables traders to identify potential trend confirmations and divergences more effectively. For instance, a trader might use a 1-hour RSI alongside a daily RSI to ensure that short-term trades align with the bro
FREE
QuantumAlert RSI Navigator is a free indicator available for MT4/MT5 platforms, its work is to provide "alerts" when the market is inside "overbought and oversold" regions in the form of "buy or sell" signals. This indicator comes with many customization options mentioned in the parameter section below, user can customise these parameters as needful. Join our   MQL5 group , where we share important news and updates. You are also welcome to join our private channel as well, contact me for the pri
FREE
Trend Strength Meter
Sukunthakan Ngernbamrung
Simple Trading System Update !!! Follow this link to see our 2024 Strategy !!!   ( Download the EAs scanner ) INTRODUCTION : The strength meter is an trading tool that is used to identify trending and consolidating markets based on the percentage rate.  HOW TO USE IT : You can use this indicator with Deal Trading Trend >> Click Here << To use this trading tool to identify trending and consolidating markets (the most important part)
FREE
MT Scanner
Niravkumar Maganbhai Patel
4 (2)
This indicator helps you to Scan symbols which are in the Market Watch Window  and filter out trends with alerts. It works based on the effective indicator "SUPERTREND" which is used by many traders for trading: When box color changes to " Green " or " Red " color, it indicates you for trend change for long and short entry. And also you will get alerted on screen. When it changes to " Green ", it indicates you that trend is going upwards, and you can take the long entry. If the color changes to
FREE
MASi Three Screens
Aleksey Terentev
5 (2)
MASi Three Screens is based on the trading strategy by Dr. Alexander Elder. This indicator is a collection of algorithms. Algorithms are based on the analysis of charts of several timeframes. You can apply any of the provided algorithms. List of versions of algorithms:     ThreeScreens v1.0 - A simple implementation, with analysis of the MACD line;     ThreeScreens v1.1 - A simple implementation, with analysis of the MACD histogram;     ThreeScreens v1.2 - Combines the first two algorithms
FREE
Les acheteurs de ce produit ont également acheté
Gann Made Easy
Oleg Rodin
4.86 (83)
Gann Made Easy est un système de trading Forex professionnel et facile à utiliser qui est basé sur les meilleurs principes de trading en utilisant la théorie de mr. WD Gann. L'indicateur fournit des signaux d'ACHAT et de VENTE précis, y compris les niveaux Stop Loss et Take Profit. Vous pouvez échanger même en déplacement en utilisant les notifications PUSH. S'il vous plaît contactez-moi après l'achat! Je partagerai avec vous mes astuces de trading et d'excellents indicateurs bonus gratuitement!
- Real price is 80$ - 40% Discount ( It is 49$ now ) Contact me for instruction, add group and any questions! Related Products:  Bitcoin Expert , Gold Expert Introduction The breakout and retest strategy is traded support and resistance levels. it involves price breaking through a previous level.  The break and retest strategy is designed to help traders do two main things, the first is to avoid false breakouts. Many false breakouts start with a candlestick that breaks out of a level but ends w
FX Volume
Daniel Stein
4.58 (33)
Obtenez votre mise à jour quotidienne du marché avec des détails et des captures d'écran via notre Morning Briefing ici sur mql5 et sur Telegram ! FX Volume est le PREMIER et SEUL indicateur de volume qui fournit un VRAI aperçu du sentiment du marché du point de vue d'un courtier. Il fournit des informations impressionnantes sur la façon dont les acteurs institutionnels du marché, comme les courtiers, sont positionnés sur le marché des changes, bien plus rapidement que les rapports COT. Voir c
Enigmera
Ivan Stefanov
5 (3)
ENIGMERA : Le cœur du marché https://www.enigmera.com Introduction Cet indicateur et ce système de trading constituent une approche remarquable des marchés financiers. ENIGMERA utilise les cycles fractals pour calculer avec précision les niveaux de support et de résistance. Il indique la phase d'accumulation authentique et donne une direction et des objectifs.  Un système qui fonctionne que nous soyons dans une tendance ou une correction.  Comment fonctionne-t-il ? ENIGMERA comprend trois l
Atomic Analyst
Issam Kassas
5 (2)
Tout d'abord, il convient de souligner que cet indicateur de trading n'est ni repainting, ni redrawing et ne présente aucun délai, ce qui le rend idéal à la fois pour le trading manuel et automatisé. Manuel de l'utilisateur : réglages, entrées et stratégie. L'Analyste Atomique est un indicateur d'action sur les prix PA qui utilise la force et le momentum du prix pour trouver un meilleur avantage sur le marché. Équipé de filtres avancés qui aident à éliminer les bruits et les faux signaux, et à
FX Power MT4 NG
Daniel Stein
5 (13)
Obtenez votre mise à jour quotidienne du marché avec des détails et des captures d'écran via notre Morning Briefing ici sur mql5 et sur Telegram ! FX Power MT4 NG est la nouvelle génération de notre très populaire indicateur de force des devises, FX Power. Et qu'est-ce que ce compteur de force de nouvelle génération offre ? Tout ce que vous avez aimé de l'original FX Power PLUS Analyse de la force de l'OR/XAU Des résultats de calcul encore plus précis Périodes d'analyse configurables individuel
Gold Stuff
Vasiliy Strukov
4.89 (241)
Gold Stuff est un indicateur de tendance conçu spécifiquement pour l'or et peut également être utilisé sur n'importe quel instrument financier. L'indicateur ne se redessine pas et ne traîne pas. Délai recommandé H1. Au niveau de l'indicateur de travail, l'Expert Advisor EA Gold Stuff est entièrement automatique. Vous pouvez le trouver sur mon profil. Vous pouvez obtenir une copie gratuite de notre indicateur Strong Support et Trend Scanner, veuillez envoyer un message privé. moi! Contactez
Trend Punch
Mohamed Hassan
4.95 (19)
This indicator is unstoppable when combined with our other indicator called  Support & Resistance . After purchase, send us a message and you will get it   for  FREE as a BONUS! Introducing Trend Punch , the revolutionary forex trend indicator that will transform the way you trade! Trend Punch is uniquely designed to provide precise buy and sell arrows during strong market trends, making your trading decisions clearer and more confident. Whether you're trading major currency pairs or exotic sym
TPSproTREND PrO
Roman Podpora
4.79 (19)
TPSpro TREND PRO   est un indicateur de tendance qui analyse automatiquement le marché et fournit des informations sur la tendance et chacun de ses changements, ainsi que des signaux pour entrer dans des transactions sans redessiner ! L'indicateur utilise chaque bougie et les analyse séparément. faisant référence à différentes impulsions - impulsion ascendante ou descendante. Points d'entrée précis dans les transactions sur les devises, les crypto-monnaies, les métaux, les actions, les indices 
Gann Swing Structure
Kirill Borovskii
5 (1)
This indicator is based on the mathematics of the great trader W.D. Ganna. With its help, you can easily find strong levels by analyzing swings to find the optimal entry point. The indicator works on all instruments and all timeframes. The indicator is fully manual and has control buttons. All you need to do is press the NEW button, a segment will appear, which you can place on any movement, swing or even 1 candle that you want to analyze. By placing the segment, press the OK button. A grid (th
Scalper Inside PRO
Alexey Minkov
4.73 (56)
An exclusive indicator that utilizes an innovative algorithm to swiftly and accurately determine the market trend. The indicator automatically calculates opening, closing, and profit levels, providing detailed trading statistics. With these features, you can choose the most appropriate trading instrument for the current market conditions. Additionally, you can easily integrate your own arrow indicators into Scalper Inside Pro to quickly evaluate their statistics and profitability. Scalper Inside
Dynamic Forex28 Navigator
Bernhard Schweigert
5 (1)
Dynamic Forex28 Navigator - L'outil de trading Forex de nouvelle génération. ACTUELLEMENT 49 % DE RÉDUCTION. Dynamic Forex28 Navigator est l'évolution de nos indicateurs populaires de longue date, combinant la puissance de trois en un : Advanced Currency Strength28 Indicator (695 avis) + Advanced Currency IMPULSE avec ALERT (520 avis) + CS28 Combo Signals (Bonus). Détails sur l'indicateur https://www.mql5.com/en/blogs/post/758844 Qu'offre l'indicateur de force de nouvelle génération ? T
Actuellement 20% de réduction ! La meilleure solution pour tout débutant ou trader expert ! Ce logiciel de tableau de bord fonctionne sur 28 paires de devises. Il est basé sur 2 de nos principaux indicateurs (Advanced Currency Strength 28 et Advanced Currency Impulse). Il donne un excellent aperçu de l'ensemble du marché Forex. Il montre les valeurs de l'Advanced Currency Strength, la vitesse de mouvement des devises et les signaux pour 28 paires de devises dans tous les (9) délais. Imagine
Trend Screener
STE S.S.COMPANY
4.81 (88)
Indicateur de tendance, solution unique révolutionnaire pour le trading et le filtrage des tendances avec toutes les fonctionnalités de tendance importantes intégrées dans un seul outil ! Il s'agit d'un indicateur multi-période et multi-devises 100 % non repeint qui peut être utilisé sur tous les symboles/instruments : forex, matières premières, crypto-monnaies, indices et actions. OFFRE À DURÉE LIMITÉE : L'indicateur Support and Resistance Screener est disponible pour seulement 50 $ et à vie. (
Nous vous présentons ON Trade Waves Patterns Harmonic Elliot Wolfe, un indicateur avancé conçu pour détecter divers types de schémas sur le marché à l'aide de méthodes manuelles et automatiques. Voici comment il fonctionne : Schémas Harmoniques : Cet indicateur peut identifier les schémas harmoniques qui apparaissent sur votre graphique. Ces schémas sont essentiels pour les traders qui pratiquent la théorie du trading harmonique, telle qu'elle est décrite dans le livre de Scott Carney "Harmonic
Scalper Vault
Oleg Rodin
5 (27)
Scalper Vault est un système de scalpage professionnel qui vous fournit tout ce dont vous avez besoin pour un scalpage réussi. Cet indicateur est un système de trading complet qui peut être utilisé par les traders de forex et d'options binaires. Le délai recommandé est M5. Le système vous fournit des signaux fléchés précis dans le sens de la tendance. Il vous fournit également des signaux supérieurs et inférieurs et des niveaux de marché Gann. Les indicateurs fournissent tous les types d'alertes
TPA True Price Action indicator reveals the true price action of the market makers through 100% non-repainting signals (except early signals mode) strictly at the close of a candle! TPA shows entries and re-entries, every time the bulls are definitely stronger than the bears and vice versa. Not to confuse with red/green candles. The shift of power gets confirmed at the earliest stage and is ONE exit strategy of several. There are available now two free parts of the TPA User Guide for our custo
Stratos Pali
Michela Russo
5 (1)
Stratos Pali Indicator   is a revolutionary tool designed to enhance your trading strategy by accurately identifying market trends. This sophisticated indicator uses a unique algorithm to generate a complete histogram, which records when the trend is Long or Short. When a trend reversal occurs, an arrow appears, indicating the new direction of the trend. Important Information Revealed Leave a review and contact me via mql5 message to receive My Top 5 set files for Stratos Pali at no cost! D
Currency Strength Wizard est un indicateur très puissant qui vous offre une solution tout-en-un pour un trading réussi. L'indicateur calcule la puissance de telle ou telle paire de devises en utilisant les données de toutes les devises sur plusieurs périodes. Ces données sont représentées sous la forme d'un indice de devise facile à utiliser et de lignes électriques de devise que vous pouvez utiliser pour voir la puissance de telle ou telle devise. Tout ce dont vous avez besoin est d'attacher l'
Le système PRO Renko est un système de trading très précis spécialement conçu pour le trading de graphiques RENKO. Il s'agit d'un système universel qui peut être appliqué à divers instruments de négociation. Le système neutralise efficacement ce qu'on appelle le bruit du marché en vous donnant accès à des signaux d'inversion précis. L'indicateur est très facile à utiliser et n'a qu'un seul paramètre responsable de la génération du signal. Vous pouvez facilement adapter l'outil à n'importe q
TPSpro RFI Levels
Roman Podpora
4.82 (22)
INSTRUCTIONS       RUS   -   ANGLAIS       Il   est recommandé de l'utiliser avec un indicateur       -       TPSpro   TENDANCE PRO -   Version MT4         Un élément clé du trading est constitué par les zones ou les niveaux à partir desquels les décisions d'achat ou de vente d'un instrument de trading sont prises. Malgré les tentatives des principaux acteurs de dissimuler leur présence sur le marché, ils laissent inévitablement des traces. Notre tâche était d'apprendre à identifier ces traces
Currency Strength Exotics
Bernhard Schweigert
4.87 (30)
ACTUELLEMENT 20% DE RÉDUCTION ! La meilleure solution pour tout débutant ou trader expert ! Cet indicateur est spécialisé pour montrer la force de la devise pour tous les symboles comme les paires exotiques, les matières premières, les indices ou les contrats à terme. C'est le premier de son genre, n'importe quel symbole peut être ajouté à la 9ème ligne pour montrer la force réelle de la devise de l'or, l'argent, le pétrole, DAX, US30, MXN, TRY, CNH etc. Il s'agit d'un outil de trading uniq
Le profit de la structure du marché change à mesure que le prix s'inverse et recule. L'indicateur d'alerte d'inversion de la structure du marché identifie le moment où une tendance ou un mouvement de prix approche de l'épuisement et est prêt à s'inverser. Il vous avertit des changements dans la structure du marché qui se produisent généralement lorsqu'un renversement ou un recul majeur est sur le point de se produire. L'indicateur identifie initialement les cassures et la dynamique des prix,
Tout d'abord, il convient de souligner que cet outil de trading est un indicateur non repeint, non redessiné et non retardé, ce qui le rend idéal pour le trading professionnel. Cours en ligne, manuel utilisateur et démonstration. L'indicateur Smart Price Action Concepts est un outil très puissant à la fois pour les nouveaux et les traders expérimentés. Il regroupe plus de 20 indicateurs utiles en un seul, combinant des idées de trading avancées telles que l'analyse du trader Inner Circle et les
Trend Pulse
Mohamed Hassan
5 (4)
Please contact me after purchase to immediately get your PDF strategy + documentation for Trend Pulse !  Introducing Trend Pulse , a unique and robust indicator capable of detecting bullish, bearish, and even ranging trends! Trend Pulse uses a special algorithm to filter out market noise with real precision. If the current symbol is moving sideways, Trend Pulse will send you a ranging signal, letting you know that it's not a good time to enter a trade. This excellent system makes Trend Pulse
MetaBands M4
Vahidreza Heidar Gholami
5 (2)
MetaBands uses powerful and unique algorithms to draw channels and detect trends so that it can provide traders with potential points for entering and exiting trades. It’s a channel indicator plus a powerful trend indicator. It includes different types of channels which can be merged to create new channels simply by using the input parameters. MetaBands uses all types of alerts to notify users about market events. Features Supports most of the channel algorithms Powerful trend detection algorith
Gold Channel is a volatility-based indicator, developed with a specific timing algorithm for the XAUUSD pair, which consists of finding possible corrections in the market. This indicator shows two outer lines, an inner line (retracement line) and an arrow sign, where the theory of the channel is to help identify overbought and oversold conditions in the market. The market price will generally fall between the boundaries of the channel. If prices touch or move outside the channel it is a tra
Automated Trendlines
Georgios Kalomoiropoulos
5 (16)
Les lignes de tendance sont l'outil d'analyse technique le plus essentiel dans le trading forex. Malheureusement, la plupart des commerçants ne les dessinent pas correctement. L'indicateur Automated Trendlines est un outil professionnel pour les traders sérieux qui vous aide à visualiser le mouvement de tendance des marchés. Il existe deux types de lignes de tendance, les lignes de tendance haussières et les lignes de tendance baissières. Dans la tendance haussière, la ligne de tendance
ICT, SMC, SMART MONEY CONCEPTS, SMART MONEY, Smart Money Concept, Support and Resistance, Trend Analysis, Price Action, Market Structure, Order Blocks, BOS/CHoCH,   Breaker Blocks ,  Momentum Shift,   Supply&Demand Zone/Order Blocks , Strong Imbalance, HH/LL/HL/LH,    Fair Value Gap, FVG,  Premium  &   Discount   Zones, Fibonacci Retracement, OTE, Buy Side Liquidity, Sell Side Liquidity, BSL/SSL Taken, Equal Highs & Lows, MTF Dashboard, Multiple Time Frame, BigBar, HTF OB, HTF Market Structure, 
Advanced Supply Demand
Bernhard Schweigert
4.91 (295)
CURRENTLY 26% OFF !! Best Solution for any Newbie or Expert Trader! This indicator is a unique, high quality and affordable trading tool because we have incorporated a number of proprietary features and a new formula. With this update, you will be able to show double timeframe zones. You will not only be able to show a higher TF but to show both, the chart TF, PLUS the higher TF: SHOWING NESTED ZONES. All Supply Demand traders will love it. :) Important Information Revealed Maximize the potenti
Plus de l'auteur
Ce petit script va égayer votre vie. Vous trouverez ci-dessous son code, vous pouvez l'insérer dans OnInit de n'importe quel robot. Ou changez les couleurs et l'échelle selon vos goûts #property copyright "V.Temchenko Skype:vasily.temchenko" #property link        " Mailto:tvp.prog.96 @gmail.com" #property version    "1.00" #property strict #property description    "Have questions? Skype: vasily.temchenko Viber: +38098 800-6-800" ; #property description    "If the voice - only Russian, Ukrainian
FREE
Robot sans indicateur avec une interface graphique. Trading automatique, semi-automatique et manuel. Des dizaines d'options de paramètres - du trading conservateur à long terme à la martingale de grille agressive. Interface intuitive, personnalisation facile. Contrôle total en mode visuel du testeur. Stop suiveur intelligent par distance et niveaux avec des paramètres séparés pour le premier trade (le plus rentable) et les suivants. La distance de fuite augmente dynamiquement avec la croissance
Il s'agit d'une fonction dans le shell de l'indicateur. Génère un signal de trading pour un nombre spécifié de TF (de 1 à 4). Les voyants fournis avec le terminal ne sont pas utilisés. Le calcul de base est effectué à l'aide de la formule MACD, mais à l'aide d'une EMA de troisième génération modifiée (répond plus rapidement à un changement soudain de tendance). De plus, la fonction : - dessine deux bandes montrant la force de la tendance. - détecte le moment du changement de tendance vers l'oppo
TricolorEMA
Vasyl Temchenko
L'indicateur compare avec la constante Difer la différence de ClosePrice entre le point de décalage Point1 et Bar1 (la dernière barre fermée). Si la valeur est positive et dépasse Difer, la ligne bleue est tracée, ce qui correspond à la tendance UP. Si la valeur est négative et dépasse Difer, la ligne magenta est tracée, ce qui correspond à la tendance DN. L'absence de tendance (Flat) est indiquée par la couleur Jaune.    Vous pouvez également échanger en traversant la MA rapide et lente. Cette
Filtrer:
Aucun avis
Répondre à l'avis