Flat finder MT4
- Indicateurs
- Yuriy Lyachshenko
- Version: 1.0
- Activations: 5
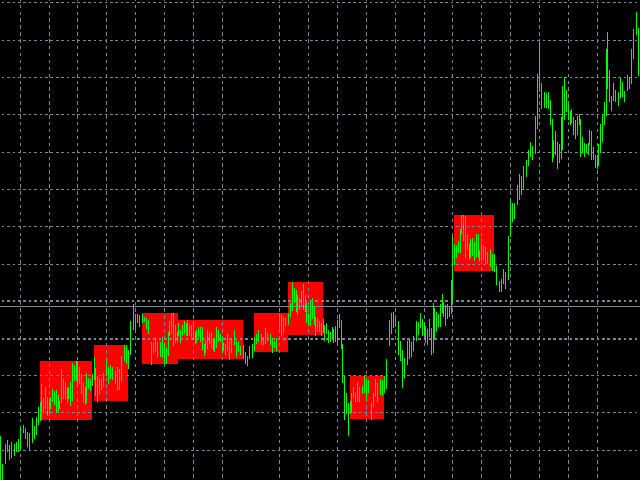
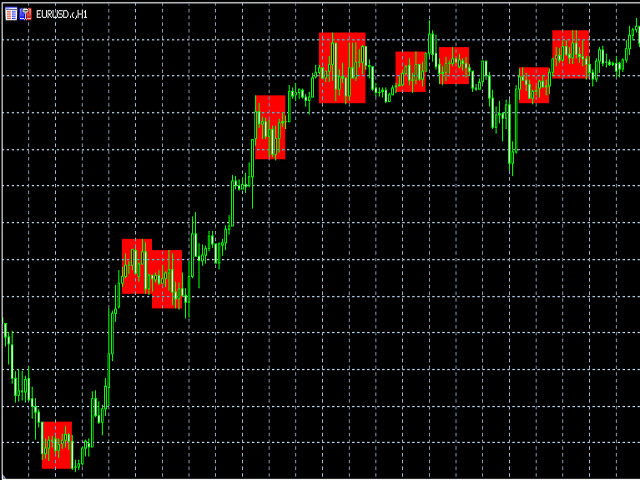
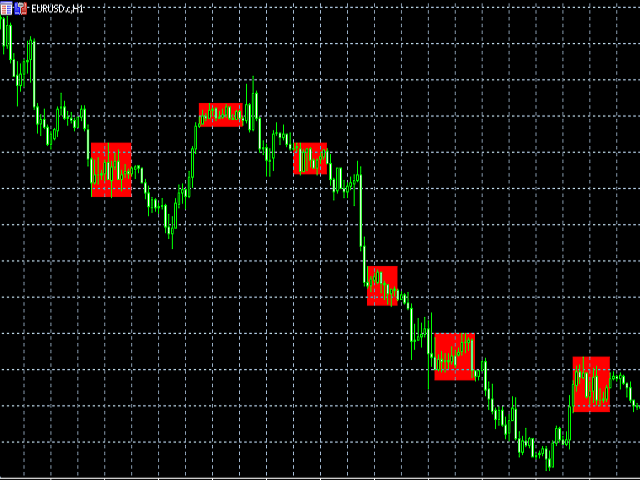
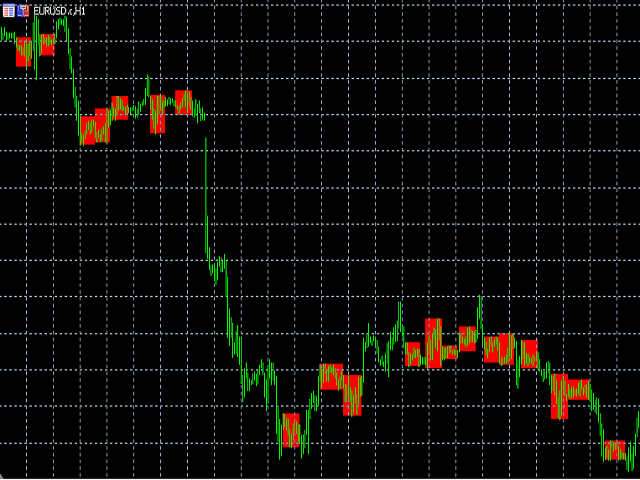
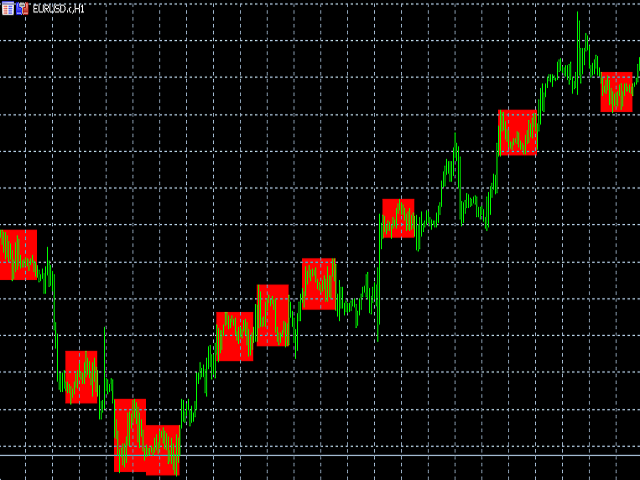
Cet indicateur détecte un flat et peint la zone trouvée avec un rectangle coloré.
L'idée principale de cet indicateur est de détecter un plat lorsque le prix remplit une certaine zone sur le graphique.
Paramètres d'entrée :
Color rectangle - couleur du rectangle à ombrer.
Bars in rectangle - nombre minimum autorisé de barres dans un rectangle.
Density in % - densité de l'aplat, définie en pourcentage de la surface du rectangle.