• Aperçu
  • Avis (1)
  • Commentaires (8)

NeuroScalperMT5

MT4 indicator version

https://www.mql5.com/en/market/product/72342


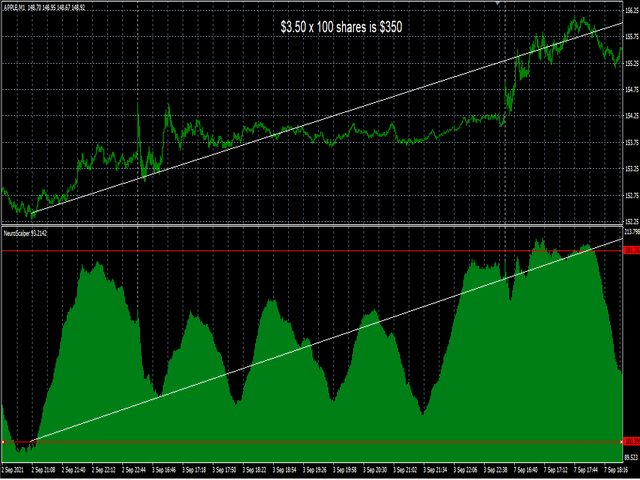
I personally use this indicator to scalp.  Accurate for accessing extremes and supports for buy positions primarily for 1 minute time frames.  Other time frames can be used but the levels are different. Its a better oscillator and compare with others to see the difference.  


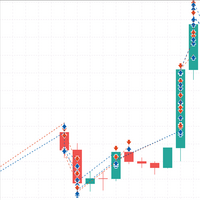
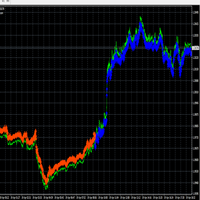
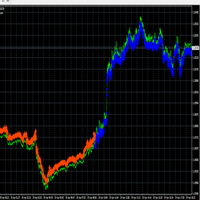
Day trade using neuro network concepts.  This indicator uses elementary forms of neuro networks to generate signals to buy and sell. Use the indicator on 1 minute charts.  Indicator does not repaint.   Download and run on tester using 1 minute charts or other charts using different levels, analyze the trades to see for yourself. Many opportunities to scalp the markets.  Can be used on higher time frames but the levels should be changed according to your discretion.  Higher time frames have higher ranges.


Concept and things to consider with this model:

Multiple indicators are used, weights applied and 2 data points for the max an min.
This indicator is for trading uptrends mainly 
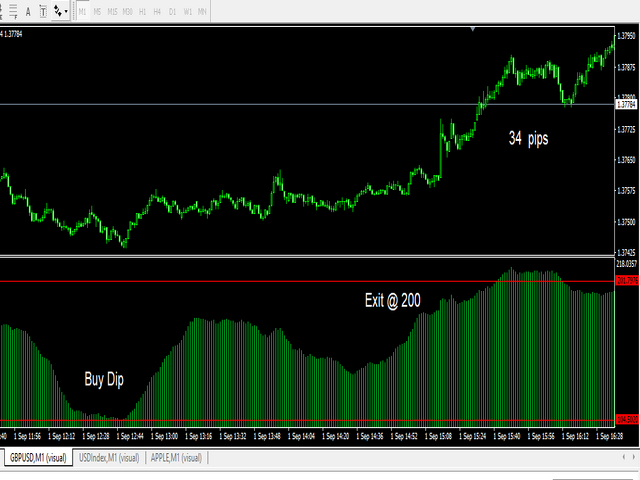
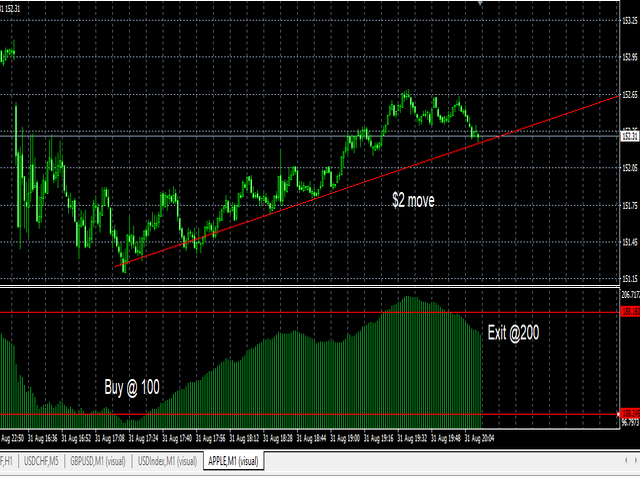
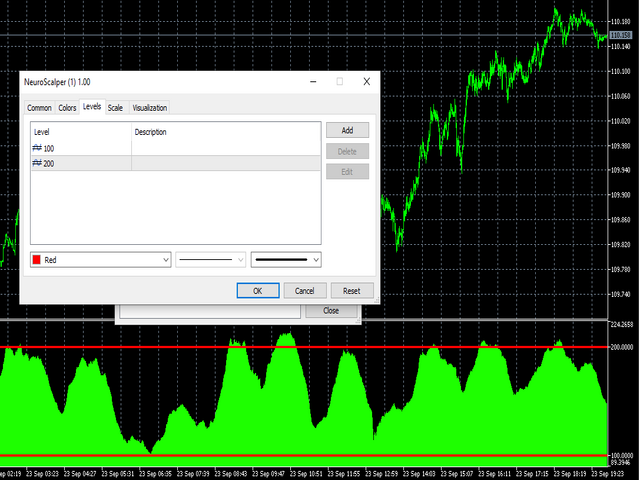
Add levels in settings(see picture) 100 and 200 for the oscillator, or other levels if using different time frames.
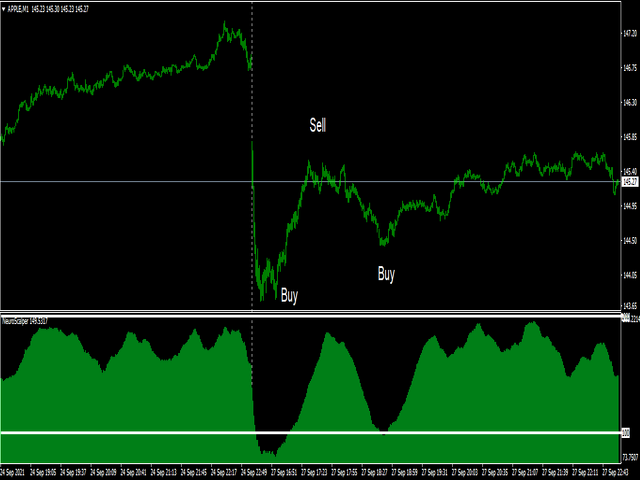
Buy when the price dips below lowest levels for the pair and time frame.  This is the cluster with good accuracy on 1 minutes.

    Rules:

    • Buy below 100 level and exit at 200.

    Download and run on tester using on the charts to see what levels are the best for buying.  Analyze the trades to see for yourself. Many opportunities to scalp the markets.


    Produits recommandés
    Rainbow MT5
    Jamal El Alama
    4 (1)
    Description : Rainbow MT5 is a technical indicator based on Moving Average with period 34 and very easy to use. When price crosses above MA and MA changes color to green, then this is a signal to buy. When price crosses below MA and MA changes color to red, then this is a signal to sell. The Expert advisor ( Rainbow EA MT5 ) based on Rainbow MT5 indicator is now available here . MT4 version is available here .
    FREE
    Follow The Line MT5
    Oliver Gideon Amofa Appiah
    4.52 (29)
    This indicator obeys the popular maxim that: "THE TREND IS YOUR FRIEND" It paints a GREEN line for BUY and also paints a RED line for SELL. (you can change the colors). It gives alarms and alerts of all kinds. IT DOES NOT REPAINT and can be used for all currency pairs and timeframes. Yes, as easy and simple as that. Even a newbie can use it to make great and reliable trades. NB: For best results, get my other premium indicators for more powerful and reliable signals. Get them here: https://www.m
    FREE
    Le Capteur de Tendance : La Stratégie du Capteur de Tendance avec Indicateur d'Alerte est un outil d'analyse technique polyvalent qui aide les traders à identifier les tendances du marché et les points d'entrée et de sortie potentiels. Elle présente une stratégie dynamique de Capteur de Tendance, s'adaptant aux conditions du marché pour une représentation visuelle claire de la direction de la tendance. Les traders peuvent personnaliser les paramètres selon leurs préférences et leur tolérance
    FREE
    Key level wedge MT5
    Presley Annais Tatenda Meck
    The   Key level wedge MT5   indicator automatically draws rising wedge pattern and falling wedge pattern for you on the chart. This pattern is really good when used as a confirmation entry at key support & resistance, supply & demand and reversal zones. Advantages  The   Key level wedge MT5   block DOES NOT RE-PAINT, giving you confidence when a signal appears and also helps when looking back.  The   Key level wedge MT5   includes an on/off button on the chart to easily keep the charts cle
    Pivot MT5
    Dmitrij Isaenko
    The indicator draws daily support and resistance lines on the chart, as well as the Pivot level (reversal level). Adapted to work in MT5 The standard timeframe for calculating support and resistance levels is D1. You can choose other timeframes according to your strategy (for example, for M1-M15, the optimal timeframe for calculations is H1) The function for calculating support and resistance levels has been updated; in this calculation option, fibonacci levels are taken into account, res
    FREE
    Weis Waves
    Flavio Javier Jarabeck
    2.83 (18)
    The original author is David Weis, an expert in the Wyckoff Method. The Weis Wave is a modern adaptation of the 1930's Wyckoff Method, another expert in Tape Reading techniques and Chart Analysis. Weis Waves takes market volume and stacks it into waves according to price conditions giving the trader valuable insights about the market conditions. If you want to learn more about this subject you can find tons of videos in YouTube. Just look for "The Wickoff Method", "Weis Wave" and "Volume Spread
    FREE
    BTFX Pivot Points
    Bradley Thomas Farrington
    The BTFX Pivot Points is an indicator which calculates the Support and Resistance levels for each day. By using this indicator the pivot levels point out clear targets to aim for. The resistance levels are shown in purple above the silver pivot line. The support levels are shown in Orange and can be found below the silver pivot line. This indicators works very well when used with The BTFX Daybreak Indicator. For a more in depth explanation of these indicators please watch the Youtube video attac
    This is Gekko's Cutomized Cutomized Average Directional Index (ADX), a customized version of the famous ADX indicator. Use the regular ADX and take advantage two entry signals calculations and different ways of being alerted whenever there is potential entry or exit point. Inputs Period: Period for the ADX calculation; PlotSignalType: How will the indicator calculate entry (swing) signals: 1- ShowSwingsOnTrendLevel : Show Signals for Trend Confirmation Swings; 2- ShowSwingsOnTrendLevelDirectio
    Best SAR MT5
    Ashkan Hazegh Nikrou
    5 (2)
    La description :  nous sommes heureux de vous présenter notre nouvel indicateur gratuit basé sur l'un des indicateurs professionnels et populaires du marché des changes (PSAR). Cet indicateur est une nouvelle modification de l'indicateur SAR parabolique original. Dans l'indicateur pro SAR, vous pouvez voir un croisement entre les points et le graphique des prix. le croisement n'est pas un signal mais parle du potentiel de fin de mouvement, vous pouvez commencer à acheter par un nouveau point
    FREE
    Are you tired of drawing trendlines every time you're analyzing charts? Or perhaps you would like more consistency in your technical analysis. Then this is for you. This indicator will draw trend lines automatically when dropped on a chart. How it works Works similar to standard deviation channel found on mt4 and mt5. It has 2 parameters: 1. Starting Bar 2. Number of bars for calculation The   starting bar   is the bar which drawing of the trend lines will begin, while the   number of bars for c
    FREE
    LT Donchian Channel
    Thiago Duarte
    4.8 (5)
    Donchian Channel is an indicator created by Richard Donchian. It is formed by taking the highest high and the lowest low of the last specified period in candles. The area between high and low is the channel for the chosen period. Its configuration is simple. It is possible to have the average between the upper and lower lines, plus you have alerts when price hits one side. If you have any questions or find any bugs, please contact me. Enjoy!
    FREE
    Value Chart Candlesticks
    Flavio Javier Jarabeck
    4.7 (10)
    The idea of a Value Chart indicator was presented in the very good book I read back in 2020 , " Dynamic Trading Indicators: Winning with Value Charts and Price Action Profile ", from the authors Mark Helweg and David Stendahl. The idea is simple and the result is pure genius: Present candlestick Price analysis in a detrended way! HOW TO READ THIS INDICATOR Look for Overbought and Oversold levels. Of course, you will need to test the settings a lot to find the "correct" one for your approach.
    FREE
    Donchian Pro
    Paulo Henrique Faquineli Garcia
    5 (3)
    The Donchian Channel Channels are among the most popular tools of technical analysis, as they visually convey to the analyst the limits within which most price movement tends to occur. Channel users know that valuable information can be obtained at any time, whether prices are in the central region of a band or close to one of the border lines. One of the best known techniques to explore these concepts is Bollinger Bands. However, John Bollinger was not the only one to research the applicatio
    FREE
    Free automatic Fibonacci is an indicator that automatically plots a Fibonacci retracement based on the number of bars you select on the BarsToScan setting in the indicator. The Fibonacci is automatically updated in real time as new highest and lowest values appears amongst the selected bars. You can select which level values to be displayed in the indicator settings. You can also select the color of the levels thus enabling the trader to be able to attach the indicator several times with differe
    FREE
    White Weis Volume Ticks
    Ricardo Almeida Branco
    5 (4)
    White Weis Volume This indicator shows the sum of the volume in each wave, bulish or bearish, as idealized by David Weis , but it brings an important addition , which is the marking of the bar with the highest volume of the wave (White Bar)! In coding the indicator, it was sought to optimize the code to require minimal processing during use and not to overload mt5. The indicator can be used for pre-trading analysis and study, where the trader analyzes possible points of support and resi
    HMA Trend Professional MT5
    Pavel Zamoshnikov
    4.25 (4)
    Improved version of the free HMA Trend indicator (for MetaTrader 4) with statistical analysis. HMA Trend is a trend indicator based on the Hull Moving Average (HMA) with two periods. HMA with a slow period identifies the trend, while HMA with a fast period determines the short-term movements and signals in the trend direction. The main differences from the free version: Ability to predict the probability of a trend reversal using analysis of history data. Plotting statistical charts for analyz
    Bollinger Bands B
    Flavio Javier Jarabeck
    5 (1)
    John Bollinger created this indicator in 2010 as a way to read the original indicator (Bollinger Bands) in a more "technical" way, shown as an oscillator. The typical range of the Bollinger Bands %B is 0 - 0.5 - 1.0, where "0" represents the lower band, the "0.5" the middle band, and "1" the upper band. The line on the indicator represents the Closing prices. As simple as that. SETTINGS Bollinger Bands period of analysis Standard Deviation multiplier Shift Price type to be analyzed If you
    FREE
    Donchian Channel DC is the indicator of Donchian Channels, that plots maximum and minimum values of a specific period, besides mean value line. It´s possible to configure simple period for analysis and the indicator will plot all three values. You can trade with this indicator as trend or reversal, according to each strategy. Do not let to test others indicators as soon as others expert advisors.
    Cet indicateur vous montrera les valeurs TP et SL (dans cette devise) que vous avez déjà définies pour chaque commande sur les graphiques (fermées à la ligne de transaction/commande) qui vous aideront beaucoup à estimer vos profits et pertes pour chaque commande. Et il vous montre également les valeurs PIP. le format affiché est "Valeurs monétaires de nos valeurs de profit ou de perte / PIPs". La valeur TP sera affichée en couleur verte et la valeur SL sera affichée en couleur rouge. Pour tou
    Weis Waves RSJ
    JETINVEST
    4.5 (8)
    The Weis Waves RSJ Indicator sums up volumes in each wave. This is how we receive a bar chart of cumulative volumes of alternating waves. Namely the cumulative volume makes the Weis wave charts unique. It allows comparing the relation of the wave sequence characteristics, such as correspondence of the applied force (expressed in the volume) and received result (the price progress). If you still have questions, please contact me by direct message:  https://www.mql5.com/en/users/robsjunqueira/
    FREE
    Tabajara V5
    Flavio Javier Jarabeck
    4.85 (33)
    Metatrader 5 version of the famous Andre Machado's Tabajara indicator. If you don't know Andre Machado's Technical Analysis work you don't need this indicator... For those who need it and for those several friend traders who asked this porting from other platforms, here it is... FEATURES 8-period Moving Average 20-period Moving Average 50-period Moving Average 200-period Moving Average Colored candles according to the inflexion of the 20-period MA SETTINGS You can change the Period of all M
    FREE
    Automatic Trendlines
    Pasi Hakamaki
    4.63 (41)
    The indicator draws trendlines on chart. This indicator has six inputs. User can specify alternative labels for both lines. If multiple instances of the indicator are used, the labels must differ. User can set width and color of the lines and depth which specifies what significant peaks should be used. For example, Depth=10 sets trendlines using the current peaks and valleys that have at least 10 bars to the right and to the left and that have highs/lows less/greater than the peak's high/low. In
    FREE
    Half ma
    Artem Svistunov
    The Half ma arrow indicator for the MetaTrader 5 trading terminal is a simple but effective tool that gives a signal about a change in the current trend. The Half ma indicator looks like a solid dynamic line that changes color at the points where the trend changes. At these points, the indicator draws arrows of the corresponding color and direction.The Half ma arrow indicator for the MT5 terminal is not an independent source of input signals. It will be most effective to use it as a trend filte
    Bar Color Trend
    Germano Chagas
    4.5 (6)
    Combining the best of Price Action , Directional Movement , and Divergence/Convergence analysis, Candle Color Trend is a easy and reliable way to identify trend direction. The indicator automatically paints the candles according to the assumption that an uptrend is defined by prices that form a series of higher highs and higher lows. In contrast, a downtrend is defined by prices that form a series of lower highs and lower lows. Additionally, ADX Wilder indicator is used to measure trend weakness
    FREE
    The Penta-O is a 6-point retracement harmonacci pattern which usually precedes big market movements. Penta-O patterns can expand and repaint quite a bit. To make things easier this indicator implements a twist: it waits for a donchian breakout in the right direction before signaling the trade. The end result is an otherwise repainting indicator with a very reliable trading signal. The donchian breakout period is entered as an input. [ Installation Guide | Update Guide | Troubleshooting | FAQ | A
    This z-score indicator shows the correct z-score of an asset, as it uses the normalized price data for calculation, which is the only correct way. Z-score is only applicable for normal distributed data, therefore not the actual price is considered, but the normalised returns, which were assumed to follow a normal distribution. Returns are mean reverting and assumed to follow a normal distribution, therefore z-score calculation of returns is more reliable than z-score on price, as price is NOT m
    Multi ZigZag
    Jose Freitas Alves Neto
    # Indicador MultiZigZag Pro para MetaTrader 5 O MultiZigZag Pro é um poderoso indicador técnico para a plataforma MetaTrader 5 que identifica, de forma inteligente e flexível, os principais pontos de inflexão e tendências nos gráficos de preços. ## Características principais: - Algoritmo avançado que filtra ruídos e movimentos irrelevantes do mercado  - Múltiplos timeframes para análise de tendências de curto a longo prazo - Parâmetros de profundidade e desvio personalizáveis para adaptação
    Designed by Welles Wilder for daily commodity charts, the ADXW is now used in various markets by technical traders to assess the strength of a trend or even a trend for short- or long-term trades. The ADXW uses a positive (DI+) and negative (DI-) directional indicator in addition to its trend line (ADX). According to Wilder, a trend has strength when the ADX signal is above 25; the trend is weak (or the price has no trend) when the ADX is below 20. The absence of a trend does not mean that
    Important Lines
    Terence Gronowski
    4.86 (21)
    This indicator displays Pivot-Lines, preday high and low, preday close and the minimum and maximum of the previous hour. You just have to put this single indicator to the chart to have all these important lines, no need to setup many single indicators. Why certain lines are important Preday high and low : These are watched by traders who trade in a daily chart. Very often, if price climbs over or falls under a preday low/high there is an acceleration in buying/selling. It is a breakout out of
    FREE
    L'indicateur montre des niveaux ronds sur le graphique. Ils sont également appelés niveaux psychologiques, niveaux de banque ou niveaux des principaux acteurs. À ces niveaux, il y a une véritable lutte entre les haussiers et les baissiers, une accumulation de nombreux ordres, ce qui entraîne une volatilité accrue. L'indicateur s'adapte automatiquement à tout instrument et à toute période. Si le niveau 80 est cassé puis testé, il faut acheter. Si le niveau 20 est cassé puis testé, vendre. L'obje
    FREE
    Les acheteurs de ce produit ont également acheté
    TPSproTREND PrO MT5
    Roman Podpora
    4.82 (11)
    TPSpro TREND PRO  - is a trend indicator that automatically analyzes the market and provides information about the trend and each of its changes, as well as giving signals for entering trades without redrawing! The indicator uses each candle, analyzing them separately. referring to different impulses - up or down impulse. Exact entry points into transactions for currencies, crypto, metals, stocks, indices!  Version MT4               DETAILED DESCRIPTION               R ecommended to use with an
    TPSpro RFI Levels MT5
    Roman Podpora
    4.75 (12)
    INSTRUCTIONS       RUS   -   ANGLAIS       Il   est recommandé de l'utiliser avec un indicateur       -       TPSpro   TENDANCE PRO -   Version MT4         Un élément clé du trading est constitué par les zones ou les niveaux à partir desquels les décisions d'achat ou de vente d'un instrument de trading sont prises. Malgré les tentatives des principaux acteurs de dissimuler leur présence sur le marché, ils laissent inévitablement des traces. Notre tâche était d'apprendre à identifier ces traces
    Trend Screener Pro MT5
    STE S.S.COMPANY
    4.88 (66)
    Indicateur de tendance, solution unique révolutionnaire pour le trading et le filtrage des tendances avec toutes les fonctionnalités de tendance importantes intégrées dans un seul outil ! Il s'agit d'un indicateur multi-période et multi-devises 100 % non repeint qui peut être utilisé sur tous les symboles/instruments : forex, matières premières, crypto-monnaies, indices et actions. Trend Screener est un indicateur de suivi de tendance efficace qui fournit des signaux de tendance fléchés avec des
    Atbot
    Zaha Feiz
    4.88 (40)
    AtBot : Comment ça fonctionne et comment l'utiliser ### Comment ça fonctionne L'indicateur "AtBot" pour la plateforme MT5 génère des signaux d'achat et de vente en utilisant une combinaison d'outils d'analyse technique. Il intègre la Moyenne Mobile Simple (SMA), la Moyenne Mobile Exponentielle (EMA) et l'indice de la Plage Vraie Moyenne (ATR) pour identifier les opportunités de trading. De plus, il peut utiliser des bougies Heikin Ashi pour améliorer la précision des signaux. Laissez un avis ap
    Ce tableau de bord affiche les derniers   modèles harmoniques   disponibles pour les symboles sélectionnés, ce qui vous permettra de gagner du temps et d'être plus efficace /   version MT4 . Indicateur gratuit:   Basic Harmonic Pattern Colonnes de l'indicateur Symbol :   les symboles sélectionnés apparaissent Trend   :   haussière ou baissière Pattern :   type de motif (gartley, papillon, chauve-souris, crabe, requin, cypher ou ABCD) Entry:   prix d'entrée SL:   prix du stop loss TP1:   1
    Atomic Analyst MT5
    Issam Kassas
    4.32 (19)
    Tout d'abord, il convient de souligner que cet indicateur de trading n'est ni repainting, ni redrawing et ne présente aucun délai, ce qui le rend idéal à la fois pour le trading manuel et automatisé. Manuel de l'utilisateur : réglages, entrées et stratégie. L'Analyste Atomique est un indicateur d'action sur les prix PA qui utilise la force et le momentum du prix pour trouver un meilleur avantage sur le marché. Équipé de filtres avancés qui aident à éliminer les bruits et les faux signaux, et à
    Gold Stuff mt5
    Vasiliy Strukov
    4.92 (172)
    Gold Stuff mt5 est un indicateur de tendance conçu spécifiquement pour l'or et peut également être utilisé sur n'importe quel instrument financier. L'indicateur ne se redessine pas et ne traîne pas. Délai recommandé H1. Contactez-moi immédiatement après l'achat pour obtenir les réglages et un bonus personnel !   Vous pouvez obtenir une copie gratuite de notre indicateur Strong Support et Trend Scanner, veuillez envoyer un message privé. moi!   RÉGLAGES Dessiner la flèche - on off. dessine
    FX Power MT5 NG
    Daniel Stein
    4.75 (8)
    Obtenez votre mise à jour quotidienne du marché avec des détails et des captures d'écran via notre Morning Briefing ici sur mql5 et sur Telegram ! FX Power MT5 NG est la nouvelle génération de notre très populaire indicateur de force des devises, FX Power. Et qu'est-ce que ce compteur de force de nouvelle génération offre ? Tout ce que vous avez aimé de l'original FX Power PLUS Analyse de la force de l'OR/XAU Des résultats de calcul encore plus précis Périodes d'analyse configurables individuel
    FX Levels est un indicateur de support et de résistance exceptionnellement précis qui fusionne la méthode traditionnelle Lighthouse avec une approche dynamique innovante, fonctionnant parfaitement sur tous les symboles de trading. Cela inclut les paires de devises, les indices, les actions ou les matières premières. FX Levels identifie les points d'inversion et les affiche sur le graphique, qui peuvent être idéalement utilisés comme cibles de profit dans vos activités de trading. Pour développe
    Tout d'abord, il convient de souligner que ce système de trading est un indicateur non repeint, non redessiné et non retardé, ce qui le rend idéal pour le trading manuel et automatisé. Cours en ligne, manuel et téléchargement de préréglages. Le "Système de Trading Smart Trend MT5" est une solution de trading complète conçue pour les traders débutants et expérimentés. Il combine plus de 10 indicateurs premium et propose plus de 7 stratégies de trading robustes, ce qui en fait un choix polyvalent
    Quantum TrendPulse
    Bogdan Ion Puscasu
    5 (3)
    Présentation de   Quantum TrendPulse   , l'outil de trading ultime qui combine la puissance de   SuperTrend   ,   RSI   et   Stochastic   dans un seul indicateur complet pour maximiser votre potentiel de trading. Conçu pour les traders qui recherchent précision et efficacité, cet indicateur vous aide à identifier les tendances du marché, les changements de dynamique et les points d'entrée et de sortie optimaux en toute confiance. Caractéristiques principales : Intégration SuperTrend :   suivez f
    FX Volume MT5
    Daniel Stein
    4.93 (14)
    Obtenez votre mise à jour quotidienne du marché avec des détails et des captures d'écran via notre Morning Briefing ici sur mql5 et sur Telegram ! FX Volume est le PREMIER et SEUL indicateur de volume qui fournit un VRAI aperçu du sentiment du marché du point de vue d'un courtier. Il fournit des informations impressionnantes sur la façon dont les acteurs institutionnels du marché, comme les courtiers, sont positionnés sur le marché des changes, bien plus rapidement que les rapports COT. Voir c
    ATrend
    Zaha Feiz
    4.86 (7)
    ATREND ATREND : Comment ça fonctionne et comment l'utiliser Comment ça fonctionne L'indicateur "ATREND" pour la plateforme MT5 est conçu pour fournir aux traders des signaux d'achat et de vente robustes en utilisant une combinaison de méthodologies d'analyse technique. Cet indicateur s'appuie principalement sur la plage vraie moyenne (ATR) pour mesurer la volatilité, ainsi que sur des algorithmes de détection de tendance pour identifier les mouvements potentiels du marché. Laissez un message ap
    Top indicator for MT5   providing accurate signals to enter a trade without repainting! It can be applied to any financial assets:   forex, cryptocurrencies, metals, stocks, indices .  Watch  the video  (6:22) with an example of processing only one signal that paid off the indicator! MT4 version is here It will provide pretty accurate trading signals and tell you when it's best to open a trade and close it. Most traders improve their trading results during the first trading week with the help of
    Support And Resistance Screener est dans un indicateur de niveau pour MetaTrader qui fournit plusieurs outils à l'intérieur d'un indicateur. Les outils disponibles sont : 1. Filtre de structure de marché. 2. Zone de repli haussier. 3. Zone de recul baissier. 4. Points pivots quotidiens 5. points pivots hebdomadaires 6. Points pivots mensuels 7. Support et résistance forts basés sur le modèle harmonique et le volume. 8. Zones au niveau de la banque. OFFRE D'UNE DURÉE LIMITÉE : L'indicateur de sup
    Matrix Arrow Indicator MT5
    Juvenille Emperor Limited
    5 (13)
    Matrix Arrow Indicator MT5   est une tendance unique 10 en 1 suivant un indicateur multi-période   100% non repeint   qui peut être utilisé sur tous les symboles/instruments:   forex ,   matières premières ,   crypto-monnaies ,   indices ,  actions .  Matrix Arrow Indicator MT5  déterminera la tendance actuelle à ses débuts, en rassemblant des informations et des données à partir d'un maximum de 10 indicateurs standard, qui sont: Indice de mouvement directionnel moyen (ADX) Indice de canal de m
    Tout d'abord, il convient de souligner que cet outil de trading est un indicateur non repeint, non redessiné et non retardé, ce qui le rend idéal pour le trading professionnel. Cours en ligne, manuel utilisateur et démonstration. L'indicateur Smart Price Action Concepts est un outil très puissant à la fois pour les nouveaux et les traders expérimentés. Il regroupe plus de 20 indicateurs utiles en un seul, combinant des idées de trading avancées telles que l'analyse du trader Inner Circle et
    PZ Trend Trading MT5
    PZ TRADING SLU
    3.67 (3)
    Capture every opportunity: your go-to indicator for profitable trend trading Special Offer: Purchase now to receive free bonuses worth $109! (Read more for details) Trend Trading is an indicator designed to profit as much as possible from trends taking place in the market, by timing pullbacks and breakouts. It finds trading opportunities by analyzing what the price is doing during established trends. [ Installation Guide | Update Guide | Troubleshooting | FAQ | All Products ] Trade financial
    ICT, SMC, SMART MONEY CONCEPTS, SMART MONEY, Smart Money Concept, Support and Resistance, Trend Analysis, Price Action, Market Structure, Order Blocks, BOS/CHoCH,   Breaker Blocks ,  Momentum Shift,   Supply&Demand Zone/Order Blocks , Strong Imbalance,   HH/LL/HL/LH,    Fair Value Gap, FVG,  Premium  &   Discount   Zones, Fibonacci Retracement, OTE, Buy Side Liquidity, Sell Side Liquidity, BSL/SSL Taken, Equal Highs & Lows, MTF Dashboard, Multiple Time Frame, BigBar, HTF OB, HTF Market Structure
    ** All Symbols x All Timeframes scan just by pressing scanner button ** *** Contact me  to send you instruction and add you in "123 scanner group" for sharing or seeing experiences with other users. After 17 years of experience in the markets and programming, Winner indicator is ready. I would like to share with you! Introduction The 123 Pattern Scanner indicator with a special enhanced algorithm is a very repetitive common pattern finder with a high success rate . Interestingly, this Winner in
    Auto Order Block with break of structure based on ICT and Smart Money Concepts (SMC) Futures Break of Structure ( BoS )             Order block ( OB )            Higher time frame Order block / Point of Interest ( POI )    shown on current chart           Fair value Gap ( FVG ) / Imbalance   -  MTF      ( Multi Time Frame )    HH/LL/HL/LH  -  MTF      ( Multi Time Frame )  Choch  MTF      ( Multi Time Frame )  Volume Imbalance     ,  MTF          vIMB Gap’s Power of 3 Equal High
    Maintenant 147 $ (augmentant à 499 $ après quelques mises à jour) - Comptes illimités (PCS ou Mac) Manuel d'utilisation RelicusRoad + Vidéos de formation + Accès au groupe Discord privé + Statut VIP UNE NOUVELLE FAÇON DE REGARDER LE MARCHÉ RelicusRoad est l'indicateur de trading le plus puissant au monde pour le forex, les contrats à terme, les crypto-monnaies, les actions et les indices, offrant aux traders toutes les informations et tous les outils dont ils ont besoin pour rester renta
    Présentation       Quantum Breakout PRO   , l'indicateur révolutionnaire MQL5 qui transforme la façon dont vous négociez les zones d'évasion ! Développé par une équipe de traders expérimentés avec une expérience commerciale de plus de 13 ans,       Évasion quantique PRO       est conçu pour propulser votre parcours commercial vers de nouveaux sommets grâce à sa stratégie de zone de discussion innovante et dynamique. Quantum Breakout Indicator vous donnera des flèches de signalisation sur le
    Noise filtering: the key to mastering trends Special Offer: Purchase now to receive free bonuses worth $75! (Read more for details) This indicator tracks the market trend with an unmatched reliability, by ignoring sudden fluctuations and market noise. It has been designed to trend-trade intraday charts and small timeframes. Its winning ratio is around 85%. [ Installation Guide | Update Guide | Troubleshooting | FAQ | All Products ] Amazingly easy to trade Find oversold/overbought situatio
    Stratos Pali mt5
    Michela Russo
    5 (2)
    Stratos Pali Indicator is a revolutionary tool designed to enhance your trading strategy by accurately identifying market trends. This sophisticated indicator uses a unique algorithm to generate a complete histogram, which records when the trend is Long or Short. When a trend reversal occurs, an arrow appears, indicating the new direction of the trend. Important Information Revealed Leave a review and contact me via mql5 message to receive My Top 5 set files for Stratos Pali at no cost ! Do
    Quantum Trend Sniper
    Bogdan Ion Puscasu
    4.71 (49)
    Présentation       Quantum Trend Sniper Indicator   , l'indicateur révolutionnaire MQL5 qui transforme la façon dont vous identifiez et négociez les inversions de tendance ! Développé par une équipe de traders expérimentés avec une expérience commerciale de plus de 13 ans,       Indicateur Quantum Trend Sniper       est conçu pour propulser votre parcours de trading vers de nouveaux sommets grâce à sa manière innovante d'identifier les inversions de tendance avec une précision extrêmement élevée
    Bill Williams Advanced
    Siarhei Vashchylka
    5 (8)
    Bill Williams Advanced is designed for automatic chart analysis using Bill Williams' "Profitunity" system. The indicator analyzes four timeframes at once. Manual (Be sure to read before purchasing) Advantages 1. Automatically analyzes the chart using the "Profitunity" system of Bill Williams. The found signals are placed in a table in the corner of the screen. 2. Equipped with a trend filter based on the Alligator indicator. Most of the system signals are recommended to be used only accordi
    Ce tableau de bord découvre et affiche les zones   d'offre   et de   demande   sur le graphique, à la fois en mode scalping et à long terme, en fonction de votre stratégie de trading pour les symboles sélectionnés. En outre, le mode scanner du tableau de bord vous permet de vérifier tous les symboles souhaités en un coup d'œil et de ne manquer aucune position appropriée /   Version MT4 Indicateur gratuit:   Basic Supply Demand Caractéristiques Permet de visualiser les opportunités de tr
    Blahtech Supply Demand MT5
    Blahtech Limited
    4.54 (13)
    Was: $299  Now: $99   Supply Demand uses previous price action to identify potential imbalances between buyers and sellers. The key is to identify the better odds zones, not just the untouched ones. Blahtech Supply Demand indicator delivers functionality previously unavailable on any trading platform. This 4-in-1 indicator not only highlights the higher probability zones using a multi-criteria strength engine, but also combines it with multi-timeframe trend analysis, previously confirmed swings
    Smart Peak Bottom
    Xiaoyu Huang
    5 (2)
    Il s'agit d'un indicateur clair pour juger des hauts et des bas, et cela fonctionne bien pour le marché oscillant. Prix promotionnel 49$ → 59$ caractéristiques bon pour juger des hauts et des bas Pas de redessin, pas de dérive Calcul rapide, pas de décalage Mode de rappel riche Plusieurs paramètres et couleurs peuvent être ajustés paramètre "======== Principal ========" HighLowPeriod1 = 9 HighLowPeriod2 = 60 HighLowPeriod3 = 34 HighLowEMAPeriod = 4 MASignalPeriod = 5 "======== Notifier ==
    Plus de l'auteur
    HFTHackerMT5
    Thomas Bradley Butler
    5 (2)
    CECI EST RETOURNÉ À LA VERSION SIMPLE SANS RÉCUPÉRATION EN RAISON DE LA COMPLEXITÉ ET DE LA CONFUSION DES UTILISATEURS DANS L'OPTIMISATION. SI VOUS AVEZ ACHETÉ LA VERSION PRÉCÉDENTE EN DESSOUS DE 15 AVEC RÉCUPÉRATION, ALORS N'UTILISEZ PAS 15. JE DOIS DÉCIDER ENTRE LA VENTE ET LES COMMENTAIRES DES UTILISATEURS. SI C'EST TROP COMPLEXE, LES UTILISATEURS NE L'UTILISERONT PAS. OPTIMISEZ EA AVANT DE TESTER ET D'UTILISER. N'ACHETEZ QUE SI VOUS AVEZ OPTIMISÉ. Ceci est destiné aux traders qui savent op
    Gold M1
    Thomas Bradley Butler
    Aucune EA ne transformera des centaines en millions en de courtes périodes, c'est un mensonge. Peu de graphiques commerciaux d'EA en 1 minute, encore moins pour l'or. Cet EA est unique et négocie XAU/USD sur des périodes de 1 min en utilisant des chandeliers et l'indice Commodity Channel. Ajustez les entrées en conséquence, optimisez. Utilisez un VPS pour trader ou simplement l'utiliser à des fins de day trading. Recommandé pour le day trading, mais essayez des paramètres et des délais différen
    NeuroScalper
    Thomas Bradley Butler
    5 (1)
    Mettre à jour! Des flèches ont été ajoutées aux niveaux 100 et 200. Cet indicateur est précis pour accéder aux extrêmes et prend en charge les positions d'achat principalement pour des périodes de 1 minute. D'autres délais peuvent être utilisés mais les niveaux sont différents. C'est un meilleur oscillateur et se compare avec d'autres pour voir la différence. Commerce de jour utilisant des concepts de réseau neuro. Cet indicateur utilise des formes élémentaires de réseaux neuro pour génére
    HFTHacker
    Thomas Bradley Butler
    CECI EST RETOURNÉ À LA VERSION SIMPLE SANS RÉCUPÉRATION EN RAISON DE LA COMPLEXITÉ ET DE LA CONFUSION DES UTILISATEURS DANS L'OPTIMISATION OPTIMISEZ EA AVANT DE TESTER ET D'UTILISER. N'ACHETEZ QUE SI VOUS AVEZ OPTIMISÉ. Ceci est destiné aux traders qui savent optimiser et qui veulent être rentables sur leur propre mérite. VOUS DÉFINISSEZ VOS PARAMÈTRES DE RISQUE. Taux de gain élevé avec des stops pour les transactions qui ne fonctionnent pas si vous le souhaitez. Réduisez le risque pour la lo
    Black Gold M1
    Thomas Bradley Butler
    OPTIMIZE BEFORE BACKTEST AND USE Trade crude oil with this EA.  No EA turns hundreds into millions in a year or 2, This is a lie if presented this way.  Black Gold trades Brent Crude on 1 min charts.  It uses RSI, moving averages and directional indicators.  Try it out, load it onto the tester if you have the history and ability to trade Brent crude.    Adjust and optimize to get the most out of the expert advisor
    Matrix Hacker
    Thomas Bradley Butler
    MT4 Version :   https://www.mql5.com/en/market/product/87060 Matrix Hacker est réservé aux comptes couverts et utilise la marche aléatoire, le passé n'a pas d'importance. L'EA se fixe pour garder une assise stable sur le marché et couvrir à la fois les demandes et les offres. Achète et vend des offres et des demandes avec des quantités et des volumes variables selon le commerçant. Ce n'est pas recommandé pour un débutant car cela nécessite toujours de connaître l'optimisation et de ne pas sure
    Order Flow Volume MT5
    Thomas Bradley Butler
    OPTIMISER PENDANT UN AN POUR TROUVER LES MEILLEURES VALEURS Order Flow est unique en ce sens qu'il négocie le volume. Il a été construit sur l'EUR/USD et est optimisé du 11/11/2021 au 24/10/2022 sur des graphiques de 1 heure. Des entrées d'optimisation pour la gestion de l'argent sont utilisées. Cette EA utilise une gestion de l'argent stricte, ce n'est pas une martingale rapide ou une EA sans sl. Le trading concerne la gestion des risques, pas le jeu. Exécutez sur un graphique EUR/USD d'une
    Bitcoin White Hat Hacker
    Thomas Bradley Butler
    Optimize before use in back test or live for better results for you  and don't forget to account for spreads and slippage in optimization. This Expert is for 1 minute charts trading BTC/USD.  Bitcoin on 1 minute use MACD, CCI and RSI for entry and exit logic.  This EA was back tested and traded out of sample.  Each trade has a stop loss and take profit.   BTC compared to the indexes and Gold have huge differences, look at the example of traditional investing vs. Bitcoin.  Yellow line represents
    ForexReversal
    Thomas Bradley Butler
    4 (1)
    La patience est la clé d'un scalping sans stress. Échangez les flèches lorsque vous voyez qu'elles dépassent la moyenne mobile de 200 et créez une tendance en s'élargissant ou à partir du dernier point d'oscillation sans filtre de moyenne mobile. Agréable pour les tranches de temps de 1 minute, capturant les mouvements intrajournaliers dynamiques. Prenez facilement 20 pips ou restez plus longtemps pour des tendances plus importantes, en utilisant des arrêts suiveurs. Regardez les exemples sur l
    VolumeDayTrader
    Thomas Bradley Butler
    DAYTRADING POUR LES ACTIONS (CFD) uniquement. Le commerce demande du travail. Il n'y a pas de raccourcis ou d'indicateurs qui vous indiqueront toutes les entrées et sorties. Le profit vient de l'état d'esprit. Les indicateurs sont des outils à utiliser conjointement avec la gestion de l'argent et la psychologie du succès. Trouvez les déséquilibres dans le profil de volume. Déséquilibres du volume des prix commerciaux. De nombreux déséquilibres se produisent à la clôture et à l'ouverture et
    GoldBuyBackScalper
    Thomas Bradley Butler
    4 (1)
    Cet indicateur est pour XAU/USD, graphiques de 1 minute seulement. Chaque paire a des caractéristiques et des mouvements de prix uniques. Négociez des inversions en forme de V avec cet indicateur. Le cuir chevelu achète en utilisant des arrêts suiveurs et évite les nouvelles car elles sont plus extrêmes et peuvent provoquer des ventes soudaines. Attachez-vous à une période de 1 minute dans le backtest et voyez les achats d'inversion. L'indicateur ne repeint jamais ou ne recalcule jamais.
    TrueSupplyandDemand
    Thomas Bradley Butler
    This is based on short term strength or weakness and not on moving averages.  Moving averages are used for filter only. Trade supply and demand with arrows. Supply and demand breakouts and strength of the buyers or sellers .  Don't trade buy arrow to sell arrow.  Trade the strength with trendlines or moving averages and use stops.  The arrow can have some strong moves.  Trade on all time frames.  Try it out in the back tester. The pips can be made with this indicator, follow the arrows and mak
    ScalpingMaster
    Thomas Bradley Butler
    Master scalping with this indicator.  Trade on any time frame for scalps on buy or sells.  Follow trends using a 200 moving average and stops and targets.  Use with your own system.  This indicator can give pips if following it correctly.  Stick to rules and pick up pips daily.  Use as entries in a trend, scalp for a few pips or exit on opposite signal.  Best to follow higher time frame trends. Indicator doesn't repaint or recalculate. Rules: Don't trade overnight, only trade during active sessi
    DayTradeKing
    Thomas Bradley Butler
    This indicator is good for small time frames like 1 and 5 minutes and made for day trading. The indicator never repaints or recalculates. The indicator works is for trading swing points in day trading, following bulls or bears.  Its a simple to use, non cluttered indicator with a high success rate.  This indicator works well to capture ranges.  All indicators come with limitations and no indicator or system is always accurate. Use money management for long term trading success.   Place in backte
    DTKGold
    Thomas Bradley Butler
    This is the DayTradeKing for gold on a 1 minute time frame.  It is a different calculation for the range. Use a 200 period moving average as a filter.  Always use stops and avoid news, wait for more conformation.  This looks to capture intraday ranges. Put it in the back tester on 1 minute to see the price action and how it works. Trade with trend Use filter Use stops Alerts are added for pop ups and sound. 
    SuperArrowScalper
    Thomas Bradley Butler
    Trade trends with the Super Scalper Use on all time frames and assets it is  designed for scalping trends. Works good on small time frames for day trading.  The arrows are easy to follow.  This is a simple no repaint/no recalculate arrow indicator to follow trends with.  Use in conjunction with your own system or use moving averages.  Always use stops just below or above the last swing point or your own money management system The indicator comes with push notifications, sound alerts and email
    Levels Trading
    Thomas Bradley Butler
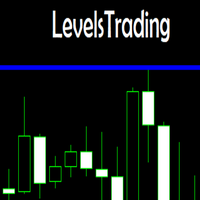
    This indicator is a simple stripped down version of any advanced support and resistance indicator.  All the support and resistance indicators work from a number of bars that have developed over time. Get rid of clutter and confusing levels.  Find levels according to a number of bars. Look at days, session, numbers of hours, periods of consolidation.  Watch levels develop and use as breakout points, or areas of buyers and sellers.  Features and things to consider This indicator is for a frame of
    ForexReversalEA
    Thomas Bradley Butler
    Cet EA est basé sur l'indicateur Forex Reversal. Si vous préférez échanger manuellement le système, téléchargez l'indicateur et essayez-le. https://www.mql5.com/en/market/product/57345 L'EA suivra la tendance et ouvrira des postes en conséquence. Les résultats montrent des gains stables avec un tirage inférieur, mais expérimentez-les dans le testeur arrière, l'optimiseur et les délais pour voir ce qui fonctionne. Tous les résultats présentés sont hypothétiques. Remarque : Il ne s'agit pas d
    MarketMaker
    Thomas Bradley Butler
    Automatisez le commerce de l'offre et de la demande. Faire un marché. Cet EA a été créé et inspiré par l'indicateur populaire d'offre et de demande que tout le monde vend et imite. L'EA continue de négocier et de se couvrir, créant un marché. Peut également être négocié sur des comptes non couverts. Il faut évaluer les risques et utiliser les délais, la taille des lots, les capacités de couverture. Je l'ai échangé pendant environ un mois au total et sur plusieurs paires à la fois. Conc
    Top Trader
    Thomas Bradley Butler
    Top Trader Indicator This is an arrow reversal indicator. This is with deviations and arrows.  Trade a blue arrow for buy and trade a red arrow for sell.  Change the time period and the deviations of the bands.  This is similar to others but these arrows don't repaint.  Load in back tester and study which periods and deviations work the best.  It works on all time frames.  15 min to 1 hr would give good results for take profits.  Try according to your own risk management.
    Quant Bot
    Thomas Bradley Butler
    Quant Bot est destiné au trading de tendance sur une période d'une heure pour l'EUR/USD. Il n'y a pas de fichier défini, mais si d'autres paires sont utilisées, une optimisation peut être nécessaire. À propos du robot: Il utilise la génération génétique et utilise l'ATR pour échanger. La période d'avance a été utilisée pour empêcher l'ajustement de la courbe L'EA utilise des arrêts sur chaque transaction. La gestion de l'argent est une mise à l'échelle avec % du solde La période de recul es
    Crypto Net
    Thomas Bradley Butler
    Les heures de courtage seront différentes de celles dans lesquelles la stratégie a été intégrée. Crypto Net est destiné au trading de BTCUSD. Il utilise l'évolution génétique pour faire évoluer la stratégie. Cette tendance des métiers EA suit les indicateurs se trouvent ATR et Ichimoku. Cela a été construit et a passé une série de tests robustes, y compris Monte Carlo et Walk Forward. Contributions: Pourcentage du compte correspondant au risque minimum. Nombre maximum de lots Temps
    PropTrader
    Thomas Bradley Butler
    *OPTIMISER EA AVANT UTILISATION* Stratégie de trading Forex optimisée pour l'EUR/USD Atteindre une richesse substantielle en un an ou deux avec un conseiller expert (EA) est une affirmation irréaliste. Le backtesting et le trading réel se concentrent sur la paire de devises EUR/USD. À propos de cette stratégie : Il s’agit de la première itération de notre stratégie, avec un potentiel d’avancées supplémentaires. Rigoureusement testé avec des données de qualité à 100 %, il est exempt d'err
    Down Under
    Thomas Bradley Butler
    Down Under négocie la paire AUD/USD sur une période d'une heure. Cette EA négocie l'ATR et l'OHLC. Il est formaté pour cette paire sur cette période. La composition est utilisée avec un min. taille du lot et max. la taille du lot. Le pourcentage des soldes est composé sur les transactions gagnantes. Comme l'équilibre fluctue, la taille du lot fluctue également. Réglages: mm risque % lots mm lots maximum Il n'y a rien d'autre à changer. Cela n'a pas de capacité de martingale ou de couv
    Cable Trader
    Thomas Bradley Butler
    GBP/USD 1hr. Cet EA échange élan et sessions. Cela a une composante de lot fixe et continuera de modifier le TP au fur et à mesure de son développement. Réglages: La taille du lot Il n'y a rien d'autre à changer. Cela n'a pas de capacité de martingale ou de couverture. La seule autre caractéristique à changer est si vous négociez, les CFD de GBP/USD. Changez cela par la décimale sur la plateforme du courtier. Avis de non-responsabilité Les contrats à terme, les options et le tr
    Euclidean
    Thomas Bradley Butler
    Euclidean est un algorithme de trading unique que j'ai créé il y a 8 ans. Cette évaluation environnementale fait partie de ce système. Il fonctionne comme un système fermé. L'EA lancera un achat lorsque le degré d'angle est correct pour saisir une tendance. Le stop loss est à 10% de l'angle. C'est aussi simple que cela. Contributions: % du solde en lots 1 micro lot pour 1 000 $ Lots supérieurs de volume = le nombre maximum de lots Niveau de profit = la valeur par défaut est de 50 pips Comme
    Pip Scalper
    Thomas Bradley Butler
    UN INDICATEUR POUR TOUS Pip Scalper est pour les tendances de scalping. Restez dans les tendances plus longtemps avec cet indicateur. Il fonctionne sur toutes les périodes et tous les actifs. Ramassez les pépins quotidiens avec cet outil. Utilisez la moyenne mobile de 200 pour filtrer les transactions. Délais plus courts recommandés. À utiliser pour le day trading. À propos et comment utiliser : Pips Scalper est basé sur le trading de tendance à plus long terme. Acheter sur bleu Vendre
    Evolved Trends
    Thomas Bradley Butler
    OPTIMISER AVANT LE TEST ET L'UTILISER POUR TROUVER LES MEILLEURES ENTRÉES Salut les commerçants ! Vous voulez un conseiller expert de pointe pour votre plateforme MT4 ? Ne cherchez pas plus loin que les tendances évoluées ! Ce puissant algorithme de trading, créé avec la technologie d'apprentissage automatique, se concentre sur le trading du GBP/USD sur des périodes d'une heure. Mais bon, n'hésitez pas à expérimenter d'autres actifs et délais d'optimisation ! Personnalisez simplement les entr
    Combine Winner
    Thomas Bradley Butler
    Trade any Forex combine out there.  Many prop firms offer challenge or instant funding combines.  The biggest problem is controlling the loss.  With this indicator you can get a visual system that can limit loss and teach discipline.  This uses the MACD and the strategy is scalping.  You can determine the risk and reward.  Visually follow small trends for scalps.  Trade during active sessions.  It's just a simple system to instill discipline while limiting loss and scalping pips with the paramet
    Holy Grail Arrow
    Thomas Bradley Butler
    Holy Grail arrow is for scalping.  The period you use will determine the trend.  You can try different time frames and periods to see what works best for your strategy.  Filters can be applied like a moving average or trendlines.  The 1 minute works good for scalps and always trade during active periods and avoid consolidation times.  Using other indicators to determine trends is recommended but this can also be a free flowing scalping system alone with tp and sl. Inputs: Period = trend period
    Filtrer:
    Konstantin Remezov
    1138
    Konstantin Remezov 2022.02.03 19:56 
     

    L'utilisateur n'a laissé aucun commentaire sur la note

    Répondre à l'avis