Pipsometer
- Indicateurs
- Andrew Ingosi Likare
- Version: 1.0
This is an indicator that shows total pips ,order counts and the total profit accumulated for the open orders of the pair attached. The colors change depending on if the total profit is positive , negative or zero.
Contact:
If you have some questions or if you need help, kindly contact me via Private Message.
Author:
A.L.I™, fintech software engineer and a passionate forex trader.
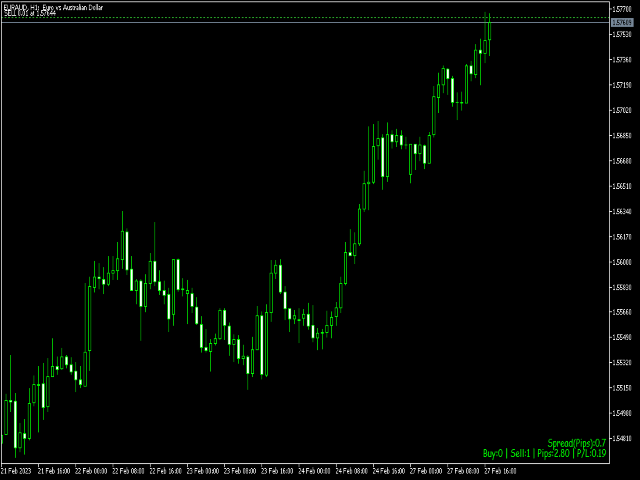
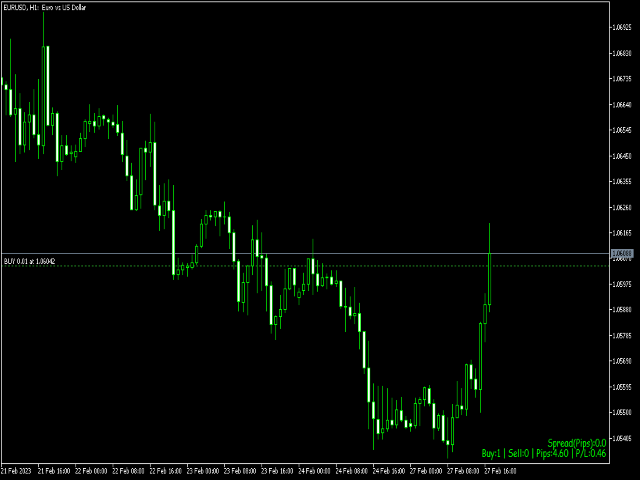


The Pipsometer is wonderful especially in doing that which it is made for and that is calculating pips and monetary value for an active trade(s). The only thing that can improve therein is the options of location positions for its display and the colour pallet (there is no choice for colour).