• Aperçu
  • Avis
  • Commentaires

DailyHLC

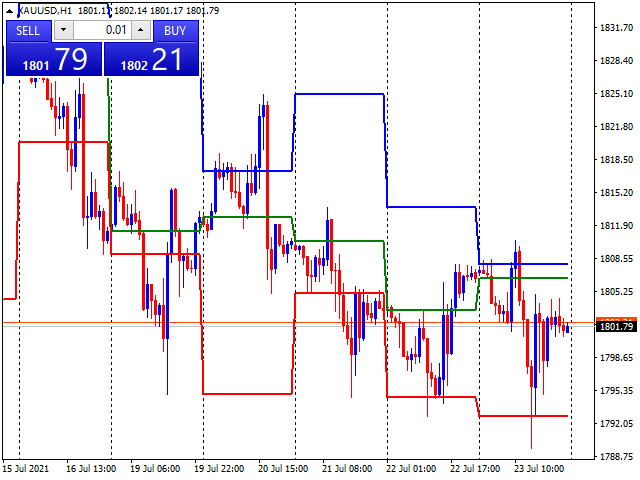
This indicator provides daily high, low and close values. You have to use H4 or lower timeframe to display levels. Every day shows previous day's high, low and close values as lines. The lines are updated at the beginning of the day and do not change in 24 hours period. You can use this indicator for breakout startegy or range trading. Like most indicators, it is recommed to use additional indicators to get accurate signals.
Produits recommandés
Automatic redrawing of Trend Supports and resistances levels and Possible Wedge pattern formation to indicate price breaking of Rising Wedge (signal SELL) or price breaking of falling Wedge (signal BUY) Very simple and smart indicator  ALERTS AND MOBILE NOTIFICATIONS availavle !!! you can edit the calculation bars of the bars count for formation of the trend lines and the initial shift from current price  Smaller values for bars /shift inputs when using Higher Time frames (D1-H4) and the reverse
VR Cub
Vladimir Pastushak
VR Cub est un indicateur permettant d'obtenir des points d'entrée de haute qualité. L'indicateur a été développé pour faciliter les calculs mathématiques et simplifier la recherche de points d'entrée dans un poste. La stratégie de trading pour laquelle l'indicateur a été rédigé prouve son efficacité depuis de nombreuses années. La simplicité de la stratégie de trading est son grand avantage, qui permet même aux traders débutants de négocier avec succès avec elle. VR Cub calcule les points d'ouve
The Penta-O is a 6-point retracement harmonacci pattern which usually precedes big market movements. Penta-O patterns can expand and repaint quite a bit. To make things easier this indicator implements a twist: it waits for a donchian breakout in the right direction before signaling the trade. The end result is an otherwise repainting indicator with a very reliable trading signal. The donchian breakout period is entered as an input. [ Installation Guide | Update Guide | Troubleshooting | FAQ | A
Real Magic Trend
Muhammed Emin Ugur
This   Real Magic Trend   indicator is designed for signal trading. This indicator generates trend signals. It uses many algorithms and indicators to generate this signal. It tries to generate signals from the points with the highest trend potential. This indicator is a complete trading product. This indicator does not need any additional indicators. The indicator is never repainted. The point at which the signal is given does not change.      Features and Recommendations Time Frame
Best indicator for trend reversals Can be optimized for crypto trading or all currency pairs How to use:When the arrow appears, wait for the candle to close and open the order Level lines appear when candle closes,  The system shows you the best entry levels It is simple and easy to use, no additional settings are required. Best indicator for beginners and professionals You can set the displayed stop loss and desired profit levels. You can use it alone or in addition to your strategy. Recommend
The   True Magic Oscillator   indicator is designed for signal trading. This indicator generates trend signals. It uses many algorithms and indicators to generate this signal. It tries to generate signals from the points with the highest trend potential. This indicator is a complete trading product. This indicator does not need any additional indicators. The indicator is never repainted. The point at which the signal is given does not change.         Features and Recommendations Wor
Monster Harmonic Indicator
Paul Geirnaerdt
4.59 (29)
Monster Harmonics Indicator is a harmonic pattern indicator. It recognizes Gartley, Bat, Crab, Butterfly, Cypher, White Swan, Black Swan, Shark and several other patterns. Projected patterns that are not yet completed are recognized, too. Monster even shows the PRZ (Potential Reversal Zone). Users can add their own user defined patterns to Monster. Besides the current pattern, Monster also shows all patterns in the symbols history. Monster will provide alerts for developing patterns. Introduced
Gvs Undefeated Trend   indicator is designed for trend and signal trading. This indicator generates trend signals.  It uses many algorithms and indicators to generate this signal. It tries to generate a signal from the points with the highest trend potential. This indicator is a complete trading product. This indicator does not need any additional indicators.  You can only trade with this indicator. The generated signals are displayed on the graphical screen.  Thanks to the alert features you ca
The new update makes this indicator a complete tool for studying, analyzing and operating probabilistic patterns. It includes: On-chart Multi-asset percentage monitor. Configurable martingales. Twenty-one pre-configured patterns , including Mhi patterns and C3. An advanced pattern editor to store up to 5 custom patterns. Backtest mode to test results with loss reports. Trend filter. Hit operational filter. Martingale Cycles option. Various types of strategies and alerts. Confluence between patte
To download MT5 version please click  here . This is the exact conversion from TradingView: "WaveTrend [LazyBear]" By "zeusuk3". One of the coolest indicators out there to detect overbought and oversold zones. It can be used as a part of more complicated strategy and for confirming a potential trade setup. There are buffers to use in EAs also. The indicator is loaded light and non-repaint. - You can message in private chat for further changes you need. Thanks for downloading 
The indicator allows you to trade binary options. The recommended time frame is М1 and the expiration time is 1,2,3 minutes. The indicator suitable for auto and manual trading. A possible signal is specified as a arrows above/under a candle. You should wait until the candle closes! Arrows are not re-painted Trade sessions: TOKYO section (Half-end) Currency pairs: USD/JPY Working time frame: M1 Expiration time: 1,2,3 minutes. The indicator also shows good results when using the martingale strateg
FREE
Gioteen Volatility Index (GVI)   - your ultimate solution to overcoming market unpredictability and maximizing trading opportunities. This revolutionary indicator helps you in lowering your losing trades due to choppy market movements. The GVI is designed to measure market volatility, providing you with valuable insights to identify the most favorable trading prospects. Its intuitive interface consists of a dynamic red line representing the volatility index, accompanied by blue line that indicat
ABCD Harmonic Patterns
Mehmet Ozhan Hastaoglu
Thanks to this indicator, you can easily see the new ABCD harmonic patterns in the chart. If the two price action lengths are equal, the system will give you a signal when it reaches the specified level. You can set the limits as you wish. For example, You can get the signal of the price, which occurs in the Fibonaci 38.2 and 88.6 retracements, and then moves for the same length, at the level you specify. For example, it will alarm you when the price reaches 80% as a percentage. In vertic
Elliott Wave Trend was designed for the scientific wave counting. This tool focuses to get rid of the vagueness of the classic Elliott Wave Counting using the guideline from the template and pattern approach. In doing so, firstly Elliott Wave Trend offers the template for your wave counting. Secondly, it offers Wave Structural Score to assist to identify accurate wave formation. It offers both impulse wave Structural Score and corrective wave Structure Score. Structural Score is the rating to sh
This indicator prepared by using 57 days moving averagr and least square method. It can only work for 1 hr time interval. Once a signal created. It is creating order and 2 limit orders. It works in CFD pairs as well as in Forex pairs. You can fins our other products from link : https://www.mql5.com/en/users/drbastem/seller Also, you can ask all your questins from email : haskayafx@gmail.com or mobile : +90 530 867 5076 or @MehmetBastem on telegram application This system is for Long term and pr
Noize Absorption Index MT4
Ekaterina Saltykova
5 (1)
Noize Absorption Index - is the manual trading system that measures the difference of pressure between bears forces and bulls forces. Green line - is a noize free index that showing curent situation. Zero value of index shows totally choppy/flat market.Values above zero level shows how powerfull bullish wave is and values below zero measures bearish forces.Up arrow appears on bearish market when it's ready to reverse, dn arrow appears on weak bullish market, as a result of reverse expectation. S
This is a new strategy for SUPPLY DEMAND areas It is based on a calculation using the tick volume to detect the big price action in market for both bear /bull actions this smart volume action candles are used to determine the supply and demand areas prices in between main supply and demand lines indicate sideway market  up arrows will be shown when prices moves above the main supply and the secondary supply lines Down arrows will be shown when prices moves below the main demand and the secondary
The CCI Divergence is a reasonably useful indicator in itself, but it is even more effective when used with divergence pattern trading. The CCI Divergence indicator signal is one of the most potent signals among the indicators that exist in the market. Here is new version for Divergence Indicator using CCI method, with more improvements. Divergences indicate a potential investment point because the directional moment does not confirm the price. A bullish divergence occurs when the underlying
The Th3Eng PipFinite indicator is based on a very excellent analysis of the right trend direction with perfect custom algorithms. It show the true direction and the best point to start trading. With StopLoss point and Three Take Profit points. Also it show the right pivot of the price and small points to order to replace the dynamic support and resistance channel, Which surrounds the price. And Finally it draws a very helpful Box on the left side on the chart includes (take profits and Stop loss
PERFECT Histogram This indicator is the PERFECT arrows indicator turned into a histogram indicator. Shop at the blue circle. Sell ​​to the red circle. The indicator is created for the M15 timeframe, first of all. Because it gives more frequent signals. One can trade several times a day using several currency pairs. Transactions are generally longer. Target profit can exceed 10 pips. Although I recommend for safety to be 10 pips. But it can be done depending on the situation. This ind
The principle of this indicator is very simple: detecting the trend with Moving Average, then monitoring the return point of graph by using the crossing of Stochastic Oscillator and finally predicting BUY and SELL signal with arrows, alerts and notifications. The parameters are fixed and automatically calculated on each time frame. Example: If you install indicator on EURUSD, timeframe M5: the indicator will detect the main trend with the Moving Average on this timeframe (for example the Moving
Every successful trader knows what support and resistance spots are working. And always know that these points need to be kept in mind. They always trade according to this point. The support and resistance point indicator operates in two different modes. The first is the standard support and resistance points we know. The second is Fibonacci levels. This indicator automatically calculates and displays the support and resistance points on the screen. Features You can select the time frame you w
Cosmic Diviner X Planet
Olena Kondratenko
4 (2)
This unique multi-currency strategy simultaneously determines the strength of trends and market entry points, visualizing this using histograms on the chart. The indicator is optimally adapted for trading on the timeframes М5, М15, М30, Н1. For the convenience of users, the indicator renders the entry point (in the form of an arrow), recommended take profit levels (TP1, TP2 with text labels) and the recommended Stop Loss level. The take profit levels (TP1, TP2) are automatically calculated for
Awesome Oscillator by Bill Williams with the ability to fine-tune and replace the averaging algorithms of the indicator, which significantly expands the possibilities of using this oscillator in algorithmic trading and brings it closer in its properties to such an indicator as the MACD. To reduce price noise, the final indicator is processed with an additional Smooth averaging. The indicator has the ability to give alerts, send mail messages and push signals when the direction of movement of th
Introduction to X3 Chart Pattern Scanner X3 Cherart Pattern Scanner is the non-repainting and non-lagging indicator detecting X3 chart patterns including Harmonic pattern, Elliott Wave pattern, X3 patterns, and Japanese Candlestick patterns. Historical patterns match with signal patterns. Hence, you can readily develop the solid trading strategy in your chart. More importantly, this superb pattern scanner can detect the optimal pattern of its kind. In addition, you can switch on and off individu
KT Horizontal Lines MT4
KEENBASE SOFTWARE SOLUTIONS
In MetaTrader, plotting multiple   horizontal lines   and then tracking their respective price levels can be a hassle. This indicator automatically plots multiple horizontal lines at equal intervals for setting price alerts, plotting support and resistance levels, and other manual purposes. This indicator is suitable for Forex traders who are new and looking for chances to make quick profits from buying and selling. Horizontal lines can help traders find possible areas to start trading when the
The indicator helps to identify possible rollbacks and reversals. Shows the direction of the price movement and is painted in the appropriate color. Allows you to conduct trend and counter trend trading It works on all timeframes, on any currency pairs, metals and cryptocurrency Can be used when working with binary options Distinctive features Does not redraw; Simple and clear settings; It works on all timeframes and on all symbols; Suitable for trading currencies, metals, options and cryptocurr
Gartley Projection D
Oleksandr Medviediev
3.71 (7)
The indicator identifies the harmonic patterns (XABCD) according to developments of H.M.Gartley ( "Profits in the Stock Market" , 1935г). It projects D-point as a point in the perspective projection (specify ProjectionD_Mode = true in the settings). Does not redraw. When a bar of the working timeframe closes, if the identified pattern point has not moved during Patterns_Fractal_Bars bars, an arrow appears on the chart (in the direction of the expected price movement). From this moment on, the ar
Extremum Reverse Bar
Yurij Izyumov
2.8 (5)
This indicator has been created for finding the probable reversal points of the symbol price. A small candlestick reversal pattern is used it its operation in conjunction with a filter of extremums. The indicator is not redrawn! If the extremum filter is disabled, the indicator shows all points that have a pattern. If the extremum filter is enabled, the condition works – if the history Previous bars 1 candles back contains higher candles and they are farther than the Previous bars 2 candle, such
FREE
Introduction to Harmonic Volatility Indicator Harmonic Volatility Indicator is the first technical analysis applying the Fibonacci analysis to the financial volatility. Harmonic volatility indicator is another level of price action trading tool, which combines robust Fibonacci ratios (0.618, 0.382, etc.) with volatility. Originally, Harmonic Volatility Indicator was developed to overcome the limitation and the weakness of Gann’s Angle, also known as Gann’s Fan. We have demonstrated that Harmonic
Les acheteurs de ce produit ont également acheté
Gann Made Easy
Oleg Rodin
4.85 (81)
Gann Made Easy est un système de trading Forex professionnel et facile à utiliser qui est basé sur les meilleurs principes de trading en utilisant la théorie de mr. WD Gann. L'indicateur fournit des signaux d'ACHAT et de VENTE précis, y compris les niveaux Stop Loss et Take Profit. Vous pouvez échanger même en déplacement en utilisant les notifications PUSH. S'il vous plaît contactez-moi après l'achat! Je partagerai avec vous mes astuces de trading et d'excellents indicateurs bonus gratuitement!
TPSpro RFI Levels
Roman Podpora
4.82 (22)
Reversal First Impulse levels (RFI)    INSTRUCTIONS        RUS       -       ENG              R ecommended to use with an indicator   -   TPSpro  TREND PRO -  Version MT5 A key element in trading is zones or levels from which decisions to buy or sell a trading instrument are made. Despite attempts by major players to conceal their presence in the market, they inevitably leave traces. Our task was to learn how to identify these traces and interpret them correctly. Main functions: Displaying activ
Atomic Analyst
Issam Kassas
5 (2)
Tout d'abord, il convient de souligner que cet indicateur de trading n'est ni repainting, ni redrawing et ne présente aucun délai, ce qui le rend idéal à la fois pour le trading manuel et automatisé. Manuel de l'utilisateur : réglages, entrées et stratégie. L'Analyste Atomique est un indicateur d'action sur les prix PA qui utilise la force et le momentum du prix pour trouver un meilleur avantage sur le marché. Équipé de filtres avancés qui aident à éliminer les bruits et les faux signaux, et à
Gold Stuff
Vasiliy Strukov
4.89 (238)
Gold Stuff est un indicateur de tendance conçu spécifiquement pour l'or et peut également être utilisé sur n'importe quel instrument financier. L'indicateur ne se redessine pas et ne traîne pas. Délai recommandé H1. Au niveau de l'indicateur de travail, l'Expert Advisor EA Gold Stuff est entièrement automatique. Vous pouvez le trouver sur mon profil. Vous pouvez obtenir une copie gratuite de notre indicateur Strong Support et Trend Scanner, veuillez envoyer un message privé. moi! Contactez
Trend Punch
Mohamed Hassan
4.95 (19)
This indicator is unstoppable when combined with our other indicator called  Support & Resistance . After purchase, send us a message and you will get it   for  FREE as a BONUS! Introducing Trend Punch , the revolutionary forex trend indicator that will transform the way you trade! Trend Punch is uniquely designed to provide precise buy and sell arrows during strong market trends, making your trading decisions clearer and more confident. Whether you're trading major currency pairs or exotic sym
Actuellement 20% de réduction ! La meilleure solution pour tout débutant ou trader expert ! Ce logiciel de tableau de bord fonctionne sur 28 paires de devises. Il est basé sur 2 de nos principaux indicateurs (Advanced Currency Strength 28 et Advanced Currency Impulse). Il donne un excellent aperçu de l'ensemble du marché Forex. Il montre les valeurs de l'Advanced Currency Strength, la vitesse de mouvement des devises et les signaux pour 28 paires de devises dans tous les (9) délais. Imagine
TPSproTREND PrO
Roman Podpora
4.79 (19)
TPSpro TREND PRO   est un indicateur de tendance qui analyse automatiquement le marché et fournit des informations sur la tendance et chacun de ses changements, ainsi que des signaux pour entrer dans des transactions sans redessiner ! L'indicateur utilise chaque bougie et les analyse séparément. faisant référence à différentes impulsions - impulsion ascendante ou descendante. Points d'entrée précis dans les transactions sur les devises, les crypto-monnaies, les métaux, les actions, les indices 
Scalper Inside PRO
Alexey Minkov
4.73 (56)
An exclusive indicator that utilizes an innovative algorithm to swiftly and accurately determine the market trend. The indicator automatically calculates opening, closing, and profit levels, providing detailed trading statistics. With these features, you can choose the most appropriate trading instrument for the current market conditions. Additionally, you can easily integrate your own arrow indicators into Scalper Inside Pro to quickly evaluate their statistics and profitability. Scalper Inside
- Real price is 80$ - 40% Discount ( It is 49$ now ) Contact me for instruction, add group and any questions! Related EA Product: Bitcoin Expert Introduction The breakout and retest strategy is traded support and resistance levels. it involves price breaking through a previous level.  The break and retest strategy is designed to help traders do two main things, the first is to avoid false breakouts. Many false breakouts start with a candlestick that breaks out of a level but ends with an immedi
Trend Screener
STE S.S.COMPANY
4.8 (87)
Indicateur de tendance, solution unique révolutionnaire pour le trading et le filtrage des tendances avec toutes les fonctionnalités de tendance importantes intégrées dans un seul outil ! Il s'agit d'un indicateur multi-période et multi-devises 100 % non repeint qui peut être utilisé sur tous les symboles/instruments : forex, matières premières, crypto-monnaies, indices et actions. OFFRE À DURÉE LIMITÉE : L'indicateur Support and Resistance Screener est disponible pour seulement 50 $ et à vie. (
FX Power MT4 NG
Daniel Stein
5 (12)
Obtenez votre mise à jour quotidienne du marché avec des détails et des captures d'écran via notre Morning Briefing ici sur mql5 et sur Telegram ! FX Power MT4 NG est la nouvelle génération de notre très populaire indicateur de force des devises, FX Power. Et qu'est-ce que ce compteur de force de nouvelle génération offre ? Tout ce que vous avez aimé de l'original FX Power PLUS Analyse de la force de l'OR/XAU Des résultats de calcul encore plus précis Périodes d'analyse configurables individuel
FX Volume
Daniel Stein
4.58 (33)
Obtenez votre mise à jour quotidienne du marché avec des détails et des captures d'écran via notre Morning Briefing ici sur mql5 et sur Telegram ! FX Volume est le PREMIER et SEUL indicateur de volume qui fournit un VRAI aperçu du sentiment du marché du point de vue d'un courtier. Il fournit des informations impressionnantes sur la façon dont les acteurs institutionnels du marché, comme les courtiers, sont positionnés sur le marché des changes, bien plus rapidement que les rapports COT. Voir c
ACTUELLEMENT 31% DE RÉDUCTION ! ! La meilleure solution pour tout débutant ou Expert Trader ! Cet indicateur est un outil de trading unique, de haute qualité et abordable car nous avons incorporé un certain nombre de caractéristiques exclusives et une formule secrète. Avec seulement UN graphique, il donne des alertes pour les 28 paires de devises. Imaginez comment votre trading s'améliorera parce que vous serez capable de repérer le point de déclenchement exact d'une nouvelle tendance ou d'
Enigmera
Ivan Stefanov
5 (3)
ENIGMERA : Le cœur du marché https://www.enigmera.com Introduction Cet indicateur et ce système de trading constituent une approche remarquable des marchés financiers. ENIGMERA utilise les cycles fractals pour calculer avec précision les niveaux de support et de résistance. Il indique la phase d'accumulation authentique et donne une direction et des objectifs.  Un système qui fonctionne que nous soyons dans une tendance ou une correction.  Comment fonctionne-t-il ? ENIGMERA comprend trois l
This indicator is based on the Gann Signal indicator and acts as a market scanner. All you need to do is fill in the selected currency pairs in the settings and that’s it. Next, the indicator itself will view all these currency pairs and time frames from M5 to D1 simultaneously. When a new signal appears, the indicator will give you an Alert and also draw the letter N where this new signal will be.
Le système PRO Renko est un système de trading très précis spécialement conçu pour le trading de graphiques RENKO. Il s'agit d'un système universel qui peut être appliqué à divers instruments de négociation. Le système neutralise efficacement ce qu'on appelle le bruit du marché en vous donnant accès à des signaux d'inversion précis. L'indicateur est très facile à utiliser et n'a qu'un seul paramètre responsable de la génération du signal. Vous pouvez facilement adapter l'outil à n'importe q
Le profit de la structure du marché change à mesure que le prix s'inverse et recule. L'indicateur d'alerte d'inversion de la structure du marché identifie le moment où une tendance ou un mouvement de prix approche de l'épuisement et est prêt à s'inverser. Il vous avertit des changements dans la structure du marché qui se produisent généralement lorsqu'un renversement ou un recul majeur est sur le point de se produire. L'indicateur identifie initialement les cassures et la dynamique des prix,
ACTUELLEMENT 26% DE RÉDUCTION La meilleure solution pour tout débutant ou trader expert ! Cet indicateur est un outil de trading unique, de haute qualité et abordable car nous avons incorporé un certain nombre de caractéristiques exclusives et une nouvelle formule. Avec seulement UN graphique, vous pouvez lire la force de la devise pour 28 paires Forex ! Imaginez comment votre trading va s'améliorer parce que vous êtes capable de repérer le point de déclenchement exact d'une nouvelle tendan
Currency Strength Exotics
Bernhard Schweigert
4.87 (30)
ACTUELLEMENT 20% DE RÉDUCTION ! La meilleure solution pour tout débutant ou trader expert ! Cet indicateur est spécialisé pour montrer la force de la devise pour tous les symboles comme les paires exotiques, les matières premières, les indices ou les contrats à terme. C'est le premier de son genre, n'importe quel symbole peut être ajouté à la 9ème ligne pour montrer la force réelle de la devise de l'or, l'argent, le pétrole, DAX, US30, MXN, TRY, CNH etc. Il s'agit d'un outil de trading uniq
Currency Strength Wizard est un indicateur très puissant qui vous offre une solution tout-en-un pour un trading réussi. L'indicateur calcule la puissance de telle ou telle paire de devises en utilisant les données de toutes les devises sur plusieurs périodes. Ces données sont représentées sous la forme d'un indice de devise facile à utiliser et de lignes électriques de devise que vous pouvez utiliser pour voir la puissance de telle ou telle devise. Tout ce dont vous avez besoin est d'attacher l'
TakePropips Donchian Trend Pro
Eric John Pajarillaga Aldana
4.44 (16)
TakePropips Donchian Trend Pro   (MT4) est un outil puissant et efficace qui détecte automatiquement la direction de la tendance à l'aide du canal Donchian et vous fournit des signaux de trading d'entrée et de sortie ! Cet indicateur multifonction comprend un scanner de tendance, des signaux de trading, un panneau statistique, un filtre, des sessions de trading et un tableau de bord de l'historique des alertes. Il est conçu pour vous fournir des signaux de trading et vous faire gagner des heures
Dessine automatiquement les niveaux de support et de résistance PLUS les écarts des bougies de propulsion sur votre graphique, afin que vous puissiez voir où le prix est susceptible de se diriger ensuite et/ou de s'inverser potentiellement. Cet indicateur est conçu pour être utilisé dans le cadre de la méthodologie de trading de position enseignée sur mon site web (The Market Structure Trader) et affiche des informations clés pour le ciblage et les entrées potentielles. L'indicateur comport
Bomb Bank Signal
Igor Pereira Calil
5 (1)
Signal Bomb Bank : votre indicateur de confiance dans MetaTrader 4 Bomb Bank Signal est un indicateur puissant pour MetaTrader 4, conçu pour identifier les tendances les plus pertinentes du marché financier. Si vous recherchez un outil qui anticipe avec précision les mouvements, la Bomb Bank est l’alliée qu’il vous faut. Comment ça marche : Cet indicateur combine trois méthodes distinctes – analyse de volume, clôture de bougie et tendance symétrique – pour détecter et signaler les opportu
Trend Cutter
Oleg Rodin
5 (2)
Trend Cutter est un indicateur de tendance qui peut être utilisé avec n'importe quelle période, y compris les périodes inférieures comme M1 et M5. L'indicateur est idéal pour les traders qui préfèrent le trading intrajournalier et sera également utile à ceux qui préfèrent le trading à long terme. Vous pouvez utiliser cet indicateur comme base pour votre système de trading ou comme solution de trading autonome. L'indicateur fournit tous les types d'alertes, y compris les notifications PUSH. L'ind
L'indicateur d'inversion ADR vous montre en un coup d'œil où le prix se négocie actuellement par rapport à sa fourchette quotidienne moyenne normale. Vous recevrez des alertes instantanées par pop-up, e-mail ou push lorsque le prix dépasse sa fourchette moyenne et les niveaux supérieurs de votre choix afin que vous puissiez sauter rapidement dans les reculs et les inversions. L'indicateur trace des lignes horizontales sur le graphique aux extrêmes de la fourchette quotidienne moyenne ainsi que
IX Power MT4
Daniel Stein
5 (5)
IX Power apporte enfin la précision imbattable de FX Power aux symboles non-Forex. Il détermine avec précision l'intensité des tendances à court, moyen et long terme de vos indices, actions, matières premières, ETF et même crypto-monnaies préférés. Vous pouvez analyser tout ce que votre terminal a à offrir. Essayez-le et découvrez comment votre timing s'améliore considérablement lors de vos transactions. Caractéristiques principales d'IX Power Résultats de calcul précis à 100 %, sans ré
Trend Pulse
Mohamed Hassan
5 (4)
Please contact me after purchase to immediately get your PDF strategy + documentation for Trend Pulse !  Introducing Trend Pulse , a unique and robust indicator capable of detecting bullish, bearish, and even ranging trends! Trend Pulse uses a special algorithm to filter out market noise with real precision. If the current symbol is moving sideways, Trend Pulse will send you a ranging signal, letting you know that it's not a good time to enter a trade. This excellent system makes Trend Pulse
Order Block Hunter
Noha Mohamed Fathy Younes Badr
5 (4)
Order block hunter indicator is the best indicator for  hunt the order blocks that area where there has been a large concentration of limit orders waiting to be executed Order blocks are identified on a chart by observing previous price action and looking for areas where the price experienced significant movement or sudden changes in direction .This indicator does that for you by using very complicated codes and helps you to take the best areas To buy and sell because it make marks at the best a
Stratos Pali Indicator   is a revolutionary tool designed to enhance your trading strategy by accurately identifying market trends. This sophisticated indicator uses a unique algorithm to generate a complete histogram, which records when the trend is Long or Short. When a trend reversal occurs, an arrow appears, indicating the new direction of the trend. Important Information Revealed Leave a review and contact me via mql5 message to receive My Top 5 set files for Stratos Pali at no cost! D
Le tableau de bord d'alerte RSI / TDI vous permet de surveiller les RSI à la fois (sélectionnables par vous) sur chaque paire majeure que vous négociez. Vous pouvez l'utiliser de deux manières : 1. Sélectionnez plusieurs périodes et le tiret vous montrera quand il y a plusieurs périodes prolongées au-delà des conditions commerciales normales. Un excellent indicateur que le prix a poussé fort récemment, car il a atteint un niveau de surachat ou de survente sur plusieurs périodes, de sorte
Filtrer:
Aucun avis
Répondre à l'avis