Intermarket Indicator for Daytrading Eurusd
- Indicateurs
- GEORGIOS VERGAKIS
- Version: 1.0
- Activations: 5
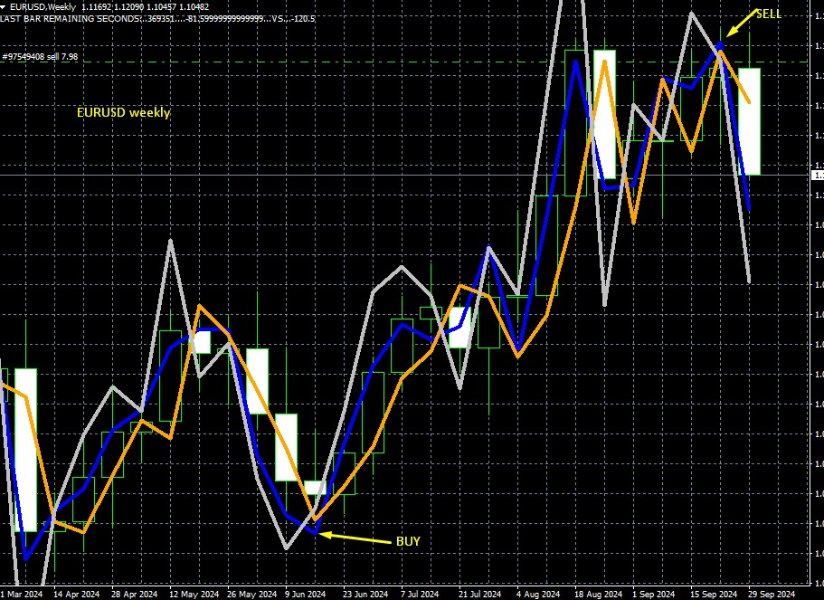
This indicator is suitable only for previous users, who can make use of slightly different strategy now, using this and one more indicator on weekly chart and achieve very good profitability on EURUSD. It's a serious indicator suitable for hedge funds and large size slow trading. Even though it was originally used for day trading but with no as good resutls as on the weekly chart. Ideally it is suitable for mature users, who want to trade at large size, and are patient enough to detect those signals. We notice that young traders tend to completely misuse indicators and attempt to do overexposed day trading, only to blow their accounts. On the contrary, our best indicators work very well on the weekly chart, on rare signals, where each trade lasts several days to few weeks, the trend is right, and we get all the overnight action as well.
For use on the Weekly chart, for detecting any big signals, please set 'formula period' input to ZERO. We will provide the strategy and details
on the benefits and limitations.
This indicator is a former experimental indicator for EURUSD, which has been modified so as to look at multiple price bars as if they are one single bar. For example the default Period value is 13, this makes the indicator run from bar zero (latest price bar), all the way back to bar 13, and take into account the open at bar 13, the maximum and minimum values in that range, as high and low, and the latest market price as the Close. In effect, even when the trader uses this value on a 5min chart, they are really looking at a 5min*14=70min chart.
This makes the indicator much more insightful, and avoids all the noise and nonsense at the beginning of the new bar, since the running period never makes a complete discrete step, rather it makes a smooth transition from bar to bar.
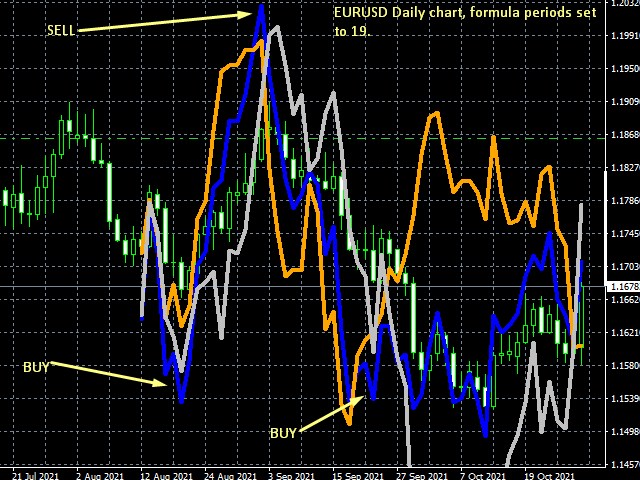
Few new patterns are also observed and are under study, and also the setting of Periods set to 19 on the daily chart, which seems to reveal
the major market trend, but has a slack of few days. ie predicts what's to come over the coming 10 days or longer, but not the next 1-2 days.
All these patterns are interesting and under study.
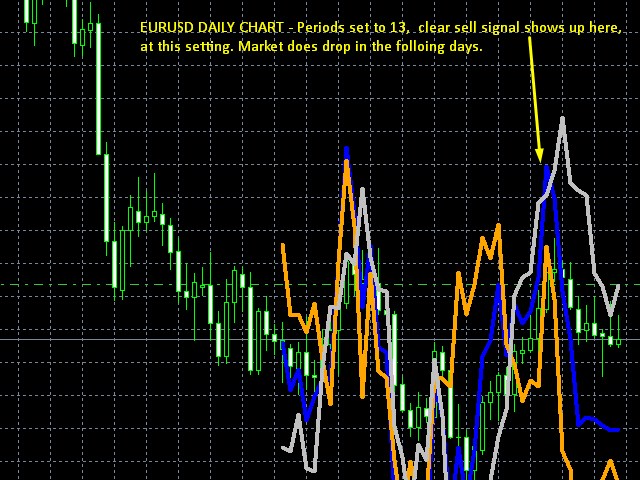
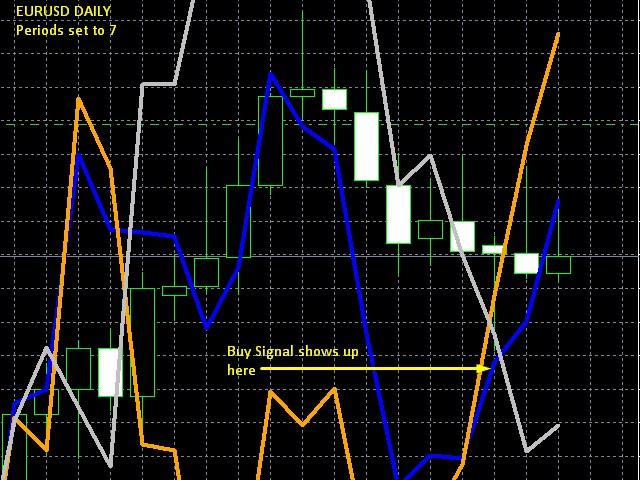
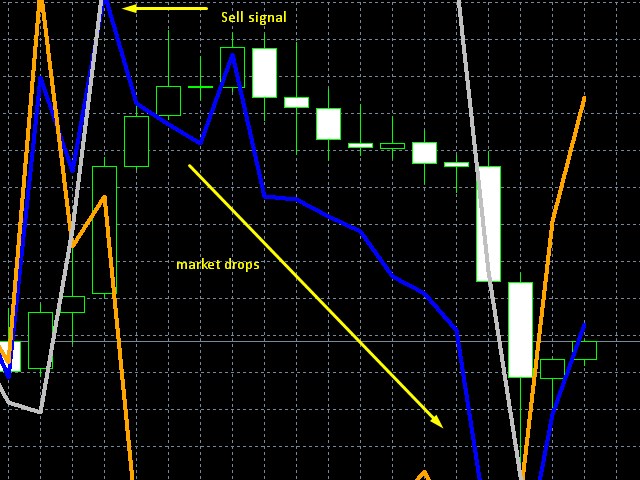
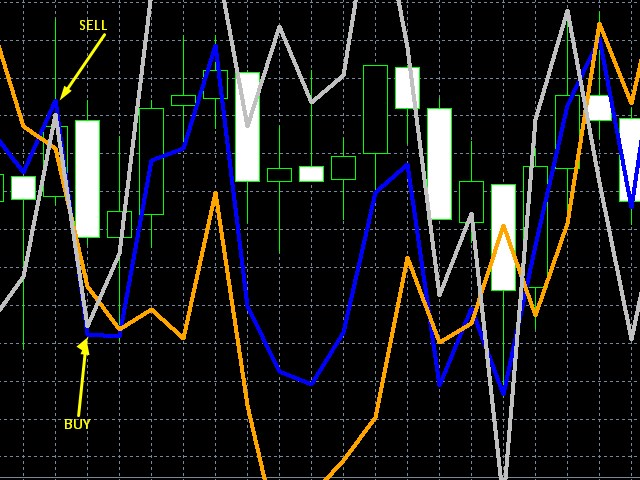
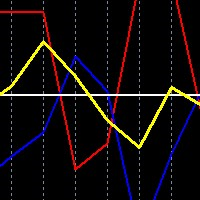
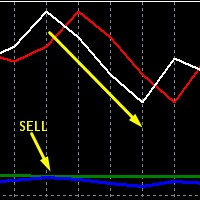
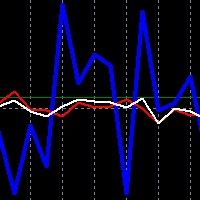
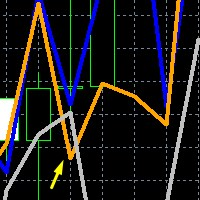
This indicator reveals many more hidden signals, however you have to scan the chart for various values of the Period setting beteeen 0 and 13 (and sometimes to 19 for the daily chart), rarely a market movement will be fully detected from entry to exit, on the same setting. In the pictures you can see a clear sell signal on the daily chart which appeared for Period set to 13, not visible on any other value, the market dropped, then a buy signal showed up for Period set to 7.
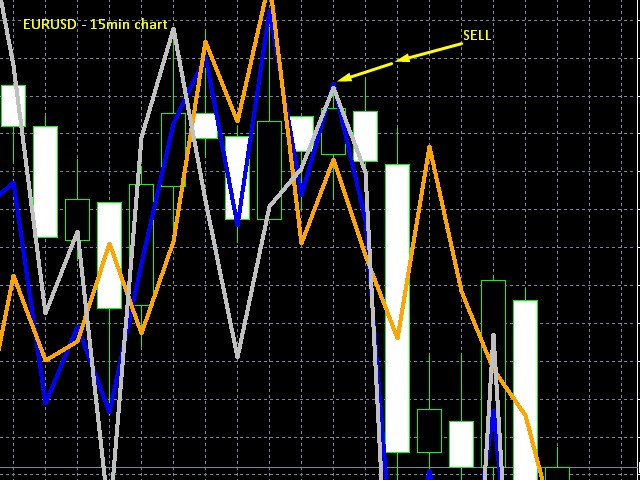
It works the same way on the 5min chart, for day trading, though we don't keep changing the Period setting too often, rather we use a fix setting and just switch between 5min and 15min charts, and even 30min charts to detect these blueline patterns.
In any case, this is not a magical indicator, that makes profitable trading very easy to do, all it does is keep trading on the safe side by avoiding many adverse moves in the market.
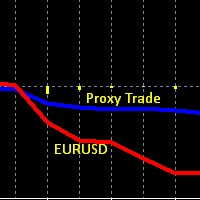
The cool thing is that this indicator takes data from 6 currency pairs, to work out where EURUSD stands relative to those other pairs, and that's why it produces signals that are impossible to find on a naked EURUSD chart. I have been in the markets for 21 years now, and most popular indiators don't work. never did. Only one type of swing trading analysis works on the daily chart, anything else published on books and courses is about Fibonacci and trendlines and patterns, which seem to work because they appear somehow right, no matter what the market does. But have zero predictive power.
Please ask me for detailed information on how to use this indicator (it works on both day trading and longer term analysis by setting different
input number on the Fomula Period variable (Set Formula Periods to 0 for analying the daily trend and look for blue line divergences which are very
strong buy/sell signals, as well as grey line gaps). Set it back to 13 or other number for day trading, always keep Plot periods > Formula periods.
Only two patterns have been verified on this indicator, there are 2 more patterns being tested, and it is also possible to later make it work
so as to perform multi time frame scans, even though the user only deploys it on the 5min chart. This takes a lot of work to do, and it will be
according to users' request, some user may require pop up alerts, while another user may require visual, on chart signals.
#eurusd, #slow trading, #high probability
