• Aperçu
  • Avis (2)
  • Commentaires
  • Nouveautés

BopCoiote

5

O Indicador BOPCoiote é uma releitura do indicador Balance of Power proposto por Igor Livshin em Agosto de 2001, publicado na Stocks and Commodities Magazine.

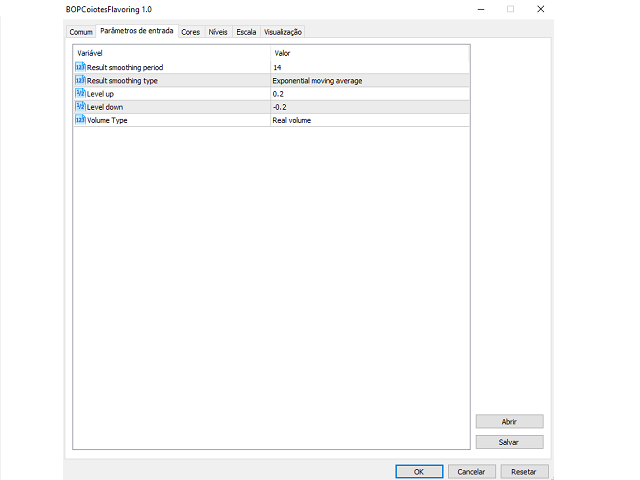
Uma média móvel de 14 períodos é recomendada para gráficos diários. Embora o número de períodos possa variar dependendo da natureza do mercado e dos prazos.
O nível em que ele agrupa seus fundos e topos é considerado uma das propriedades mais importantes do indicador BOP.
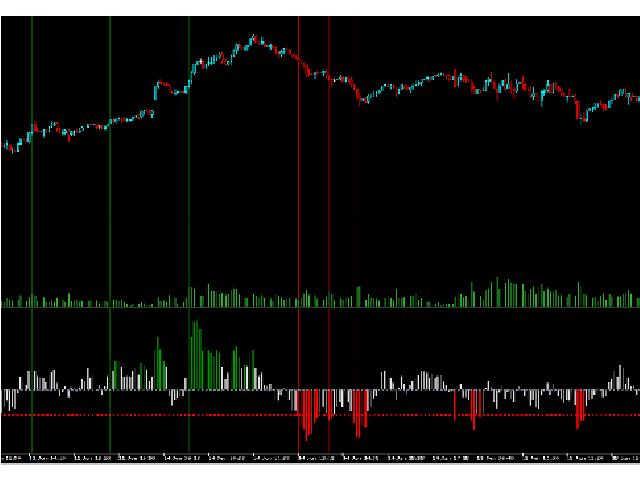
Durante as tendências de alta, suas máximas frequentemente tocam os limites superiores e nunca voltam ao nível inferior e a situação se inverte durante a tendência de baixa.
O indicador BOP auxilia os níveis de sobrecompra / sobrevenda, tendências e divergências de preços.
Os comerciantes tomam uma mudança na tendência do BOP como um aviso e é aconselhável confirmar por uma mudança na direção do preço.

A presença do indicador BOP acima da Linha Zero indica um sentimento positivo do mercado com os touros no poder.
O movimento do BOP abaixo da Linha Zero mostra que os ursos têm o poder.
Este é o principal princípio por trás do funcionamento do indicador BOP.
O funcionamento do BOP é interessante no sentido de que rastreia milagrosamente as condições do mercado em tempo real.

O indicador Balance of Power clássico possui a formulação abaixo:
Balance of Power (BOP) = (CLOSING PRICE – OPENING PRICE) / (HIGH PRICE – LOW PRICE)

O Indicador BOPCoiote considera níveis de volume presentes no mercado para atribuir o interesse do movimento.

https://www.mql5.com/en/charts/14140002/win-m5-genial-investimentos-corretora


Avis 2
hernannfx
37
hernannfx 2022.12.23 03:56 
 

Muito Bom, acertivo e intuitivo !

Produits recommandés
Value Chart Candlesticks
Flavio Javier Jarabeck
4.67 (9)
The idea of a Value Chart indicator was presented in the very good book I read back in 2020 , " Dynamic Trading Indicators: Winning with Value Charts and Price Action Profile ", from the authors Mark Helweg and David Stendahl. The idea is simple and the result is pure genius: Present candlestick Price analysis in a detrended way! HOW TO READ THIS INDICATOR Look for Overbought and Oversold levels. Of course, you will need to test the settings a lot to find the "correct" one for your approach.
FREE
Donchian Pro
Paulo Henrique Faquineli Garcia
5 (2)
The Donchian Channel Channels are among the most popular tools of technical analysis, as they visually convey to the analyst the limits within which most price movement tends to occur. Channel users know that valuable information can be obtained at any time, whether prices are in the central region of a band or close to one of the border lines. One of the best known techniques to explore these concepts is Bollinger Bands. However, John Bollinger was not the only one to research the applicatio
FREE
PZ Penta O MT5
PZ TRADING SLU
4 (6)
The Penta-O is a 6-point retracement harmonacci pattern which usually precedes big market movements. Penta-O patterns can expand and repaint quite a bit. To make things easier this indicator implements a twist: it waits for a donchian breakout in the right direction before signaling the trade. The end result is an otherwise repainting indicator with a very reliable trading signal. The donchian breakout period is entered as an input. [ Installation Guide | Update Guide | Troubleshooting | FAQ | A
FREE
PZ Fibonacci MT5
PZ TRADING SLU
4.63 (16)
Are you tired of plotting Fibonacci retracements or extensions manually? This indicator displays Fibo retracements or extensions automatically, calculated from two different price points, without human intervention or manual object anchoring. [ Installation Guide | Update Guide | Troubleshooting | FAQ | All Products ] Easy to use Manual anchoring is not needed Perfect for price confluence studies The indicator evaluates if retracements or extensions are needed Once drawn, you can manually edit t
FREE
FRB Support and Resistance
Fernando Baratieri
5 (2)
FRB Trader - Our mission is to provide the best support to customers through conted and tools so that they can achieve the expected results FRB Support and Resistance - Indicator places lines on the chart to show Support and Resistance regions. - You can choose the timeframe you want to calculate, as well as the colors of the lines. - Algorithm calculates the points where the strengths of the asset are considered and are extremely important for decision making.
FREE
Free automatic Fibonacci is an indicator that automatically plots a Fibonacci retracement based on the number of bars you select on the BarsToScan setting in the indicator. The Fibonacci is automatically updated in real time as new highest and lowest values appears amongst the selected bars. You can select which level values to be displayed in the indicator settings. You can also select the color of the levels thus enabling the trader to be able to attach the indicator several times with differe
FREE
"Hunttern harmonic pattern finder" base on the dynamic zigzag with the notification and prediction mode This version of the indicator identifies 11 harmonic patterns and predicts them in real-time before they are completely formed. It offers the ability to calculate the error rate of Zigzag patterns depending on a risk threshold. It moreover sends out a notification once the pattern is complete. The supported patterns: ABCD BAT ALT BAT BUTTERFLY GARTLEY CRAB DEEP CRAB CYPHER SHARK THREE
FREE
Are you tired of drawing trendlines every time you're analyzing charts? Or perhaps you would like more consistency in your technical analysis. Then this is for you. This indicator will draw trend lines automatically when dropped on a chart. How it works Works similar to standard deviation channel found on mt4 and mt5. It has 2 parameters: 1. Starting Bar 2. Number of bars for calculation The   starting bar   is the bar which drawing of the trend lines will begin, while the   number of bars for c
FREE
Le Capteur de Tendance : La Stratégie du Capteur de Tendance avec Indicateur d'Alerte est un outil d'analyse technique polyvalent qui aide les traders à identifier les tendances du marché et les points d'entrée et de sortie potentiels. Elle présente une stratégie dynamique de Capteur de Tendance, s'adaptant aux conditions du marché pour une représentation visuelle claire de la direction de la tendance. Les traders peuvent personnaliser les paramètres selon leurs préférences et leur tolérance
FREE
L'indicateur construit les cotations actuelles, qui peuvent être comparées aux cotations historiques et, sur cette base, faire une prévision de l'évolution des prix. L'indicateur dispose d'un champ de texte pour une navigation rapide jusqu'à la date souhaitée. Option : Symbole - sélection du symbole que l'indicateur affichera ; SymbolPeriod - sélection de la période à partir de laquelle l'indicateur prendra des données ; IndicatorColor - couleur de l'indicateur ; HorisontalShift -
Aggression Volume
Flavio Javier Jarabeck
3.86 (21)
Aggression Volume Indicator is the kind of indicator that is rarely found in the MQL5 community because it is not based on the standard Volume data provided by the Metatrader 5 platform. It requires the scrutiny of all traffic Ticks requested on the platform... That said, Aggression Volume indicator requests all Tick Data from your Broker and processes it to build a very special version of a Volume Indicator, where Buyers and Sellers aggressions are plotted in a form of Histogram. Additionally,
FREE
BoxProfile MT5
Evgeny Shevtsov
4.56 (9)
The indicator displays volume profiles based on the nesting principle. Profiles periods are pre-set so that each subsequent profile has a length twice as long as the length of the previous profile. In addition to profiles, the indicator displays volume clusters sorted by color, depending on the volume they contain. Indicator operation features The indicator works on typical timeframes from M5 to MN, but for calculations uses historical data from smaller timeframes: M1 - for timeframes from M5
FREE
High Low Open Close
Alexandre Borela
4.97 (39)
Si vous aimez ce projet, laissez un examen 5 étoiles. Suivre l'instagram: borelatech Cet indicateur tire les prix ouverts, élevés, bas et de fermeture pour les prix spécifiés période et il peut être ajusté pour un fuseau horaire spécifique. Il s ' agit là d ' un niveau important qui s ' intéresse à de nombreux domaines institutionnels et professionnels. traders et peut être utile pour vous de connaître les endroits où ils pourraient être plus active. Les périodes disponibles sont les su
FREE
Pivot Point Fibo RSJ est un indicateur qui trace les lignes de support et de résistance de la journée en utilisant les taux de Fibonacci. Cet indicateur spectaculaire crée jusqu'à 7 niveaux de support et de résistance via Pivot Point en utilisant les taux de Fibonacci. C'est fantastique de voir comment les prix respectent chaque niveau de ce support et de cette résistance, où il est possible de percevoir les points d'entrée/sortie possibles d'une opération. Caractéristiques Jusqu'à 7 nive
FREE
Weis Waves
Flavio Javier Jarabeck
3.15 (26)
The original author is David Weis, an expert in the Wyckoff Method. The Weis Wave is a modern adaptation of the 1930's Wyckoff Method, another expert in Tape Reading techniques and Chart Analysis. Weis Waves takes market volume and stacks it into waves according to price conditions giving the trader valuable insights about the market conditions. If you want to learn more about this subject you can find tons of videos in YouTube. Just look for "The Wickoff Method", "Weis Wave" and "Volume Spread
FREE
BoxInside MT5
Evgeny Shevtsov
5 (4)
This indicator calculates the volume profile and places labels that correspond to the VAH, VAL and POC levels, for each candle individually. Indicator operation features The indicator works on the timeframes from M3 to MN, but it uses the history data of smaller periods: M1 - for periods from M3 to H1, M5 - for periods from H2 to H12, M30 - for the D1 period, H4 - for the W1 period, D1 - for the MN period. The color and location of the VAL, VAH and POC labels on the current candle are consider
FREE
Follow The Line MT5
Oliver Gideon Amofa Appiah
4.42 (31)
This indicator obeys the popular maxim that: "THE TREND IS YOUR FRIEND" It paints a GREEN line for BUY and also paints a RED line for SELL. (you can change the colors). It gives alarms and alerts of all kinds. IT DOES NOT REPAINT and can be used for all currency pairs and timeframes. Yes, as easy and simple as that. Even a newbie can use it to make great and reliable trades. NB: For best results, get my other premium indicators for more powerful and reliable signals. Get them here: https://www.m
FREE
DALA Forecast
Grigorii Matsnev
About the indicator: DALA Forecast is a universal tool for predicting the dynamics of time series of any nature. For prediction, modified methods of nonlinear dynamics analysis are used, on the basis of which a predictive model is built using machine learning methods.  To get the trial version of the indicator, you can contact me in private messages. How to use the indicator: Apply the indicator to your chosen financial instrument or indicator with the settings you need. The prediction will b
FREE
VWAP Volume And Price is the indicator for Volume Weighted Average Price, designed according to regular calculation. The average price is calculated using typical price - (high + low + close) / 3 - and weighted by volume for each candle. So, the indicator can be used to trend trades, balanced with volume. Try other products and expert advisors too. Any doubt, PM.
WT String2Signal
Ricardo Almeida Branco
Easily convert your candlestick patterns into signals! Eval - Command interpreter - Command line interface - String converter - Customizable sign   I bring one more indicator that was requested by a real trader. Thanks for the suggestion mate! The String2Signal indicator will allow you to write your candlestick patterns and get the signals on the screen, integrating with EAs or using it to assist in manual operations. You type a text with your setup and the indicator converts it into the MQ
Forex Indicator Arrows
NGUYEN NGHIEM DUY
1 (1)
Forex Indicator Arrows is an arrow Indicator used as an assistant tool for your trading strategy. The indicator analyzes the standard deviation of bar close for a given period and generates a buy or sell signals if the deviation increases. It good to combo with Martingale EA to follow Trend and Sellect Buy Only/Sell Only for EA work Semi-Automatic. You can use this  Indicator with any EAs in my Products.
FREE
Cumulative Delta MT5
Evgeny Shevtsov
4.5 (60)
The indicator analyzes the volume scale and splits it into two components - seller volumes and buyer volumes, and also calculates the delta and cumulative delta. The indicator does not flicker or redraw, its calculation and plotting are performed fairly quickly, while using the data from the smaller (relative to the current) periods. The indicator operation modes can be switched using the Mode input variable: Buy - display only the buyer volumes. Sell - display only the seller volumes. BuySell -
FREE
Order Book, known also as Market Book, market depth, Level 2, - is a dynamically updated table with current volumes of orders to buy and to sell specific financial instument at price levels near Bid and Ask. MetaTrader 5 provides the means for receiving market book from your broker, but in real time only, without access to its history. The indicator OrderBook Cumulative Indicator accumulates market book data online and visualizes them on the chart. In addition, the indicator can show the market
Fibonacci and RSI Demo version MQL5
Carlos Daniel Vazquez Rosas
4 (1)
Fibonacci and RSI. Demo versión only works with GBPUSD. For full version, please, visit visit https://www.mql5.com/en/market/product/52101 The indicator is a combination of the Fibonacci and RSI indicators. Every time the price touches one of the fibonacci levels and the rsi condition is met, an audible alert and a text alert are generated. Parameters number_of_candles : It is the number of candles that will be calculated. If you put 100, the indicator will give you the maximum and min
FREE
Introduction This indicator detects volume spread patterns for buy and sell opportunity. The patterns include demand and supply patterns. You might use each pattern for trading. However, these patterns are best used to detect the demand zone (=accumulation area) and supply zone (=distribution area). Demand pattern indicates generally potential buying opportunity. Supply pattern indicates generally potential selling opportunity. These are the underlying patterns rather than direct price action. T
FREE
(traduction Google) Cet indicateur est basé sur le " Time Segmented Volume (TSV) " original développé par Worden Brothers, Inc . Cependant, j'ai ajouté quelques fonctionnalités supplémentaires à celui-ci. On peut choisir le prix à appliquer, au lieu d'avoir uniquement le prix de clôture par défaut utilisé par l'original. On peut également choisir la pondération de volume à utiliser, y compris un pseudo-volume basé sur la plage réelle, ou aucune pondération de volume du tout. (Original text) This
FREE
Basic Harmonic Pattern MT5
Mehran Sepah Mansoor
4.79 (48)
Cet indicateur identifie les   modèles harmoniques   les plus populaires qui prédisent les points d'inversion du marché. Ces modèles harmoniques sont des formations de prix qui se répètent constamment sur le marché des changes et suggèrent des mouvements de prix futurs possibles /   Version MT4 gratuite En outre, cet indicateur dispose d'un signal d'entrée sur le marché intégré, ainsi que de différents take profits et stop losses. Il convient de noter que, bien que l'indicateur de configurati
FREE
WH Price Wave Pattern MT5
Wissam Hussein
3.82 (11)
Bienvenue dans notre   modèle de vague de prix   MT5 -- (modèle ABCD) -- Le modèle ABCD est un modèle de trading puissant et largement utilisé dans le monde de l'analyse technique. Il s'agit d'un modèle de prix harmonique que les commerçants utilisent pour identifier les opportunités potentielles d'achat et de vente sur le marché. Avec le modèle ABCD, les traders peuvent anticiper les mouvements de prix potentiels et prendre des décisions éclairées sur le moment d'entrer et de sortir des tra
FREE
MW Volume
Martin Bittencourt
4 (5)
The Martinware Volume indicator plots a colored moving average over volume bars. The coloring uses three colors and can be done in different ways choosable by the user and is applied both to the average as to the volume bars. Three types of coloring are possible: None: no coloring is done Increasing or decreasing: changes the color depending on the current value being bigger or lesser than the previous one Volume relative to average: colors vary if the current volume is bigger or lesser then
FREE
PZ Pivot Points MT5
PZ TRADING SLU
4.95 (22)
This indicator displays pivot points in the chart, including historical vales, and supports many calculation modes for Pivot Points and S/R levels. [ Installation Guide | Update Guide | Troubleshooting | FAQ | All Products ] It plots historical levels for backtesting purposes It allows you to select the reference timeframe It implements different Pivot Point calculation modes It implements different SR calculation modes It implements customizable colors and sizes Calculation Modes The indi
FREE
Les acheteurs de ce produit ont également acheté
Atomic Analyst MT5
Issam Kassas
5 (14)
Tout d'abord, il convient de souligner que cet indicateur de trading n'est ni repainting, ni redrawing et ne présente aucun délai, ce qui le rend idéal à la fois pour le trading manuel et automatisé. Manuel de l'utilisateur : réglages, entrées et stratégie. L'Analyste Atomique est un indicateur d'action sur les prix PA qui utilise la force et le momentum du prix pour trouver un meilleur avantage sur le marché. Équipé de filtres avancés qui aident à éliminer les bruits et les faux signaux, et à
Tout d'abord, il convient de souligner que ce système de trading est un indicateur non repeint, non redessiné et non retardé, ce qui le rend idéal pour le trading manuel et automatisé. Cours en ligne, manuel et téléchargement de préréglages. Le "Système de Trading Smart Trend MT5" est une solution de trading complète conçue pour les traders débutants et expérimentés. Il combine plus de 10 indicateurs premium et propose plus de 7 stratégies de trading robustes, ce qui en fait un choix polyvalent
Quantum Trend Sniper
Bogdan Ion Puscasu
4.91 (43)
Présentation       Quantum Trend Sniper Indicator   , l'indicateur révolutionnaire MQL5 qui transforme la façon dont vous identifiez et négociez les inversions de tendance ! Développé par une équipe de traders expérimentés avec une expérience commerciale de plus de 13 ans,       Indicateur Quantum Trend Sniper       est conçu pour propulser votre parcours de trading vers de nouveaux sommets grâce à sa manière innovante d'identifier les inversions de tendance avec une précision extrêmement élevée
FX Power MT5 NG
Daniel Stein
5 (5)
Obtenez votre mise à jour quotidienne du marché avec des détails et des captures d'écran via notre Morning Briefing ici sur mql5 et sur Telegram ! FX Power MT5 NG est la nouvelle génération de notre très populaire indicateur de force des devises, FX Power. Et qu'est-ce que ce compteur de force de nouvelle génération offre ? Tout ce que vous avez aimé de l'original FX Power PLUS Analyse de la force de l'OR/XAU Des résultats de calcul encore plus précis Périodes d'analyse configurables individuel
Reversal First Impulse levels (RFI)      INSTRUCTIONS        RUS       -       ENG              R ecommended to use with an indicator   -   TREND PRO -  Version MT4                 A key element in trading is zones or levels from which decisions to buy or sell a trading instrument are made. Despite attempts by major players to conceal their presence in the market, they inevitably leave traces. Our task was to learn how to identify these traces and interpret them correctly. Main functions:: Di
Trend Screener Pro MT5
STE S.S.COMPANY
4.88 (64)
Indicateur de tendance, solution unique révolutionnaire pour le trading et le filtrage des tendances avec toutes les fonctionnalités de tendance importantes intégrées dans un seul outil ! Il s'agit d'un indicateur multi-période et multi-devises 100 % non repeint qui peut être utilisé sur tous les symboles/instruments : forex, matières premières, crypto-monnaies, indices et actions. Trend Screener est un indicateur de suivi de tendance efficace qui fournit des signaux de tendance fléchés avec des
Tout d'abord, il convient de souligner que cet outil de trading est un indicateur non repeint, non redessiné et non retardé, ce qui le rend idéal pour le trading professionnel. Cours en ligne, manuel utilisateur et démonstration. L'indicateur Smart Price Action Concepts est un outil très puissant à la fois pour les nouveaux et les traders expérimentés. Il regroupe plus de 20 indicateurs utiles en un seul, combinant des idées de trading avancées telles que l'analyse du trader Inner Circle et
FX Volume MT5
Daniel Stein
4.94 (17)
Obtenez votre mise à jour quotidienne du marché avec des détails et des captures d'écran via notre Morning Briefing ici sur mql5 et sur Telegram ! FX Volume est le PREMIER et SEUL indicateur de volume qui fournit un VRAI aperçu du sentiment du marché du point de vue d'un courtier. Il fournit des informations impressionnantes sur la façon dont les acteurs institutionnels du marché, comme les courtiers, sont positionnés sur le marché des changes, bien plus rapidement que les rapports COT. Voir c
TPSproTREND PrO MT5
Roman Podpora
4.88 (8)
TPSpro TRENDPRO  - is a trend indicator that automatically analyzes the market and provides information about the trend and each of its changes, as well as giving signals for entering trades without redrawing! The indicator uses each candle, analyzing them separately. referring to different impulses - up or down impulse. Exact entry points into transactions for currencies, crypto, metals, stocks, indices!  -  Version MT4               DETAILED DESCRIPTION               R ecommended to use with
Top indicator for MT5   providing accurate signals to enter a trade without repainting! It can be applied to any financial assets:   forex, cryptocurrencies, metals, stocks, indices .  Watch  the video  (6:22) with an example of processing only one signal that paid off the indicator! MT4 version is here It will provide pretty accurate trading signals and tell you when it's best to open a trade and close it. Most traders improve their trading results during the first trading week with the help of
FxaccurateLS
Shiv Raj Kumawat
WHY IS OUR FXACCCURATE LS MT5 THE PROFITABLE ? PROTECT YOUR CAPITAL WITH RISK MANAGEMENT Gives entry, stop and target levels from time to time. It finds Trading opportunities by analyzing what the price is doing during established trends. POWERFUL INDICATOR FOR A RELIABLE STRATEGIES We have made these indicators with a lot of years of hard work. It is made at a very advanced level. Established trends provide dozens of trading opportunities, but most trend indicators completely ignore them!
AW Trend Predictor MT5
AW Trading Software Limited
4.78 (58)
La combinaison des niveaux de tendance et de panne dans un seul système. Un algorithme d'indicateur avancé filtre le bruit du marché, détermine la tendance, les points d'entrée, ainsi que les niveaux de sortie possibles. Les signaux indicateurs sont enregistrés dans un module statistique, qui vous permet de sélectionner les outils les plus appropriés, montrant l'efficacité de l'historique des signaux. L'indicateur calcule les marques Take Profit et Stop Loss. Manuel et instruction ->   ICI   / v
ICT, SMC, SMART MONEY CONCEPTS, SMART MONEY, Smart Money Concept, Support and Resistance, Trend Analysis, Price Action, Market Structure, Order Blocks, BOS/CHoCH,   Breaker Blocks ,  Momentum Shift,   Supply&Demand Zone/Order Blocks , Strong Imbalance,   HH/LL/HL/LH,    Fair Value Gap, FVG,  Premium  &   Discount   Zones, Fibonacci Retracement, OTE, Buy Side Liquidity, Sell Side Liquidity, BSL/SSL Taken, Equal Highs & Lows, MTF Dashboard, Multiple Time Frame, BigBar, HTF OB, HTF Market Structure
Bill Williams Advanced
Siarhei Vashchylka
5 (5)
Bill Williams Advanced is designed for automatic chart analysis using Bill Williams' "Profitunity" system. The indicator analyzes four timeframes at once. Manual (Be sure to read before purchasing) Advantages 1. Automatically analyzes the chart using the "Profitunity" system of Bill Williams. The found signals are placed in a table in the corner of the screen. 2. Equipped with a trend filter based on the Alligator indicator. Most of the system signals are recommended to be used only accordi
Le profit de la structure du marché change à mesure que le prix s'inverse et recule. L'indicateur d'alerte d'inversion de la structure du marché identifie le moment où une tendance ou un mouvement de prix approche de l'épuisement et est prêt à s'inverser. Il vous avertit des changements dans la structure du marché qui se produisent généralement lorsqu'un renversement ou un recul majeur est sur le point de se produire. L'indicateur identifie initialement les cassures et la dynamique des prix,
The Volume by Price Indicator for MetaTrader 5 features Volume Profile and Market Profile TPO (Time Price Opportunity). Volume and TPO histogram bar and line charts. Volume Footprint charts. TPO letter and block marker collapsed and split structure charts. Session filtering and grouping. Static, dynamic and flexible range segmentation and compositing methods with relative and absolute visualizations. Graphical layering, positioning and styling options to suit the user's analytic and aesthetic n
Easy By Sell is a market indicator for opening and closing positions. It becomes easy to track market entries with alerts. It indicates trend reversal points when a price reaches extreme values ​​and the most favorable time to enter the market. it is as effective as a Fibonacci to find a level but it uses different tools such as an algorithm based on ATR indicators and Stochastic Oscillator. You can modify these two parameters as you wish to adapt the settings to the desired period. My othe
Legacy of Gann for MT5
Pavel Zamoshnikov
5 (6)
The indicator very accurately determines the levels of the possible end of the trend and profit fixing. The method of determining levels is based on the ideas of W.D.Gann, using an algorithm developed by his follower Kirill Borovsky. Extremely high reliability of reaching levels (according to K. Borovsky  - 80-90%) Indispensable for any trading strategy – every trader needs to determine the exit point from the market! Precisely determines targets on any timeframes and any instruments (forex, met
"Piranha" - an autonomous trading system that determines overbought and oversold levels on the chart. Red and blue zones represent overbought and oversold levels respectively. Entry points are marked with arrows: a downward arrow in the red zone for "sell" and an upward arrow in the blue zone for "buy". The Take profit level is indicated by the green moving average. Key features: Adjusting the Take profit level as the green moving average changes position. Averaging ability when a new market e
Quantum Heiken Ashi PRO MT5
Bogdan Ion Puscasu
4.5 (8)
Présentation du   Quantum Heiken Ashi PRO Conçues pour fournir des informations claires sur les tendances du marché, les bougies Heiken Ashi sont réputées pour leur capacité à filtrer le bruit et à éliminer les faux signaux. Dites adieu aux fluctuations de prix déroutantes et bonjour à une représentation graphique plus fluide et plus fiable. Ce qui rend le Quantum Heiken Ashi PRO vraiment unique, c'est sa formule innovante, qui transforme les données traditionnelles des chandeliers en barres col
Advanced Supply Demand MT5
Bernhard Schweigert
4.53 (15)
La meilleure solution pour tout commerçant débutant ou expert ! Cet indicateur est un outil de trading unique, de haute qualité et abordable car nous avons intégré un certain nombre de fonctionnalités propriétaires et une nouvelle formule. Avec cette mise à jour, vous pourrez afficher des zones à double horaire. Vous pourrez non seulement afficher un TF plus élevé, mais afficher les deux, le graphique TF, PLUS le TF supérieur : AFFICHAGE DES ZONES NICHÉES. Tous les traders Supply Demand vont ado
IX Power MT5
Daniel Stein
5 (3)
IX Power   apporte enfin la précision imbattable de FX Power aux symboles non-Forex. Il détermine avec précision l'intensité des tendances à court, moyen et long terme de vos indices, actions, matières premières, ETF et même crypto-monnaies préférés. Vous pouvez   analyser tout ce que   votre terminal a à offrir. Essayez-le et découvrez comment   votre timing s'améliore considérablement   lors de vos transactions. Caractéristiques principales d'IX Power Résultats de calcul précis à 100 %,
L'indicateur d'inversion ADR vous montre en un coup d'œil où le prix se négocie actuellement par rapport à sa fourchette quotidienne moyenne normale. Vous recevrez des alertes instantanées par pop-up, e-mail ou push lorsque le prix dépasse sa fourchette moyenne et les niveaux supérieurs de votre choix afin que vous puissiez sauter rapidement dans les reculs et les inversions. L'indicateur trace des lignes horizontales sur le graphique aux extrêmes de la fourchette quotidienne moyenne ainsi que
Gartley Hunter Multi
Siarhei Vashchylka
5 (7)
Gartley Hunter Multi - An indicator for searching for harmonic patterns simultaneously on dozens of trading instruments and on all possible timeframes. Manual (Be sure to read before purchasing) | Version for MT4 Advantages 1. Patterns: Gartley, Butterfly, Shark, Crab. Bat, Alternate Bat, Deep Crab, Cypher 2. Simultaneous search for patterns on dozens of trading instruments and on all possible timeframes 3. Search for patterns of all possible sizes. From the smallest to the largest 4. A
TPA True Price Action indicator reveals the true price action of the market makers through 100% non-repainting signals strictly at the close of a candle! TPA shows entries and re-entries, every time the bulls are definitely stronger than the bears and vice versa. Not to confuse with red/green candles. The shift of power gets confirmed at the earliest stage and is ONE exit strategy of several. There are available now two free parts of the TPA User Guide for our customers. The first "The Basics"
** All Symbols x All Timeframes scan just by pressing scanner button ** ***Contact me after purchase to send you instructions and add you in "123 scanner group" for sharing or seeing experiences with other users. After 17 years of experience in the markets and programming, Winner indicator is ready. I would like to share with you! Introduction The 123 Pattern Scanner indicator with a special enhanced algorithm is a very repetitive common pattern finder with a high success rate . Interestingly,
La meilleure solution pour tout débutant ou trader expert ! Cet indicateur est un outil de trading unique, de haute qualité et abordable car nous avons incorporé un certain nombre de caractéristiques exclusives et une nouvelle formule. Avec seulement UN graphique, vous pouvez lire la force de la devise pour 28 paires Forex ! Imaginez comment votre trading va s'améliorer parce que vous êtes capable de repérer le point de déclenchement exact d'une nouvelle tendance ou d'une opportunité de scalp
**   All Symbols   x   All Timeframes   scan just by pressing scanner button ** *** Contact me after the purchase to send you instructions and add you in "Trend Reversal group" for sharing or seeing experiences with other users. Introduction: Trendlines are the most famous technical analysis in trading . Trendlines continually form on the charts of markets across all the different timeframes providing huge opportunities for traders to jump in and profit on the action. In the other hand,  The tre
Ce tableau de bord affiche les derniers   modèles harmoniques   disponibles pour les symboles sélectionnés, ce qui vous permettra de gagner du temps et d'être plus efficace /   version MT4 . Indicateur gratuit:   Basic Harmonic Pattern Colonnes de l'indicateur Symbol :   les symboles sélectionnés apparaissent Trend   :   haussière ou baissière Pattern :   type de motif (gartley, papillon, chauve-souris, crabe, requin, cypher ou ABCD) Entry:   prix d'entrée SL:   prix du stop loss TP1:   1
Nouvelle génération de zones d'approvisionnement et de demande automatisées. Algorithme nouveau et innovant qui fonctionne sur n'importe quel graphique. Toutes les zones sont créées dynamiquement en fonction de l'action des prix du marché. DEUX TYPES D'ALERTES --> 1) QUAND LE PRIX ATTEINT UNE ZONE 2) QUAND UNE NOUVELLE ZONE SE FORME Vous n'obtenez pas un indicateur inutile de plus. Vous obtenez une stratégie de trading complète avec des résultats prouvés.     Nouvelles fonctionnali
Plus de l'auteur
MediasCoiote
Alexandre Moraes De Souza Lima
5 (1)
As médias coiote automatizam a leitura de analise de médias rápidas e lentas no saldo do volume e preço. Quando as médias estão em modo compra, a coloração do candle fica azul. Quando as médias estão em modo venda, a coloração do candle fica magenta. Quando a coloração fica verde ou vermelho, temos a tomada das médias no volume mas não no preço, quando isso ocorre é um sinal de atenção. A concepção do indicador é ser utilizado para operações em saída de consolidações na direção da tendencia d
FREE
Coiote Volume Candle
Alexandre Moraes De Souza Lima
Candle de Volume Coiote O Candle de Volume  Coiote é um indicador que mede a variação do volume no tempo, seu corpo é pela variação do volume anterior pelo volume atual, sua direção pelo fechamento do preço. 1. identificado um topo no indicador Candle de Volume  Coiote (marcado o fechamento do preço). 2. identificado um fundo no indicador Candle de Volume Coiote (marcado o fechamento do preço). 3. fundo 3 igual fundo 2 no indicador Candle de Volume Coiote, preço no 3 é diferente de fundo 2
FREE
CoioteCandlePVA
Alexandre Moraes De Souza Lima
Candle com coloração de Volume Price Analysis  (VPA) segundo as definições da Anna Coulling, é possível configurar períodos de  climax e rising, fator de extreme e fator de rising. Pode-se usar volume real ou volume de ticks. O VPA considera a variação de preço por volume do período, indicando se um movimento está recebendo ignição, está em seu climax ou se já não existe mais interesse.
FREE
Divergence Wave
Alexandre Moraes De Souza Lima
Ondas de Divergência. Antes do mercado tomar um sentido e se manter em tendencia, existem sinais que podem ser lidos, nos permitindo assim entender o "lado mas forte", e realizar trades de maior probabilidade de acerto com risco reduzido, esses movimentos são persistentes e contínuos, proporcionando excelente rentabilidade. Ondas de Divergência é um histograma que acumula a divergência de  entre preço e volume a cada tick, permitindo assim encontrar pontos de absorção, áreas de acumulo e distrib
FREE
CoioteChart
Alexandre Moraes De Souza Lima
O Indicador CoioteChart foi construído pra facilitar desde a leitura de contexto de mercado até a micro estrutura do candle, facilitando ajustes operacionais e tomadas e decisão com alta eficácia. Possui um controle para habilitar e desabilitar a visualização das pocs, vwap, zonas de máxima e mínima negociação, pode ser utilizado data sources de tempos gráficos para cálculos ou utilizado os ticks de agressão do time and trades, funciona com volume real e volume de ticks. As colorações são at
CoioteTarget
Alexandre Moraes De Souza Lima
Projeção de alvos harmônicos com dois cliques, os alvos possuem melhor qualidade quando ancorados em candles climáticos, seja de ignição ou exaustão ou em pivôs de alto volume. Funciona com qualquer ativo (volume real e volume tick), em qualquer tempo gráfico, ações, indicies, futuros, forex, criptomoedas, commodities, energia, mineiro e qualquer outro. As projeções devem respeitar os princípios de confluência e simetria, portanto não devem ser utilizados unicamente como critério de decisão, se
CoioteTradeDetector
Alexandre Moraes De Souza Lima
O CoioteTradeDetector monitora o time and trades (time and salles), é possível criar filtros de alerta gráficos (plotagem de linha com qtd) com variações de agressões pré-definidas. É possível monitorar grandes lotes, ordens diretas e alta frequência de trades. Para perfeito funcionamento do produto é preciso ter os dados de agressão da corretora (acesso completo ao times and trades).
CoioteAverageSpreed
Alexandre Moraes De Souza Lima
O indicador CoioteAverageSpreed é uma releitura do indicador AverageSpreed. Ele mostra a relação de esforço x resultado entre o volume e a volatilidade do preço. Com o volume heatmap é possível identificar visualmente se o preço foi deslocado com uma quantidade maior de volume e se o deslocamento do preço apresentou maior resultado ou não. É possível identificar momentos de ignição e exaustão do movimento, além de injeções de fluxo para dar continuidade a um movimento.
CoioteWeisWave
Alexandre Moraes De Souza Lima
CoioteWeisWave é uma releitura do indicador de VSA WeisWave com indicação do estouro de fractal, método de analise dos TradersPiolhos e implementado originalmente pelo Trader Dario Junqueira. A versão Coiote foi reprojetada para indicação da volatilidade do volume no fractal. A coloração adicional (azul e magenta) dão sinais de entrada, saída e pontos de gerenciamento, podendo ser usados também como suporte e resistência. Existem 3 modos de exibição do weis wave, por volume total, por range e p
CoioteDeltaCandle
Alexandre Moraes De Souza Lima
O indicador precisa do times and trades (time and salles) para seu correto funcionamento. O Volume é composto por ordens à mercado compradoras e vendedoras que agrediram o book de ofertas, o Delta é a diferença das ordens a mercado compradoras e vendedoras. O CoioteDeltaCandle monitora o time and trades e à partir dos dados de agressão forma candles temporais em 4 formatos diferentes, possível selecionar à partir de configurações. São elas: Modo com acumulação. Modo com pavio. Modo
Coiote Book Balance
Alexandre Moraes De Souza Lima
Coiote Book Balance é um indicador que monitora o livro de ofertas e indica de maneira simplificada o níveis de renovação de ordens agrupados no timeframe gáfico, mostrando quanto o maior lado renovou e a diferença dessas renovações. Além disso, é possível visualizar em quais preços estão as maiores ordens da cada lado, o preço teórico dessa liquidez e a quantidade de lotes em tempo real. Para correto funcionamento do indicador é preciso que o livro de ofertas seja aberto antes da inclusão do in
OrderFlowMomentun
Alexandre Moraes De Souza Lima
order flow indicator that monitors price formation effectively identifying market direction. As it is an extremely fast indicator, it should be used in support and resistance, static and dynamic regions, the OrderFlowWay will predictively indicate the veracity of breakouts that have not happened yet, showing whether there is action by big players in the traded price. Operations must be carried out after crossing the lines, preferably close to the zero axis of the indicator.
CoioteOscilator
Alexandre Moraes De Souza Lima
CoioteOscilator é um rastreador de tendência e padrões de estruturas gráficas. O Indicador é composto de 3 elementos. oscilador principal lento: histograma com nível de 0 até 50 e 4 cores, 2 compradoras, de 0 até 30 e acima de 30 e duas vendedoras, de 0 até 30 e acima de 30.   oscilador principal  rápido: linha magenta com nível de -50 até 50. gatilho:  linha amarela com nível de -50 até 50. O  oscilador principal lento  é um rastreador de tendência primaria. O  oscilador   principal  rápido é
Visual Heatmap Book Analyzer
Alexandre Moraes De Souza Lima
Visual Heatmap Book Analyser This indicator monitors the market liquidity and generates colors based on order patterns, quantities, and renewal activities in the book. This allows you to visualize the order flow and identify areas of high and low liquidity and activity. The indicator uses machine learning techniques to analyze the order behavior in the book, enabling it to detect patterns and trends in orders, allowing you to make informed decisions about your trading operations. The color pal
Filtrer:
hernannfx
37
hernannfx 2022.12.23 03:56 
 

Muito Bom, acertivo e intuitivo !

07193474839
33
07193474839 2022.05.23 03:58 
 

Comprei esse indicador mas não esta funcionando, como faço para ter ajuda com isso?

Alexandre Moraes De Souza Lima
1264
Réponse du développeur Alexandre Moraes De Souza Lima 2022.07.06 18:59
olá, primeiramente desculpa a demora para responder.
Por favor procure no Telegram o grupo CoioteTrader (https://t.me/coiotetrader).
Répondre à l'avis
Version 1.1 2022.08.06
ajustes.