MACD Intraday Trend PRO MT4
- Indicateurs
- JETINVEST
- Version: 1.10
- Mise à jour: 7 juin 2021
- Activations: 20
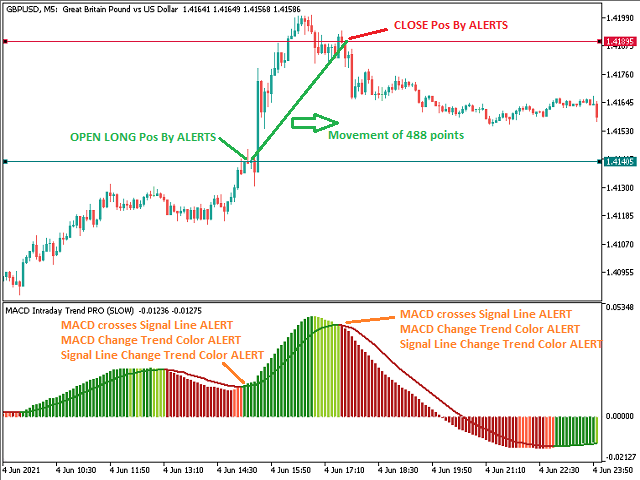
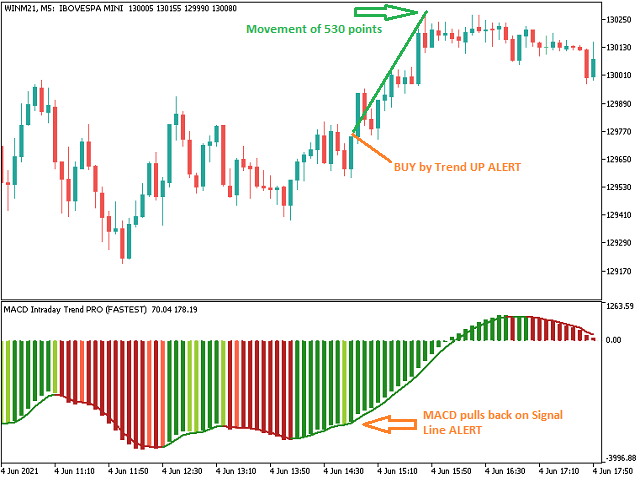
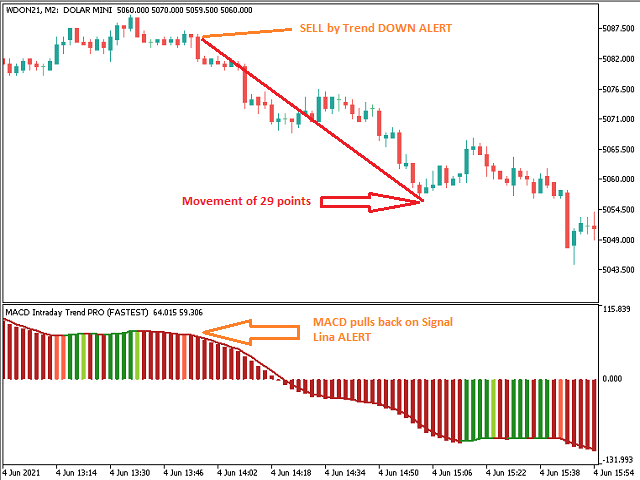
MACD Intraday Trend PRO est un indicateur développé grâce à une adaptation du MACD original créé par Gerald Appel dans les années 1960.
Au fil des années de négociation, il a été observé qu'en modifiant les paramètres du MACD avec les proportions de Fibonacci, nous obtenons une meilleure présentation de la continuité des mouvements de tendance, ce qui permet de détecter plus efficacement le début et la fin d'une tendance de prix.
En raison de son efficacité à détecter les tendances de prix, il est également possible d'identifier très clairement les divergences de hauts et de bas, profitant ainsi mieux des opportunités de trading.
Caractéristiques
- L'indicateur MACD Intraday Trend PRO fonctionne avec n'importe quelle paire de devises, à n'importe quelle période et avec les graphiques Renko.
- Il est possible de régler la vitesse de détection de tendance en sélectionnant 5 modes :
- LE PLUS RAPIDE
- VITE
- ORDINAIRE
- LENT
- LE PLUS LENT
Ressources
- Il dispose de 6 alertes configurables :
- MACD retire la ligne de signal
- MACD traverse la ligne de signal
- MACD franchit le niveau zéro
- La ligne de signal franchit le niveau zéro
- MACD change TENDANCE Couleur
- Changement de ligne de signal TENDANCE Couleur
- Pour chaque alerte il est possible de paramétrer :
- Surgir
- Son(Il existe 13 types de sons disponibles.)
- Notifications sur smartphone
- Popup et son
- Notification contextuelle et smartphone
- Notification sonore et Smartphone
- Notification Popup, Son et Smartphone
Intégration avec des conseillers experts ou d'autres indicateurs
- Il y a 8 tampons disponibles pour l'accès et l'intégration avec des conseillers experts ou d'autres indicateurs, ils sont remplis même avec les alertes désactivées, ce sont :
- ID de tampon 5 : valeur MACD
- ID de tampon 6 : valeur de la ligne de signal
- ID de tampon 12 : Alerte 1
- ID de tampon 13 : Alerte 2
- ID de tampon 14 : Alerte 3
- ID de tampon 15 : alerte 4
- ID de tampon 16 : alerte 5
- ID de tampon 17 : alerte 6
- Les Buffers se référant aux 6 Alertes peuvent contenir les valeurs suivantes :
- Tendance baissière : (-1)
- Tendance non définie : (0)
- Tendance haussière : (+1)
Si vous avez encore des questions, merci de me contacter par message direct: https://www.mql5.com/fr/users/robsjunqueira/


L'utilisateur n'a laissé aucun commentaire sur la note