Active Pivot Levels
- Indicateurs
- Robert Gerald Wood
- Version: 1.30
- Mise à jour: 4 novembre 2021
- Activations: 5
Les niveaux pivots sont un niveau technique bien établi et reconnu sur tous les marchés.
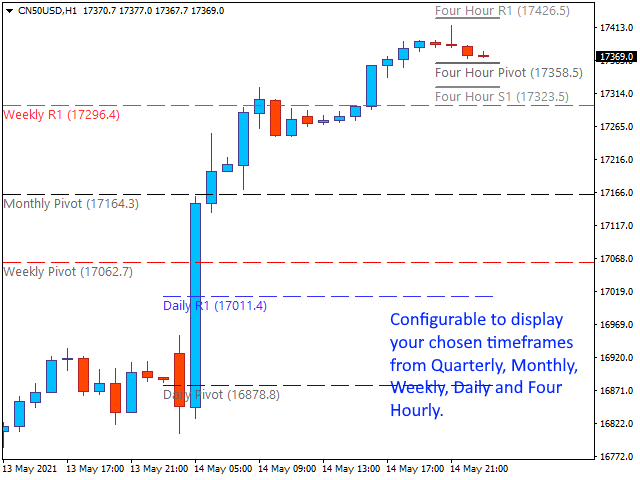
Cet indicateur dessinera les pivots trimestriels, mensuels, hebdomadaires, quotidiens et quadri-horaires actuels sur le graphique, pour n'importe quel symbole. Vous pouvez également afficher les niveaux de support et de résistance pour chaque période et choisir lequel afficher des niveaux 1 à 4.
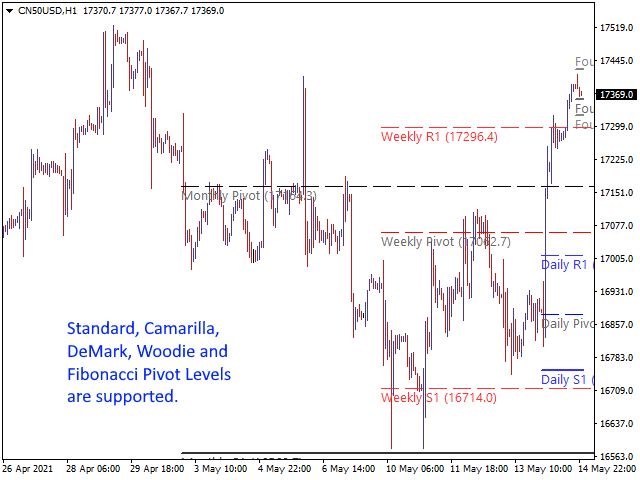
Choisissez le type de pivot parmi :
- Standard
- Camarilla
- DeMark
- boisé
- Fibonacci
Veuillez noter que les pivots DeMark ont un seul niveau de support et de résistance conformément aux spécifications d'origine.
Le mur indicateur change la façon dont les lignes sont tracées si la ligne a été touchée par le prix. Cela peut être très utile et la force du support ou de la résistance des lignes diminue considérablement une fois touché.
Vous pouvez choisir d'afficher le niveau de pivotement prévu, pour chacune des périodes. Cela utilisera le même calcul que les pivots normaux, mais fonctionnera sur les délais actuellement incomplets. En tant que tel, il est préférable de l'utiliser vers la fin de cette période, lorsque le prix a déjà couvert la majorité de sa fourchette.
Paramètres
https://www.mql5.com/en/blogs/post/746511
Il s'agit d'un indicateur très configurable, vous pouvez donc le faire fonctionner comme vous le souhaitez.

Another great indicator form this author. Runs perfectly, does not slow down MT4 like other pivot indicators. Fully customizable for all styles of trading whether you only need 1 pivot line or if you need many pivot and SR lines. Pivot line changes style once touched by price, great feature. New toggle button keeps your charts clean when you don't need to see the lines. Author is very responsive and helpful.